Forecast by expected closing month — and why the column total is not the cards
What this does
CRM › Reporting › Forecast lays your open opportunities out by the month they are expected to close, with a running total per month. It is the screen that answers "what is likely to land, and when".
Two things about it are easy to get wrong and both change the number you would quote: whose deals it shows, and how the monthly total is calculated.
Before you start
- An opportunity only appears if it has an Expected Closing date. Deals without one are absent from the forecast entirely, however large they are.
- The Expected Revenue and the probability on each deal are what the forecast is made of. A forecast is only as honest as those two fields.
- The screen opens showing your own pipeline, not the company's.
Steps
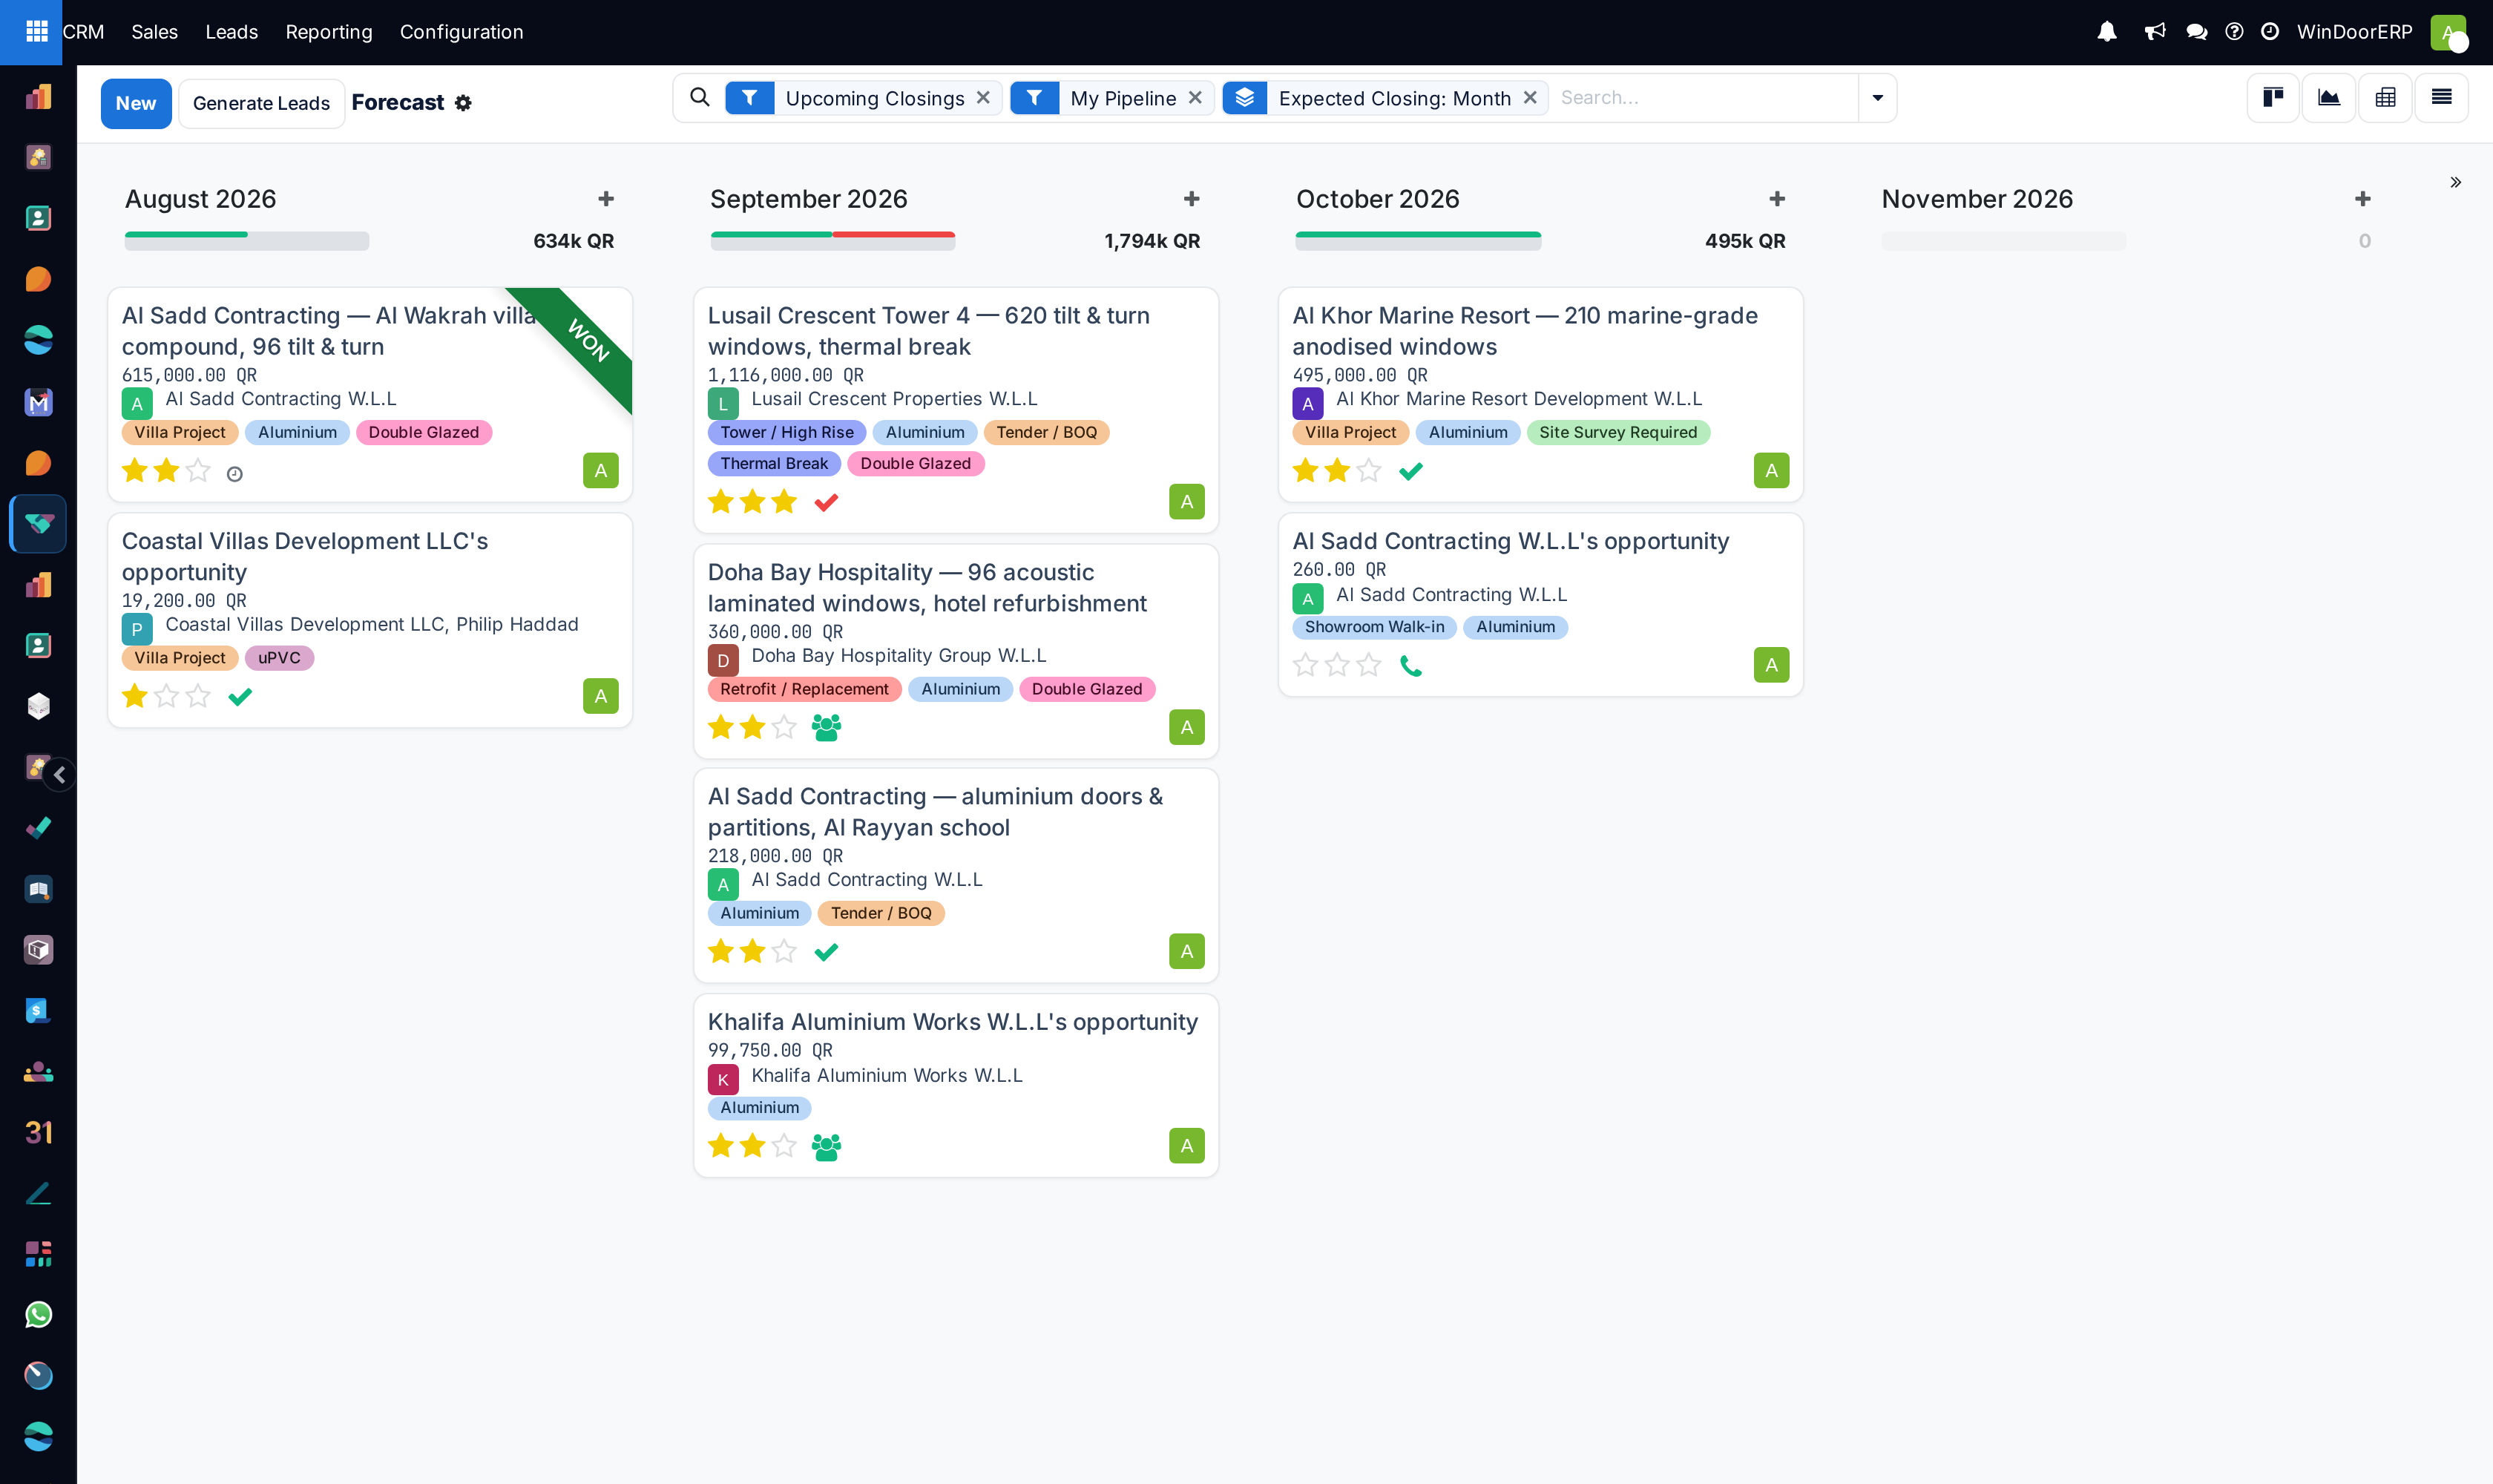
The column total is weighted by probability, not the sum of the deals
Each month's figure is the sum of every opportunity's expected revenue multiplied by its probability. It is not what you would get by adding up the amounts on the cards.
The gap is large. On the demonstration data, September's cards add up to 4,030,000 QR while the column reads 1,794k — the weighted figure is under half the raw one, because most of those deals sit at low probabilities.
This is the right way to forecast, but it catches people out: a salesperson reading the card amounts and a manager reading the column heading are quoting two different numbers from the same screen. When you cite a forecast, say which one you mean.
-
01
Open CRM › Reporting › Forecast.
-
02
Read the three facets: Upcoming Closings, My Pipeline and Expected Closing: Month. Remove My Pipeline to see the whole team.
-
03
Read each column heading: the month, and beneath it the forecast total for that month.
-
04
Drag a card to another month to change its expected closing date — the totals follow immediately.
-
05
Switch to the graph or pivot with the buttons at the top right when you need the numbers rather than the cards.
My Pipeline is on by default
The My Pipeline facet restricts the board to opportunities assigned to you. A manager opening this screen sees their own deals, not the team's, and the monthly totals are correspondingly small.
Remove the facet for the whole company, or replace it with a grouping by salesperson to compare people's forecasts side by side. This is the single most common reason a forecast "looks wrong".
Reading a column
| Month heading | The expected closing month, and the weighted total beneath it. |
|---|---|
| Progress bar | Splits the column by the state of each deal's next activity, so a bar with a lot of red is a month full of overdue follow-ups. |
| Card amount | That opportunity's expected revenue, unweighted. |
| Stars | Priority, set by hand on the deal. |
| Activity dot | The next activity's state — the colour is what the progress bar is counting. |
| Won ribbon | A deal already won still appears in the month it was expected to close. |
| Empty months | Still shown, with a zero, so a gap in the pipeline is visible rather than hidden. |
Troubleshooting
| The forecast is far smaller than the pipeline | Either My Pipeline is still applied, or you are comparing the weighted column total against raw card amounts. |
|---|---|
| A big deal is missing | It has no Expected Closing date. Set one and it appears. |
| The totals never change | Probabilities are not being maintained. The forecast is entirely driven by them. |
| Everything sits in one month | Expected closing dates are being left at their default rather than set to a realistic date. |
| A won deal is still counted | Won deals remain in their expected month. Group by Is Won, or use the pipeline for a live view. |
Common mistakes
- Quoting the column total and the card amounts interchangeably. One is weighted, the other is not.
- Reviewing a team's forecast without removing My Pipeline.
- Leaving probabilities at their stage default and then treating the forecast as a commitment.
- Forgetting that a deal with no expected closing date is invisible here — the pipeline can look healthy while the forecast is empty.
Was this article helpful?
Thanks — your feedback helps.
Running a window or door factory?
Ask for a demo