Use Smart Insights: statistical checks, trend analysis, what-if scenarios and benchmarks
What this does
Accounting › Smart Insights is a set of statistical checks and planning tools that run over your posted ledger: outlier detection on journal amounts, duplicate-document scoring, missing-entry and trend alerts, month-by-month trend analysis with forecasts, a financial KPI scorecard, what-if percentage scenarios, industry benchmark comparisons, a spreadsheet import wizard, and a build-your-own report designer. Everything here is deterministic statistics — Z-scores, moving averages, linear regression, fixed rule thresholds — computed from your own general ledger; no external service is called and nothing leaves the database.
Before you start
- Posted journal entries — several months of history. The detectors need at least five entries per account, and trend analysis refuses to run on fewer than three months of data.
- Most screens here start empty on a fresh database: only Run Detection (anomalies) and Generate Analysis (financial trends) are wired to the interface. The other registers fill only when their generators are run by an administrator.
Detection & Alerts
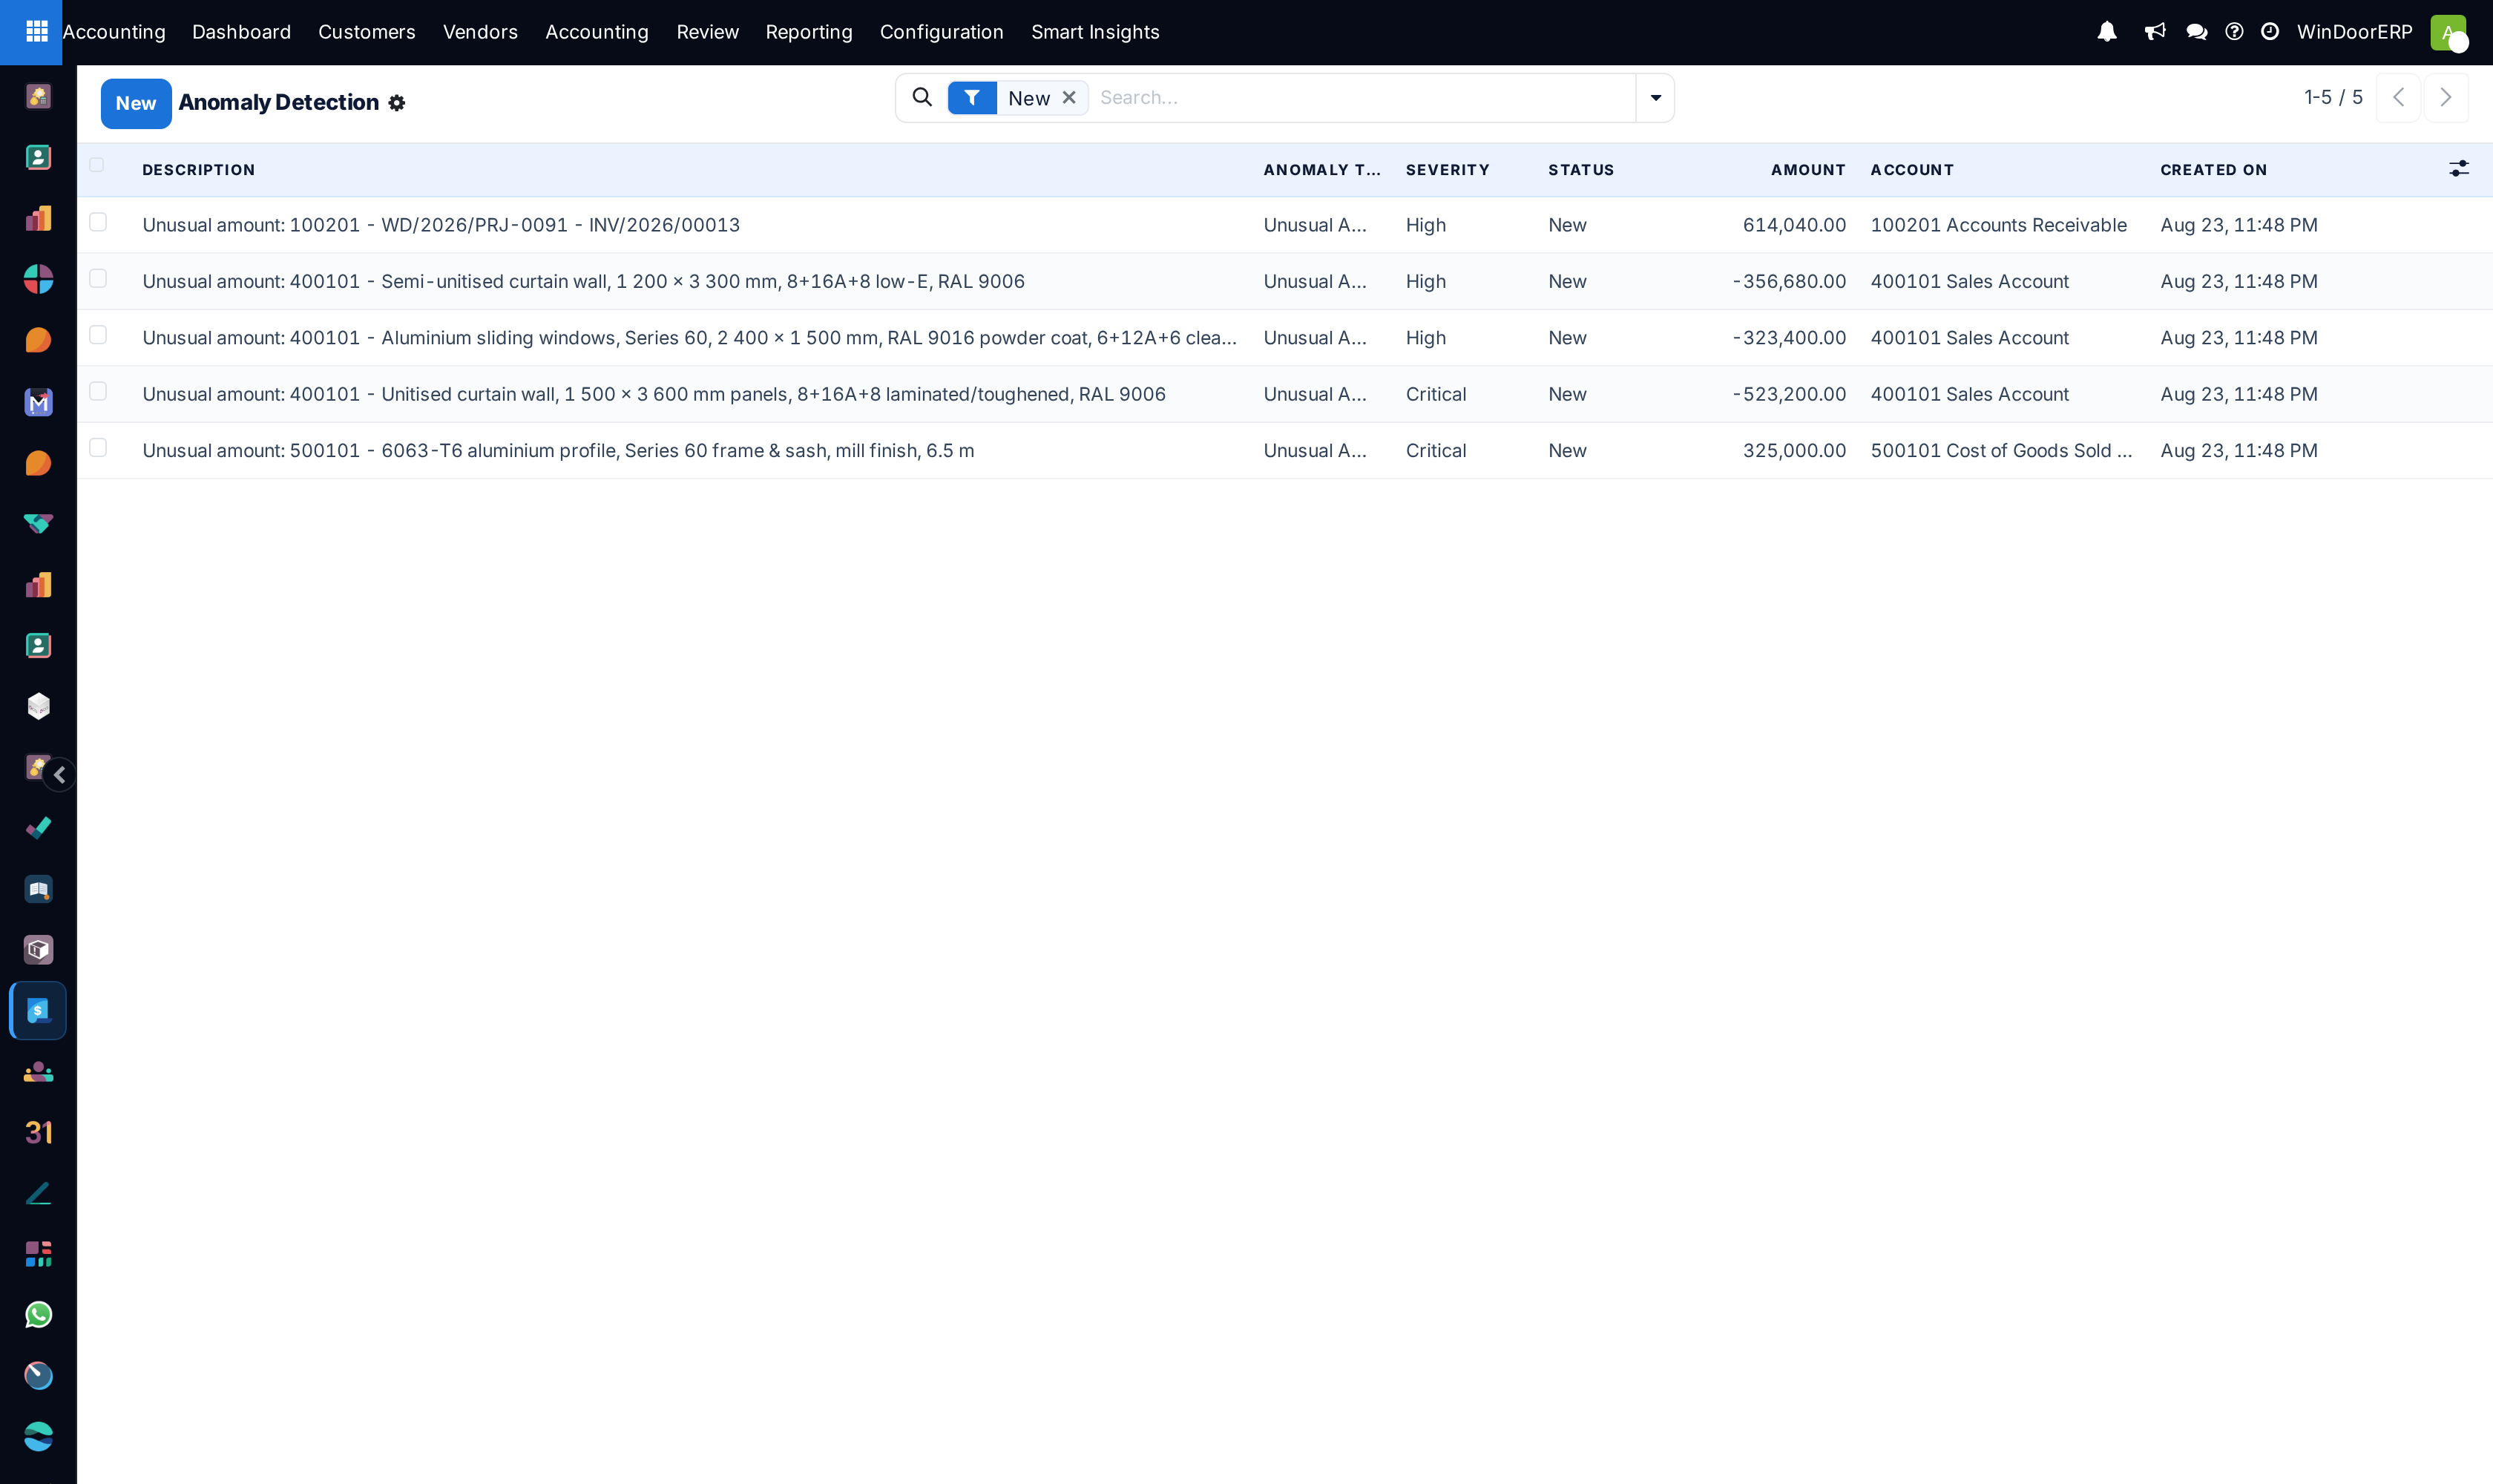
Anomaly Detection is the one detector you can run yourself: Smart Insights › Detection & Alerts › Run Detection scans last month's posted journal items account by account and flags any line more than three standard deviations from that account's own average as an Unusual Amount — Critical beyond four deviations, High otherwise, each with its Z-score and a plain-language explanation. If nothing is found you get a notification with the number of transactions analysed. Triage each finding with Mark Reviewed, Confirm Issue, or Dismiss; there is no way to re-open a dismissed record.
The three sibling registers hold other alert types, each with its own triage flow:
| Screen | What a record means |
|---|---|
| Duplicate Detection | A pair of same-type documents for the same partner scored 60+ points for similarity: within 1% on amount scores 40 (within 5% scores 20), dated within 3 days scores 30 (within 7 days, 15), and an identical reference scores 30. Covers vendor bills and refunds as well as customer invoices and credit notes. Only the reference is compared — line descriptions are not. |
| Missing Entry Alerts | An account-and-partner pair that has posted in at least five of the last six months but has nothing this month; the expected amount is the average of the recent months. |
| Trend Alerts | One of four company-level checks: revenue declining three months running, expenses up more than 15% half-over-half, gross margin compressed more than 10%, or cash negative in half the sampled months. Each carries static recommended actions and an Acknowledge → Investigate → Resolve/Dismiss flow. |
Note
In this release only anomaly detection has a run button. Duplicate, missing-entry, and trend detection have no button and no scheduled job — their lists stay empty until an administrator runs the generators from the server shell. Two interface defects to know about: the Confirm Duplicate / Not a Duplicate buttons on a duplicate record never appear (use the status bar instead), and a missing-entry alert can only be Dismissed from the interface, never marked resolved.
Running the monthly insight pass
-
01
Open Smart Insights › Detection & Alerts › Run Detection after the month's entries are posted, and triage the anomalies it creates.
-
02
Open Trend Analysis › Generate Analysis, pick the metric (Revenue, Expense, Profit, margins, expense ratio, or working capital) and a period of at least three months, and click Generate Analysis — or Generate All Types for the five core metrics at once.
-
03
Read the created Financial Trends record: direction, month-over-month, quarter-over-quarter and year-over-year growth, volatility, detected seasonality, moving averages, and a linear-regression forecast for the next 3, 6, and 12 months with a confidence figure that rises with history and falls with volatility.
-
04
Check KPI Dashboard and Year-over-Year for the scorecard view — margins, liquidity ratios, DSO and DPO, a 0-100 health score, and up to six years of comparative values with 3- and 5-year CAGR.
-
05
Model a decision in Scenarios & Planning › What-If Scenarios, and compare your ratios under Industry Benchmarks.
What-If Scenarios
A scenario takes a base period of actuals and applies three percentage levers — Revenue Change %, COGS Change %, and Operating Expense Change %. Calculate fills the base figures, the adjusted figures, and the revenue and profit impact. That is the whole model: to test "aluminium billet up 15%", you translate it yourself into a COGS percentage — the scenario works on whole account-type totals and knows nothing about individual materials, products, or projects. Scenarios have no lock or approval state; every record stays editable.
Industry Benchmarks
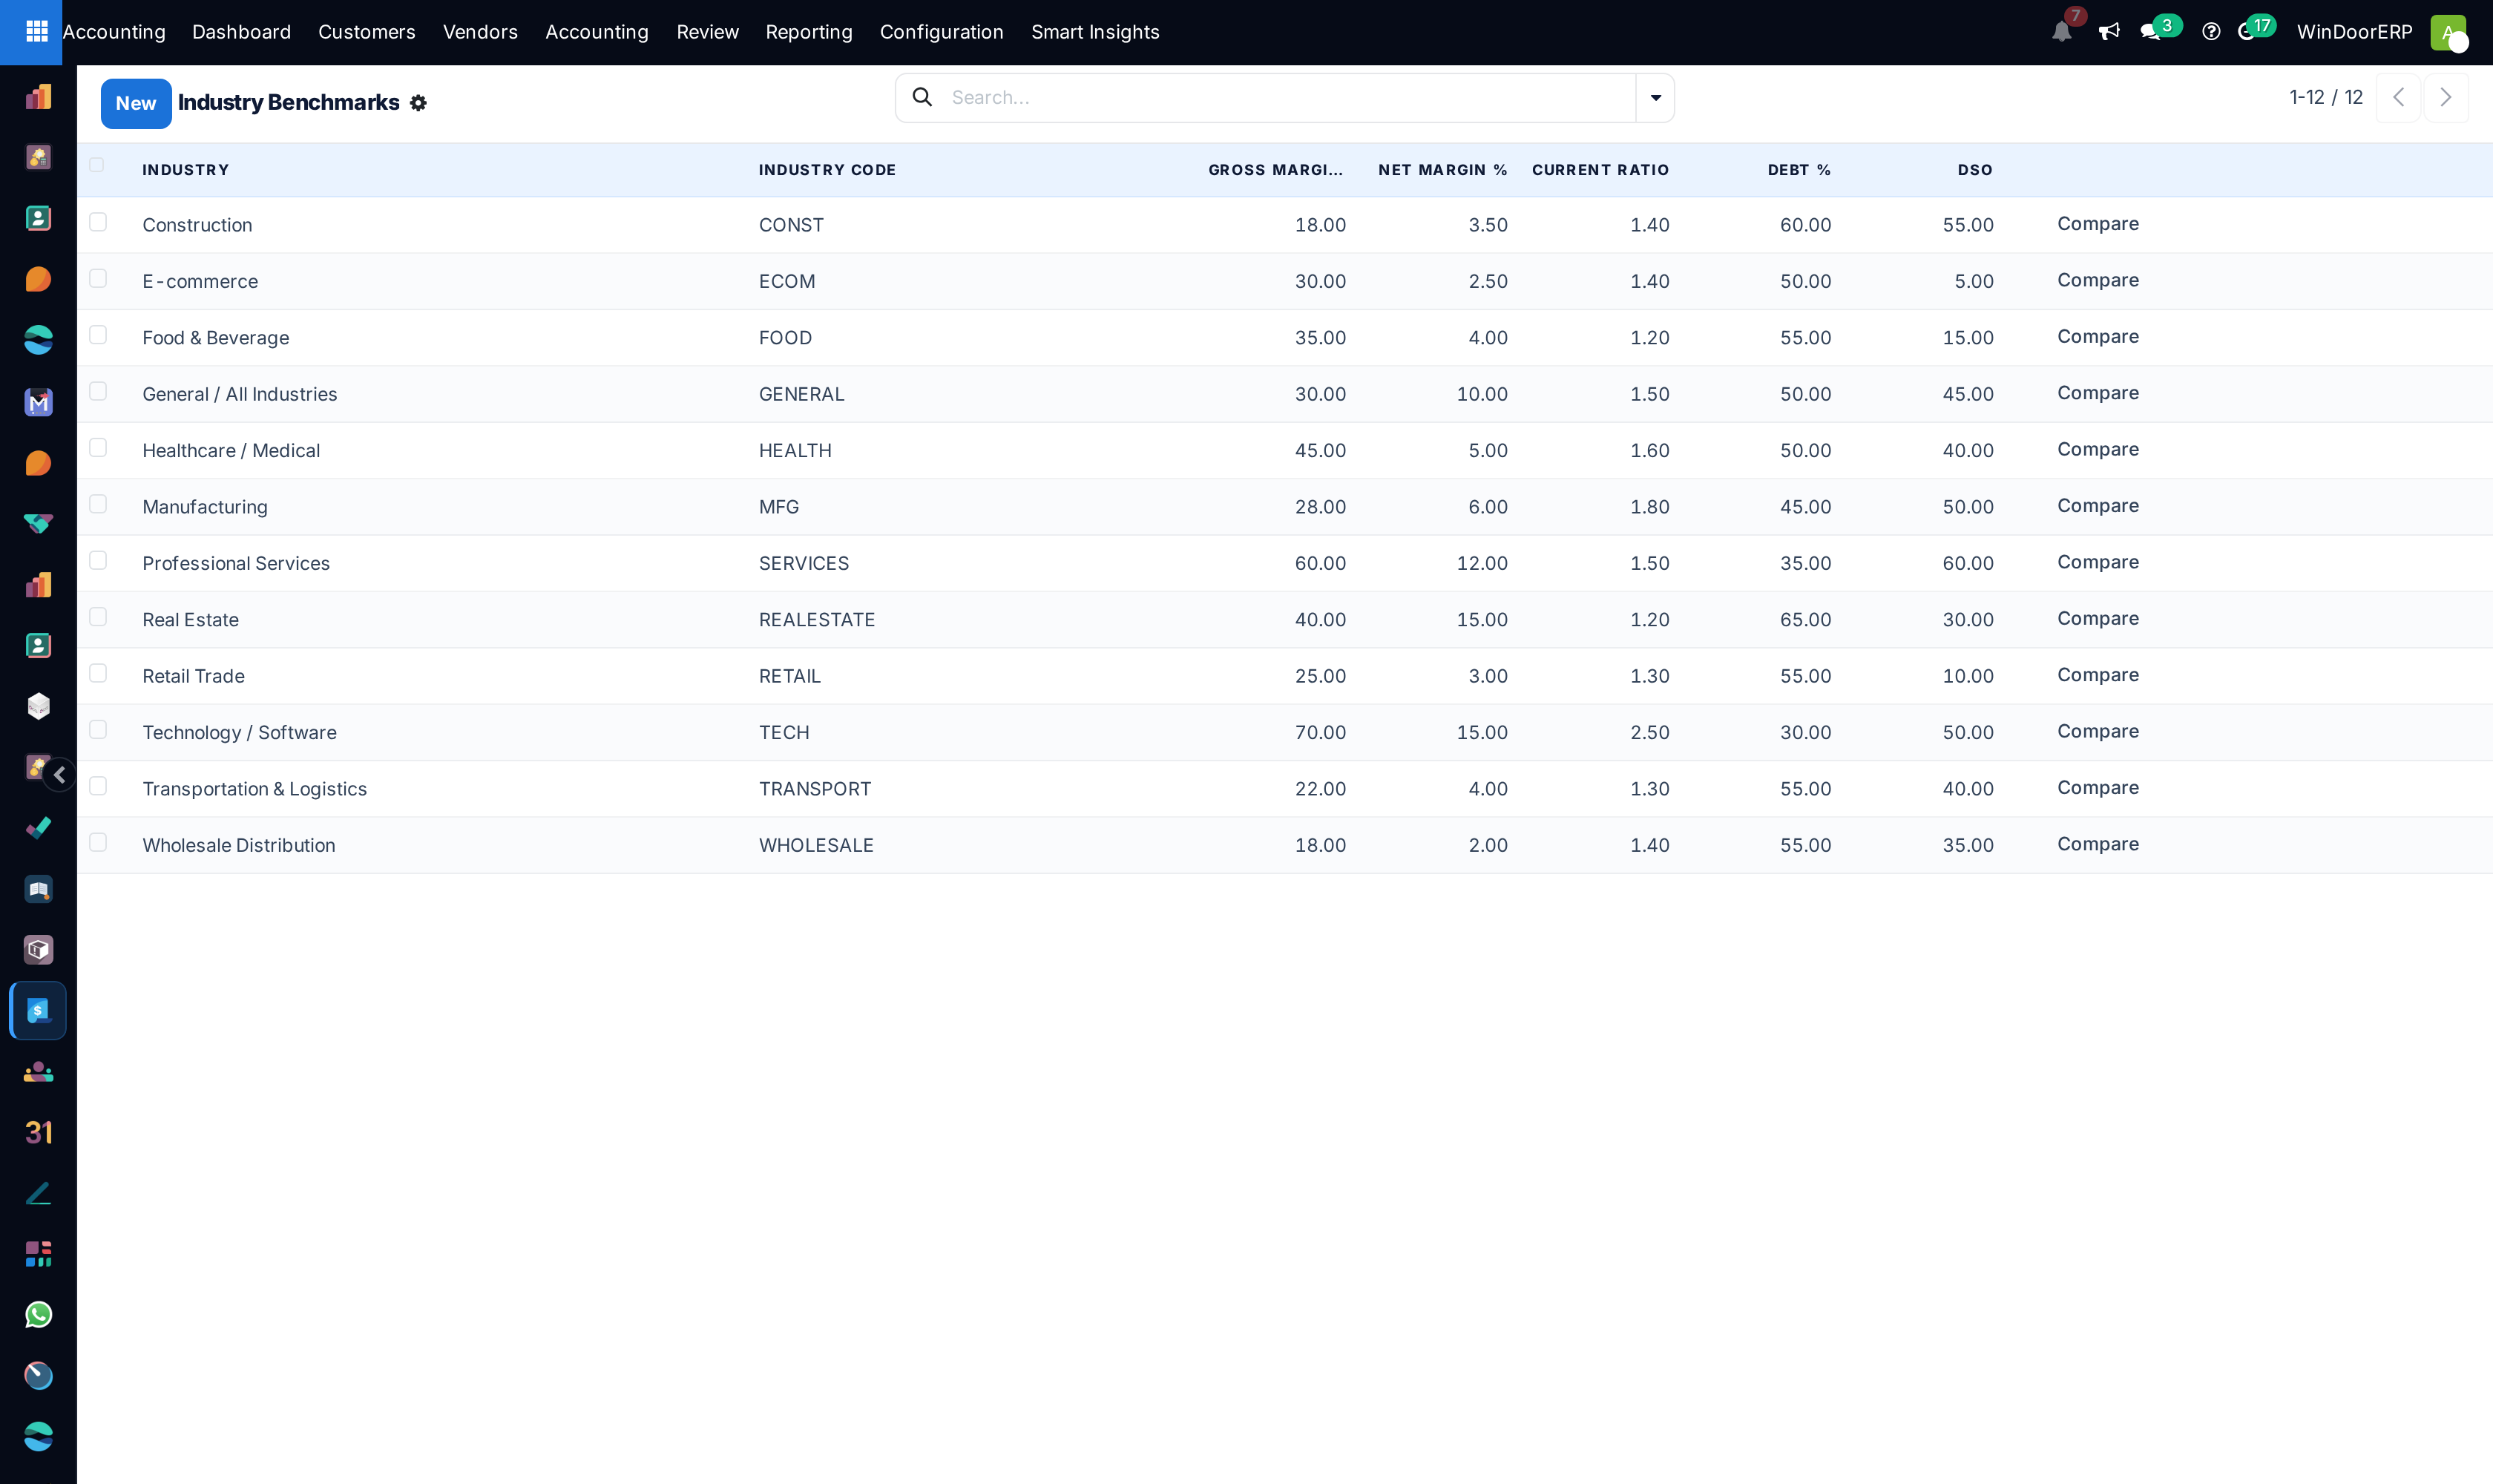
Benchmark Standards ships twelve generic industry ratio tables (General, Manufacturing, Construction, Retail, Services, and so on) covering margins, liquidity, leverage, DSO/DPO, and turnover. They are textbook reference values with no source citation, no region, and nothing fenestration-specific — for a Qatar window fabricator, treat Manufacturing or Construction as a rough yardstick, and edit the values (or add your own standard) if you have better figures. Compare computes your company's year-to-date ratios from the ledger and grades each against the benchmark (good within 110%, poor below 90%, reversed for debt and DSO where lower is better), producing an overall score built from five of the ratios plus templated recommendations. Two approximations to keep in mind when reading it: inventory is estimated as 30% of current assets, and extreme values are clamped rather than shown raw. Print PDF and Export Excel work on the comparison form.
Auto-Accruals, Smart Import, Report Builder
Auto-Accruals lists suggested month-end expense accruals: where an account-and-supplier pair has averaged a monthly cost over the last six months and this month is short, the shortfall is suggested with a confidence figure. In this release the register is review-only from the interface — Accept and Reject record your verdict, but no button posts the journal entry, and suggestions themselves are generated from the shell, not on a schedule. Book the accrual as a manual journal entry and use the suggestion as your working paper.
Smart Import loads a CSV or XLSX file into journal entries, journal items, partners, or the chart of accounts — those four models only. It guesses the column mapping from the headers (keyword matching, which you review and correct), parses dates in several formats, strips currency symbols, and resolves links by id, name, or code. The preview shows the first 20 rows; the import then runs row by row, skipping failures into an error log rather than stopping. Imported journal entries land as drafts — nothing is posted for you. Note the preview's error counters always read zero (validation happens only at import time), the Skip Duplicates and Update Existing switches are not implemented in this release, and a saved Import Template only pre-selects the import type — the column mapping is re-guessed each time.
Report Builder defines custom row-and-column financial statements: rows are titles, accounts, account groups, safe-evaluated formulas over other rows, subtotals and totals; columns can show balance, debit, credit, or quantity (the other column types in the list — budget, variance, comparison, YTD — compute nothing in this release and return zero). Every edit auto-saves a version you can restore. Export the result with Export PDF; the on-screen Generate Report preview and the Export Excel button are non-functional in this release, and Report Templates is the same list filtered to records marked as templates — picking a template does not copy its rows onto a new report.
Troubleshooting
"Detection complete. Analyzed N transactions. No new anomalies found." — a normal result: no line last month deviated more than three standard deviations from its account's average, or the accounts had fewer than five lines each.
"Not enough data found for the selected period. Need at least 3 months of data." — widen the trend-analysis date range; the wizard needs three distinct months of posted entries.
Duplicate, Missing Entry, Trend Alert, KPI, or Year-over-Year lists are empty — their generators are not wired to any button or schedule in this release; ask your administrator to run them, or rely on Anomaly Detection and Generate Analysis, which are.
Generate Report shows nothing / "Excel export will be generated." — both are known gaps in the Report Builder this release; use Export PDF.
"openpyxl is not installed. Please install with: pip install openpyxl" — the server lacks the XLSX library; import the file as CSV or ask your administrator to install it.
An accepted accrual never hits the ledger — accepting only records the decision; post the journal entry yourself under Accounting › Journal Entries.
Common mistakes
- Presenting these screens as artificial intelligence to an auditor — they are transparent statistical rules, which is a strength: every flag can be explained from the Z-score or rule that produced it.
- Treating a benchmark grade as an industry position — the standards are generic defaults, and inventory is approximated, so use the comparison for direction, not for a board slide.
- Expecting the duplicate detector to catch reworded descriptions — only amount, date, and exact reference are compared, so keep supplier references clean and unique.
- Building a what-if scenario for a material price change without adjusting for the material's real share of COGS.
- Importing a spreadsheet and assuming it posted — imported entries are drafts, and failed rows are only visible in the import's error log.
- Dismissing anomalies in bulk to clear the list — a dismissed record cannot be re-opened.
Was this article helpful?
Thanks — your feedback helps.
Running a window or door factory?
Ask for a demo