Report on installation progress and hours
What this does
Four ways to look at installation work once it is under way: an analysis of the openings themselves, a report over the work packages, timesheets for the hours spent, and an installer comparison reached from the dashboard.
Before you start
- These reports read what the site has ticked off. A project whose actions are updated weekly produces a report that is a week behind — the fix is on site, not here.
- Timesheet reporting only appears if you have timesheet access.
Steps
-
01
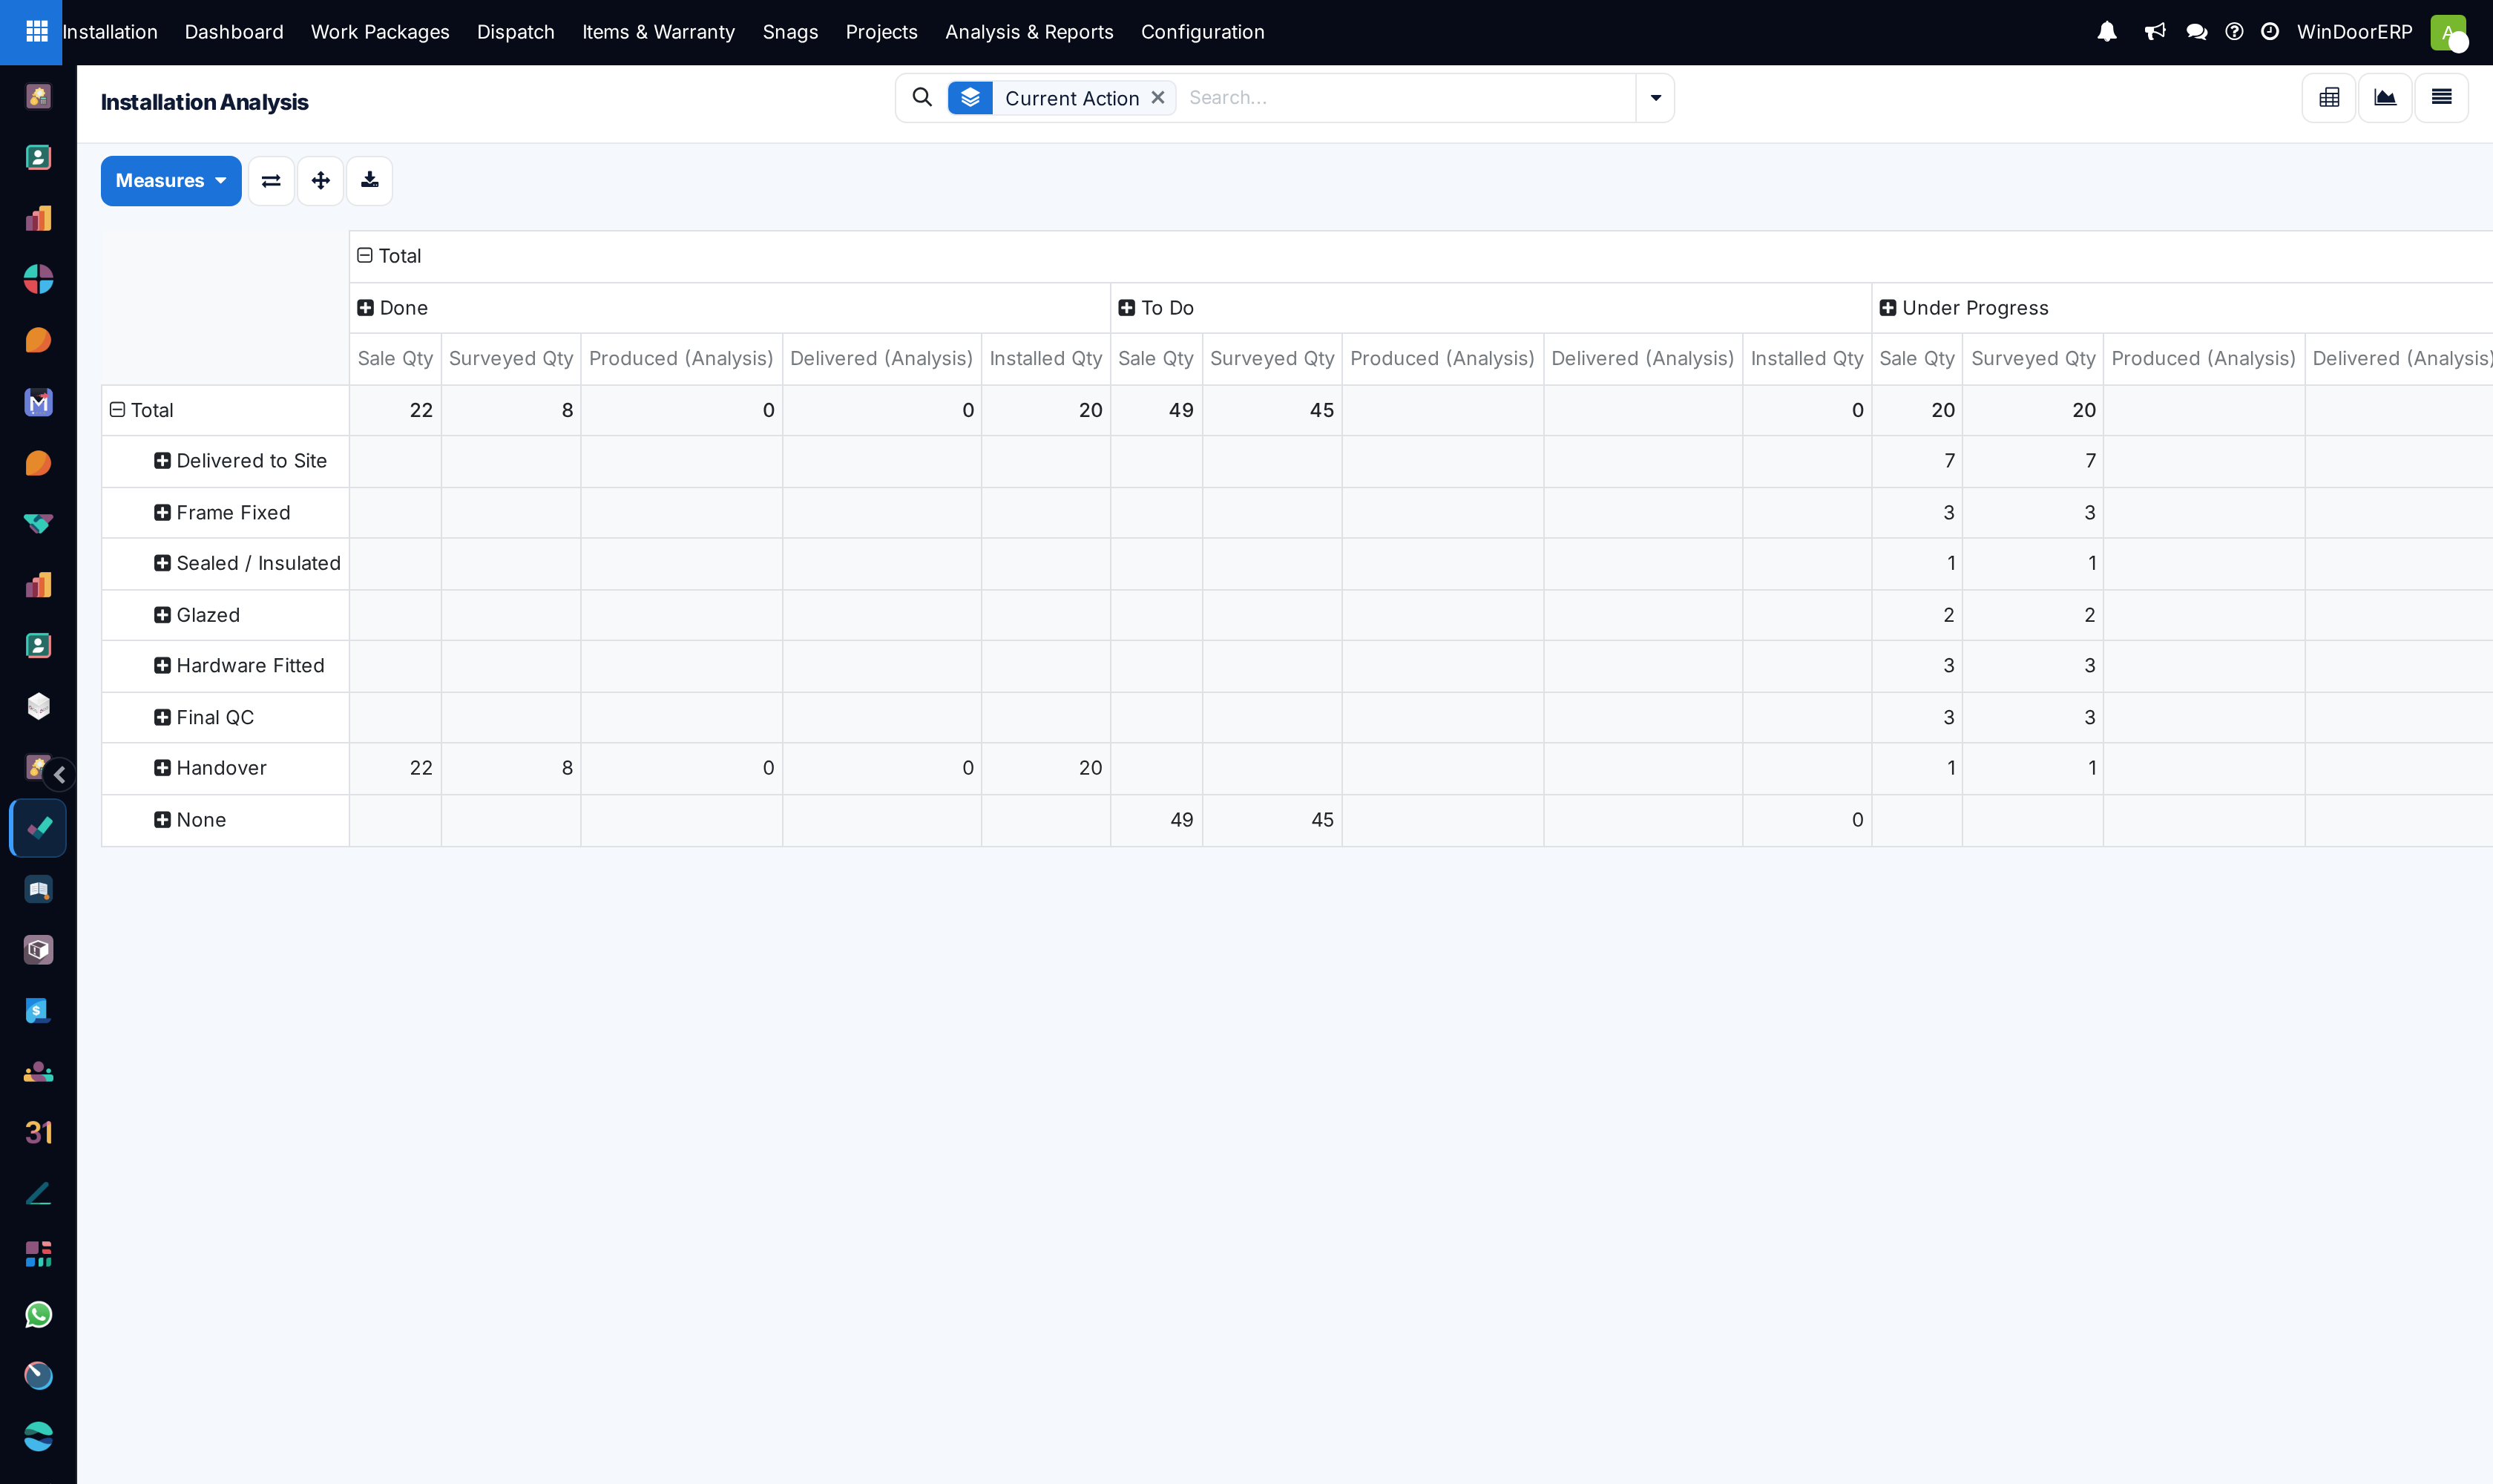
Open Installation › Analysis & Reports › Analysis for the openings view.
-
02
Read it as it opens: Current Action down the side — Delivered to Site, Frame Fixed, Sealed / Insulated, Glazed, Hardware Fitted, Final QC, Handover — against item state (To Do, Under Progress, Done) across the top. That is where the work is stuck.
-
03
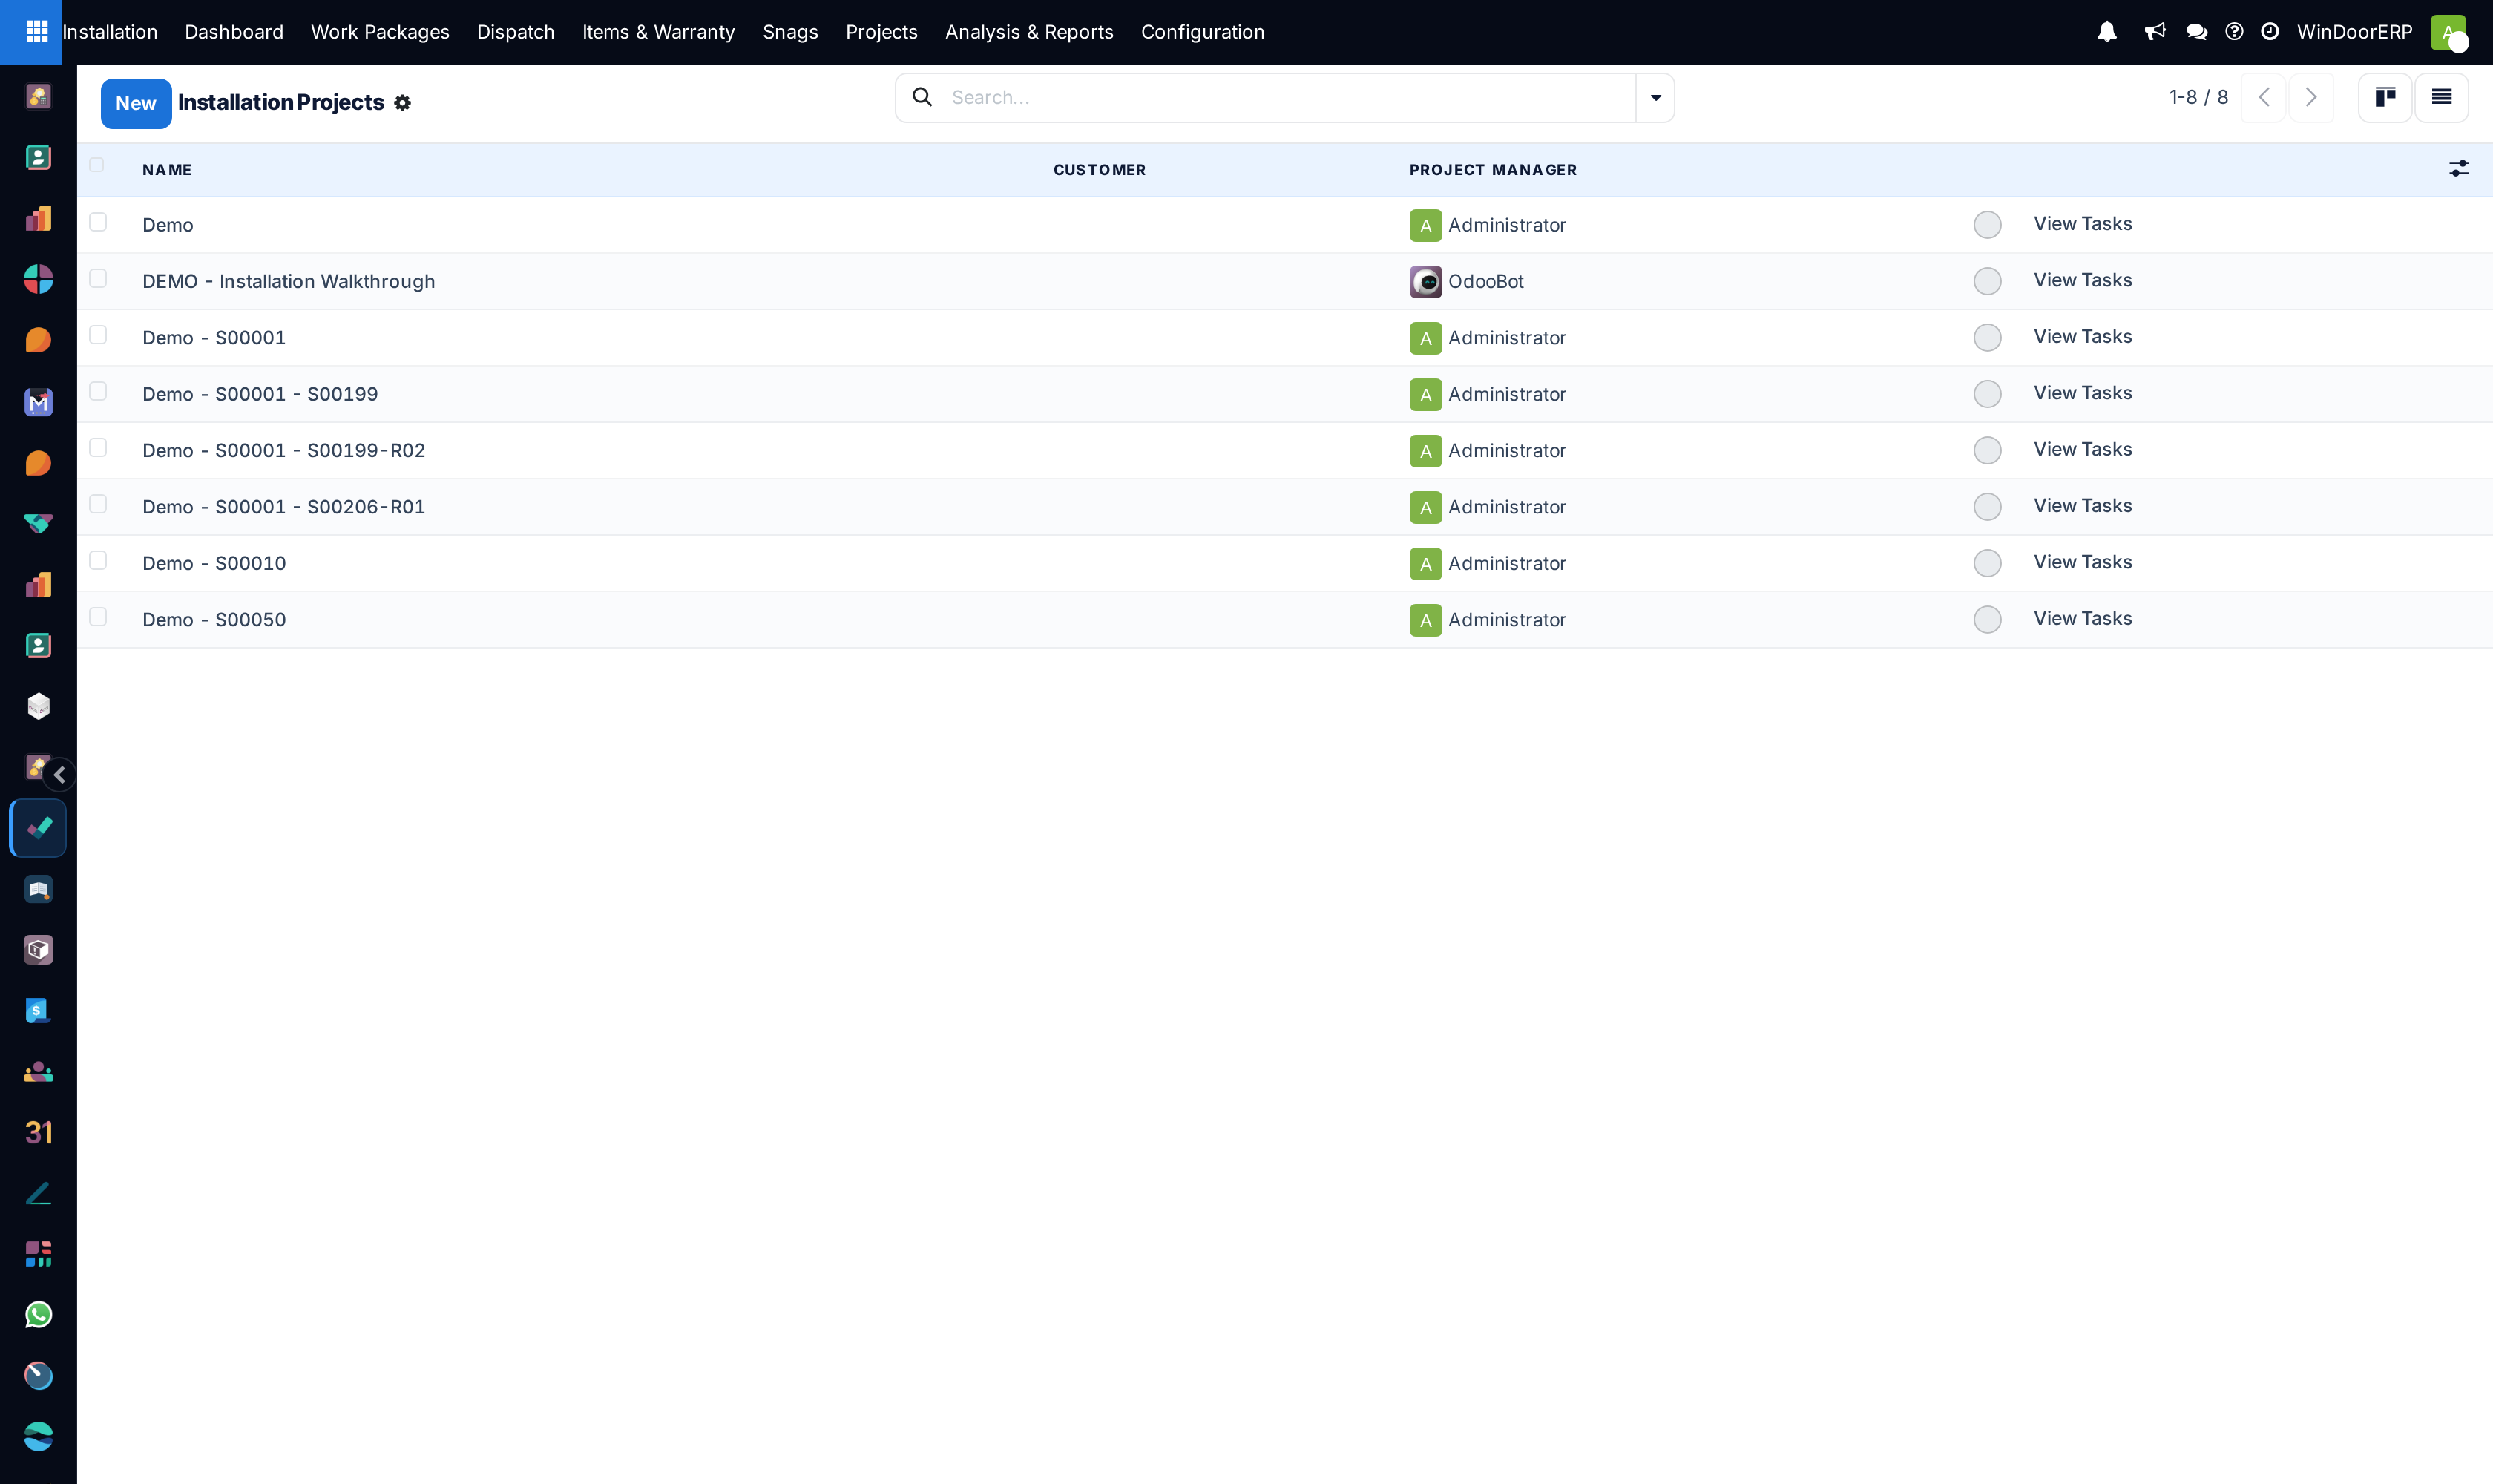
Open Analysis & Reports › Reporting › Tasks for the work-package view, which opens as a graph.
-
04
Open Reporting › Timesheets to see hours booked against installation work.
-
05
For a per-installer comparison, open the Installation Dashboard and use its installer view.
Which report answers which question
| Report | Answers |
|---|---|
| Analysis (installation items) | How many openings are at each stage, per project. The unit is the opening, which is what the customer counts. |
| Reporting › Tasks | The work-package picture — useful for scheduling crews rather than counting units. |
| Reporting › Timesheets | Hours booked against the work. The only place labour time appears. |
| Installer view (from the Dashboard) | Comparison across installers, for balancing crews. |
Important
The Analysis report counts root items only — when an opening has been split into sub-items, the parent is counted and its children are not. That is deliberate: counting both would double every split opening. So an Analysis count is "openings as ordered", which is usually what you want to report to a customer, and not always the same as the number of physical units a crew handled.
Reading progress honestly
Everything here derives from ticked actions on items. That makes the reports as trustworthy as the site's discipline and no more. Two habits keep them honest: tick actions when they happen rather than at the end of the week, and raise snags against items instead of carrying them in your head — an item that looks complete but has an open snag is the difference between a report and reality.
Troubleshooting
| Symptom | Cause and fix |
|---|---|
| Analysis counts fewer units than the crew installed | Split items are counted at their parent. Compare against the order quantity, not the physical count. |
| Timesheets menu is missing | It requires timesheet access. Ask an administrator. |
| A project shows no progress | Its actions have not been ticked. Progress has no other source. |
| The reports disagree with the dashboard | The dashboard scopes to the viewer and its own date range; the reports do not. Compare like for like. |
Common mistakes
- Reporting installation progress from the projects list's progress bars without checking whether snags are open behind them.
- Comparing installers on item counts when the openings differ wildly in size and difficulty.
- Treating a stale report as a site problem when it is a data-entry cadence problem.
Was this article helpful?
Thanks — your feedback helps.
Running a window or door factory?
Ask for a demo