Analyse win/loss and pipeline performance in CRM Reporting
What this does
CRM › Reporting › Pipeline opens Pipeline Analysis — graph, pivot and list views over your live opportunities. It is not a separate report table: every row is the opportunity, so drilling into the list or form lands on the real record. Won-versus-lost analysis, revenue by stage, and the time-to-assign / time-to-close measures all live here.
The screen opens pre-filtered to Opportunities and — this is the part everyone trips over — without lost deals. Losing an opportunity archives it, and archived records stay out of every view until a filter brings them back. Win/loss analysis therefore always starts by adding the Won and Lost filters.
Before you start
- Any CRM salesperson role — the Reporting menu is visible to Own Documents users and up.
- Honest pipeline data: Expected Revenue filled on deals, and losses recorded with Lost Reasons — grouping by a reason nobody fills answers nothing.
Steps
-
01
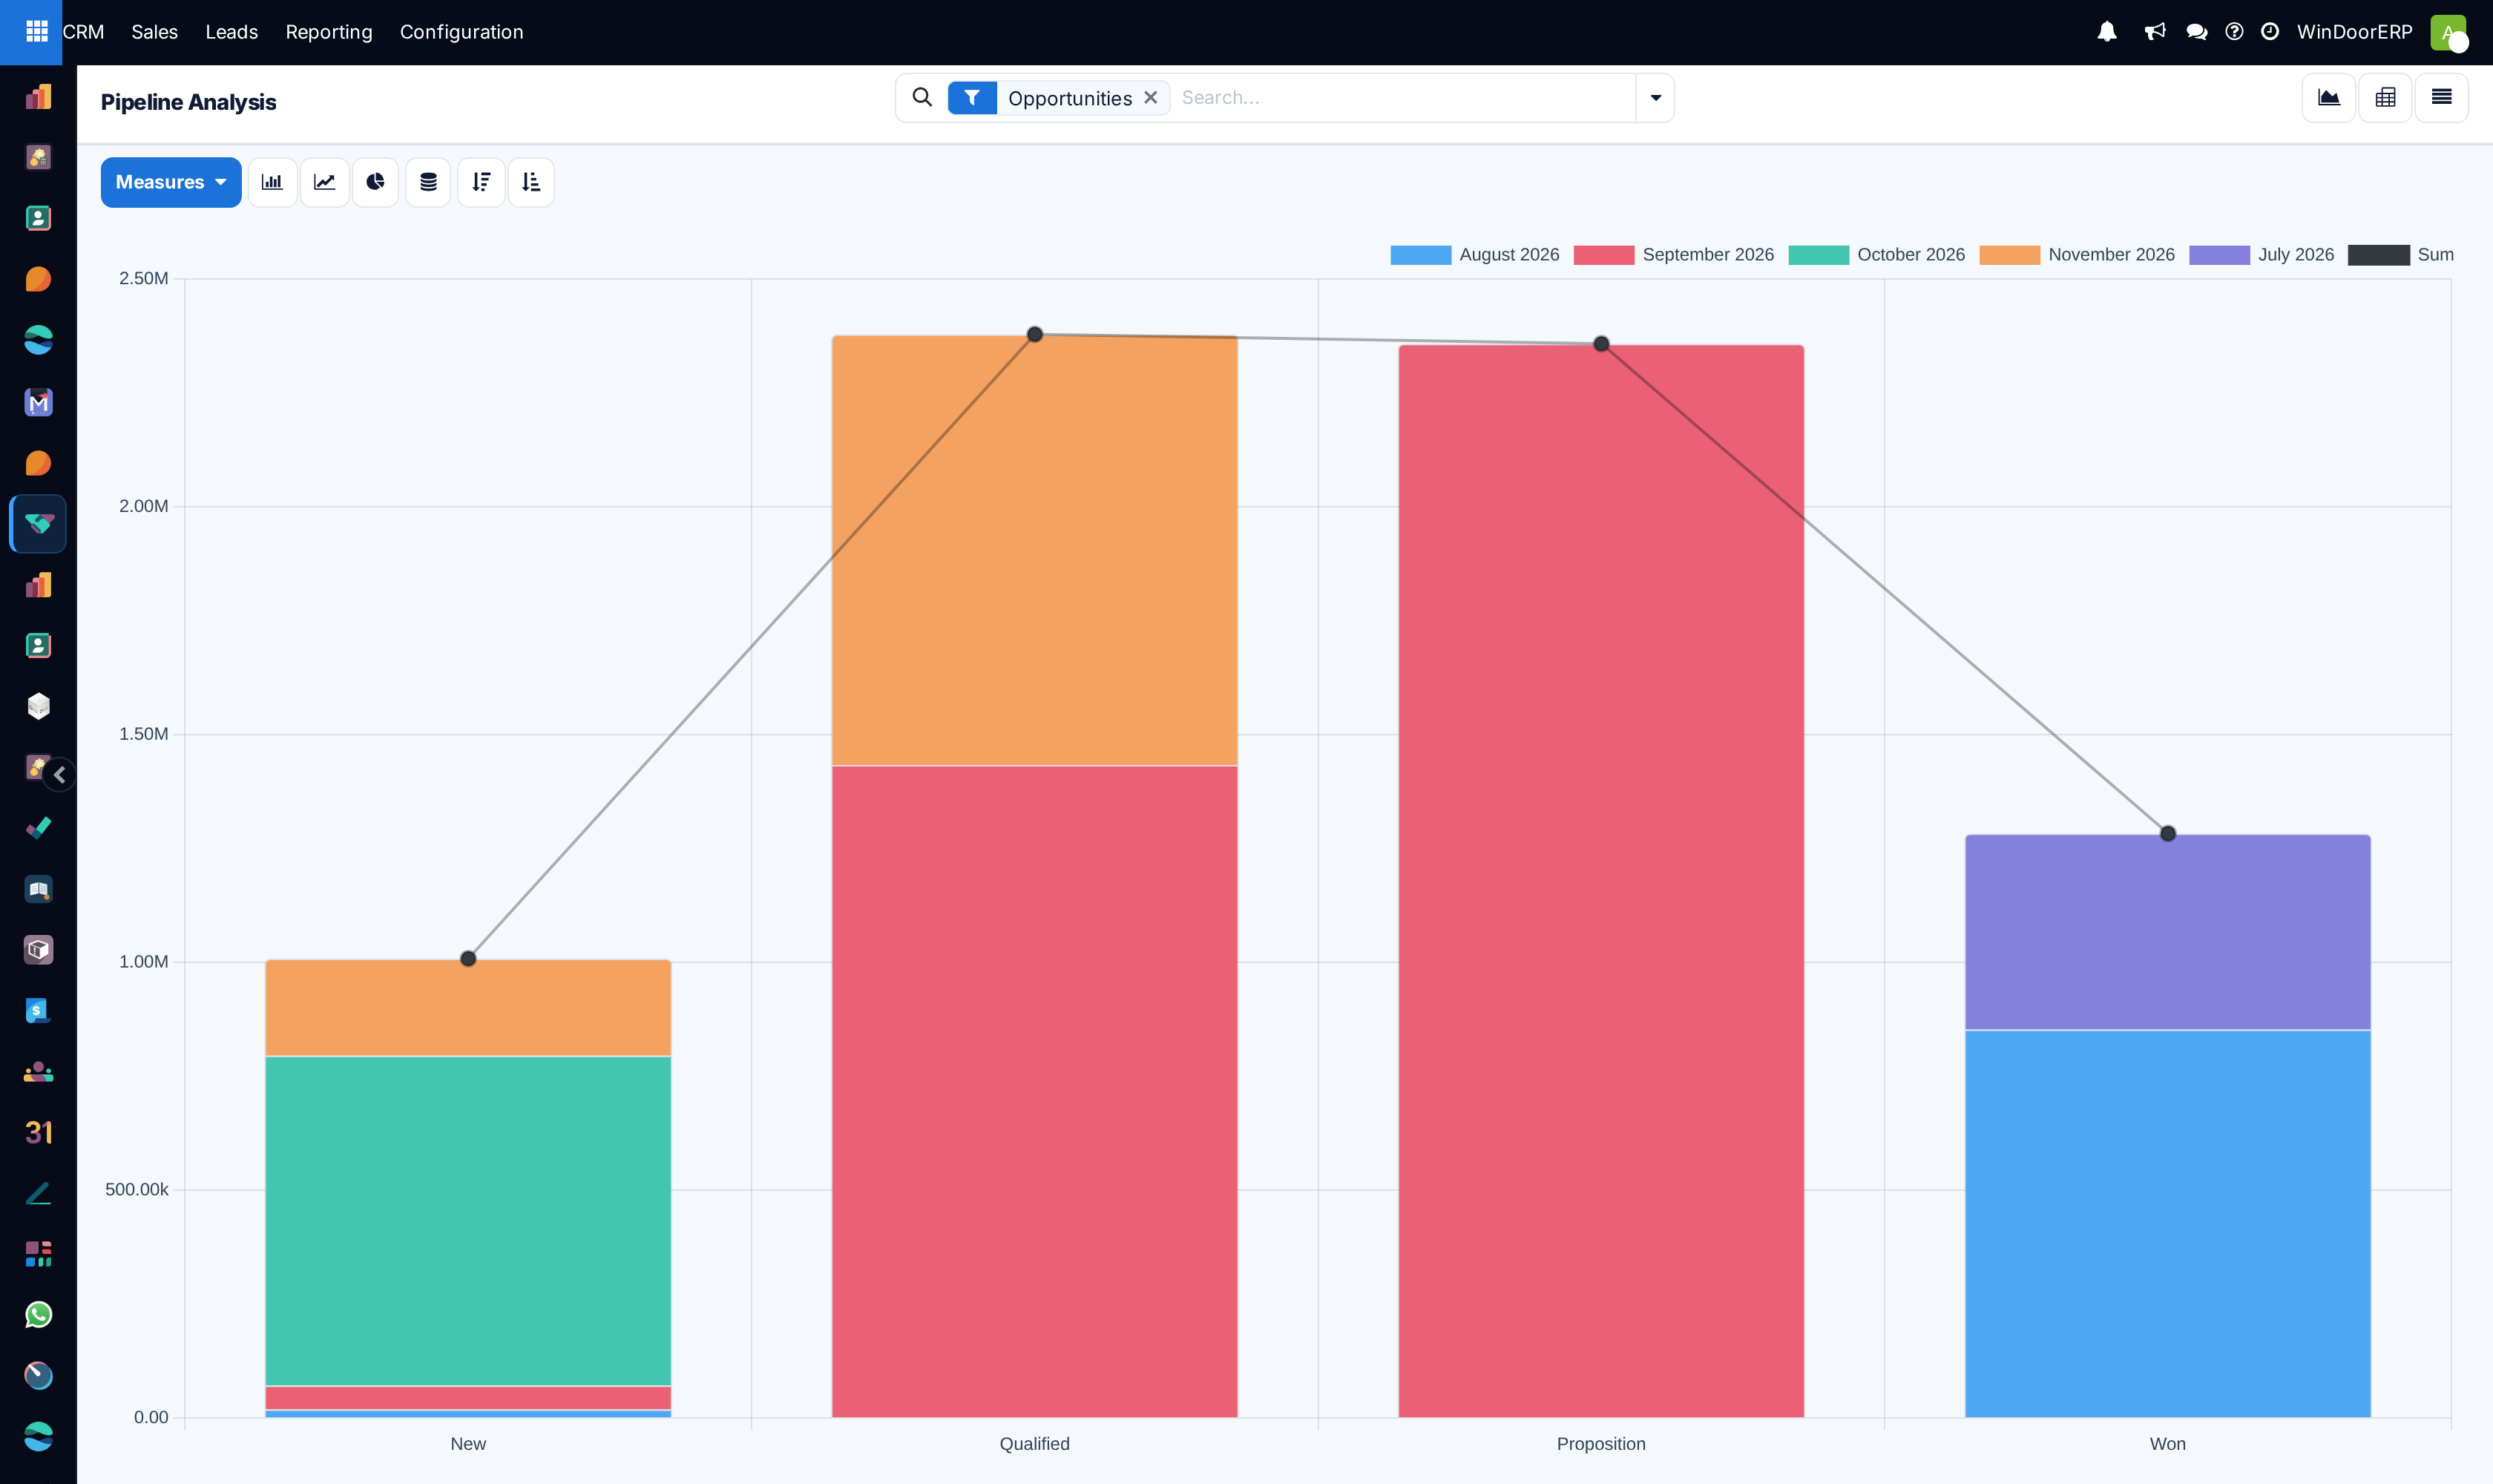
Open CRM › Reporting › Pipeline. The bar chart opens first: Prorated Revenue per Stage, split by Expected Closing month.
-
02
Pick your measure from Measures — Expected Revenue for face value, Prorated Revenue (expected × probability) for the weighted figure, or Count.
-
03
For win/loss: apply Won and Lost together (they combine), then group by Stage, Salesperson or Lost Reason. The Lost filter is also what pulls archived losses into the data.
-
04
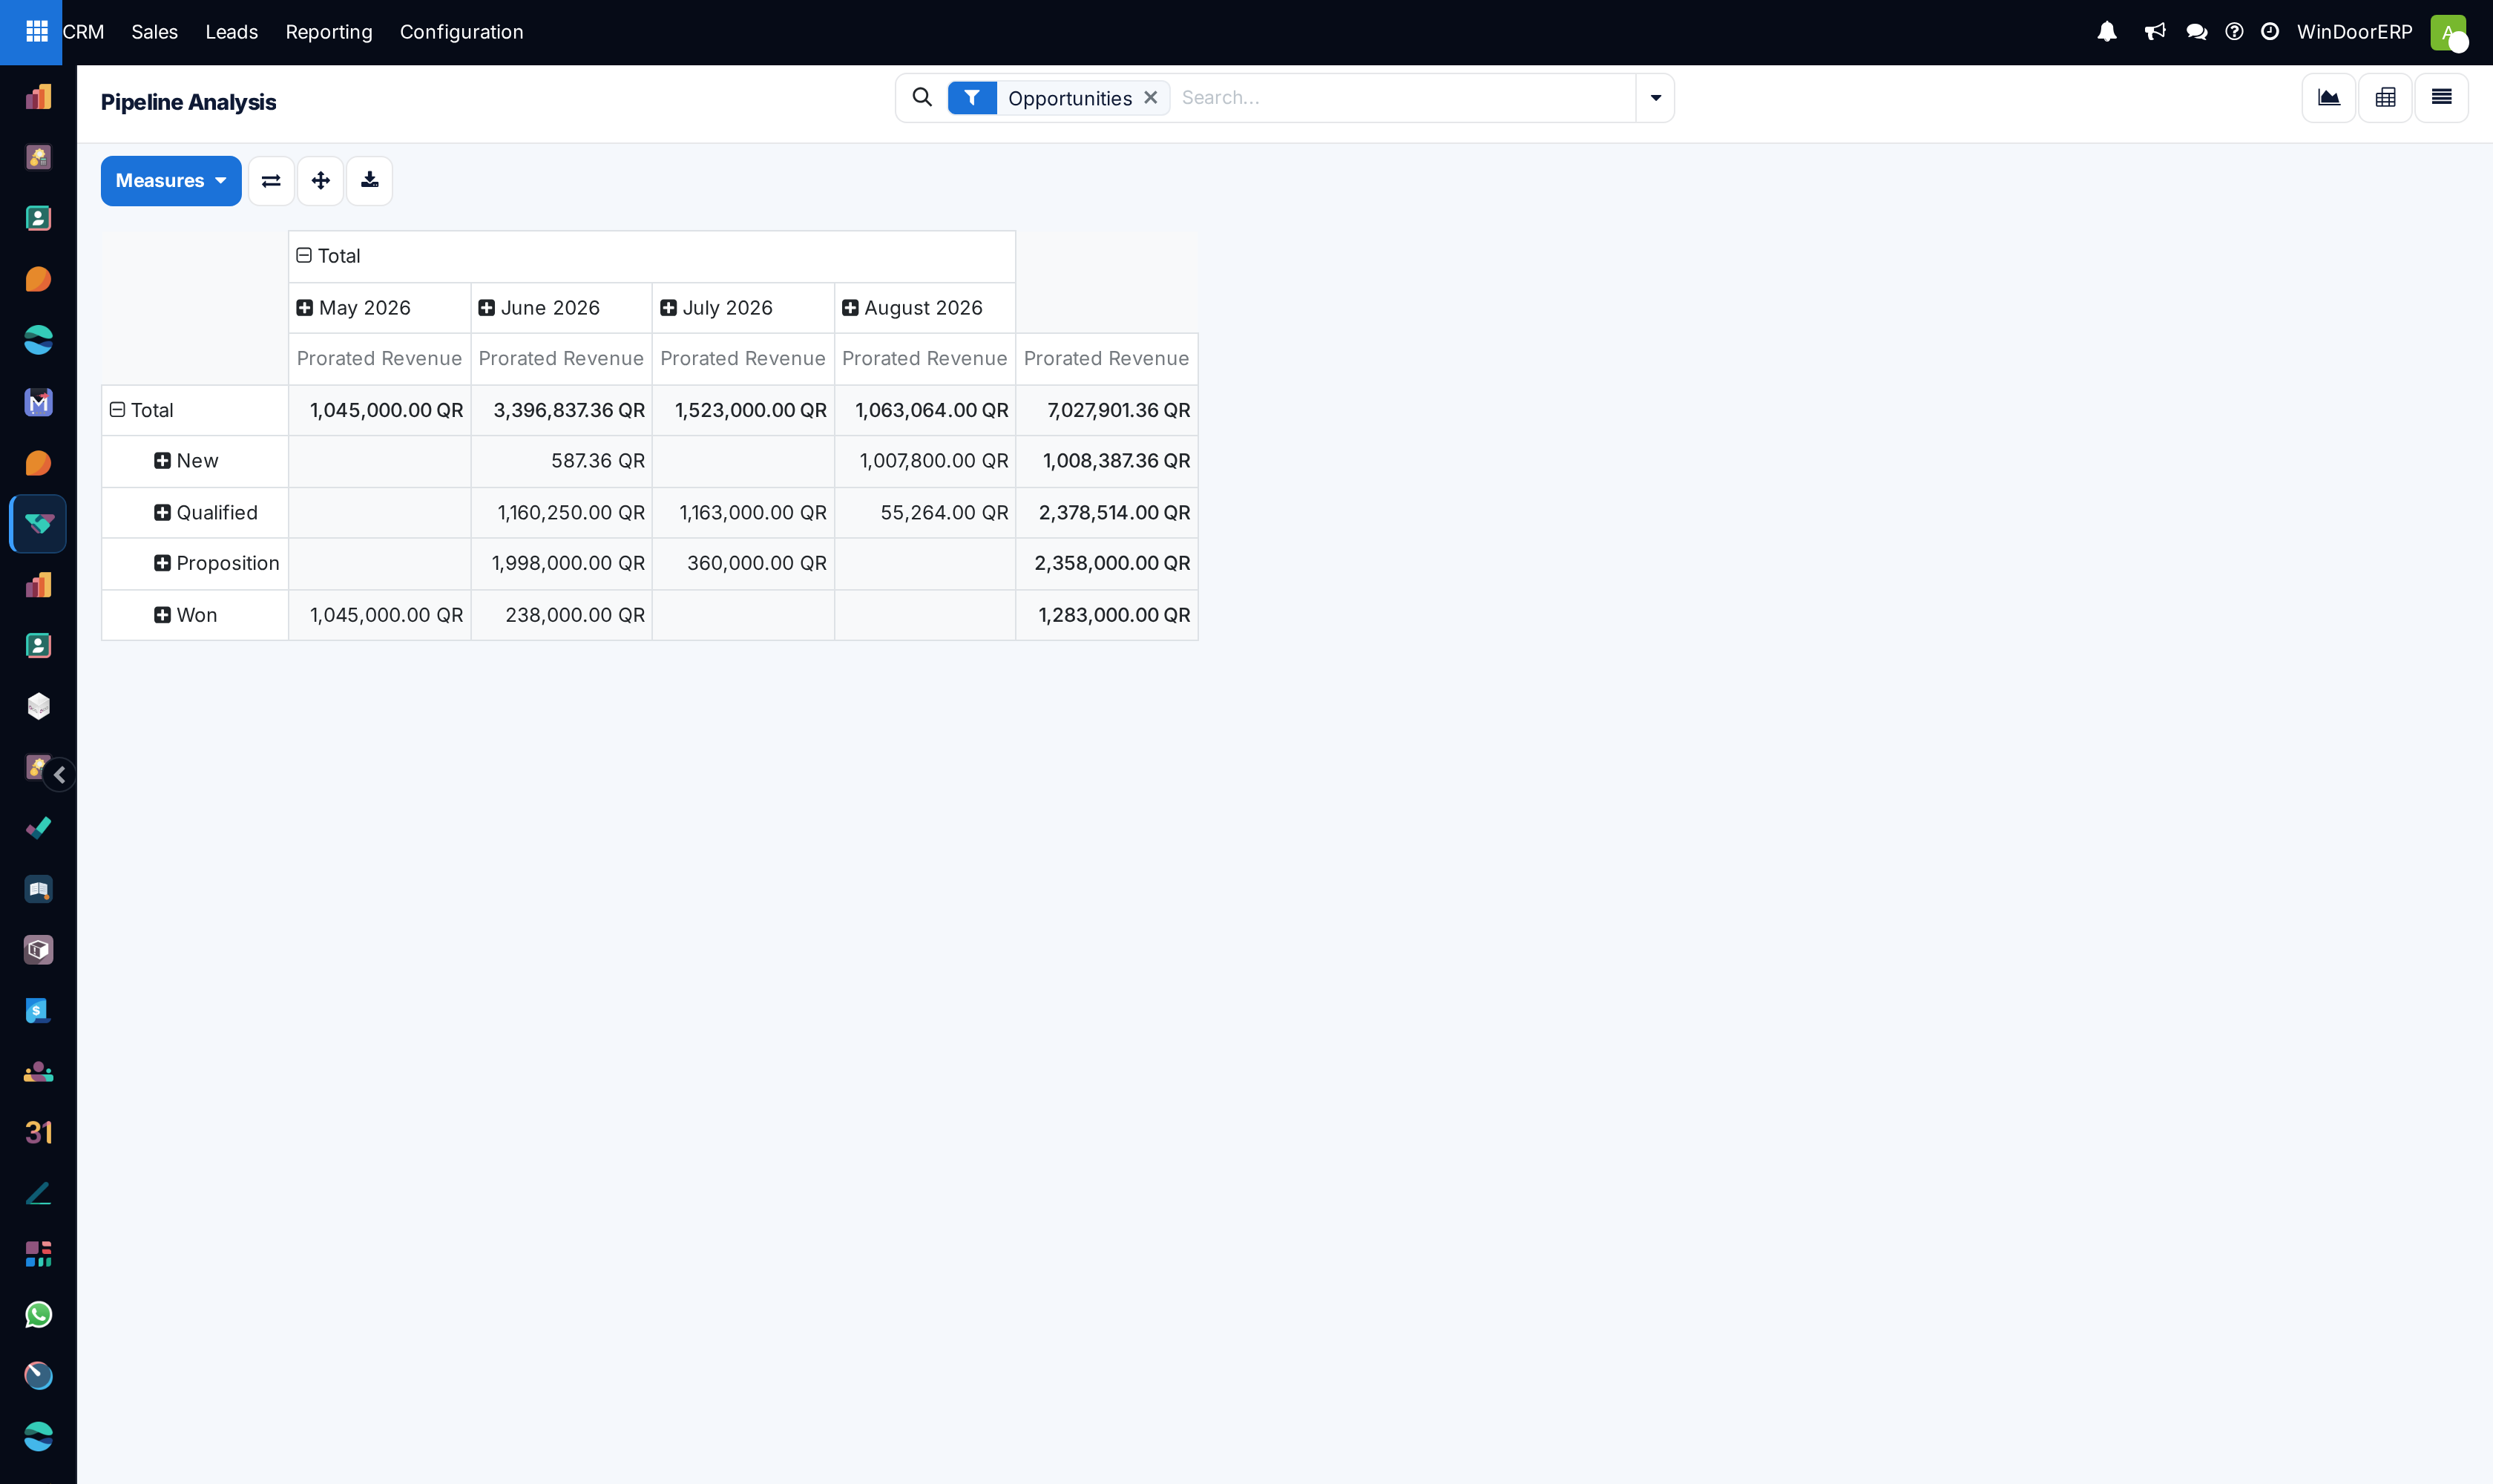
Switch to Pivot for the cross-table — by default Stage rows against Creation Date months. Note the two views slice time differently: the graph uses the expected closing date, the pivot the creation date.
-
05
Use Days to Assign and Days to Close to find process bottlenecks — but read them grouped with care (below).
-
06
Click any bar or cell to drill into the underlying opportunities.
The measures
| Measure | What it is |
|---|---|
| Expected Revenue | The amount typed on the deal. |
| Prorated Revenue | Expected revenue × probability — the weighted pipeline value, and the default measure. |
| Days to Assign | Calendar days from creation to the most recent salesperson assignment — reassigning a lead resets the clock. |
| Days to Close | Calendar days from creation to closing — won or lost both stamp the closing date. |
| Count | Number of opportunities. |
| Geo Latitude / Geo Longitude | Map coordinates that leak into the list from the geolocation feature — summed coordinates mean nothing; ignore them as measures. |
Important
The day measures add up, they do not average. A grouped cell showing Days to Close: 340 over 10 deals is a total of 340 days, not a 34-day average — divide by the Count column yourself. (Project's task report averages its equivalents; the two apps' "days" are not comparable.) Note also that both are calendar days, not working days.
Filters and groupings
The dedicated search view offers: My Pipeline, Opportunities / Leads, Active, Inactive, Won, Lost, Archived, and date ranges on Creation Date (defaulting to this year when picked), Expected Closing and Date Closed. Group by salesperson, sales team, city, country, stage, campaign, medium, source, the four dates (creation, conversion, expected closing, closed), or Lost Reason.
The sibling reports
| Menu | What it shows |
|---|---|
| Reporting › Leads | The same analysis over leads and opportunities together, counting records rather than revenue by default — and, unlike Pipeline, it opens with active and inactive records included (lost ones are already in), pre-filtered to this year's creation dates. |
| Reporting › Activities | One row per completed activity on a lead (calls logged, meetings done…), over the trailing 12 months by default. Count-based — it measures effort, not revenue. |
| Reporting › Forecast | The first Reporting entry: the forecast kanban grouped by expected closing month — covered in the pipeline article. |
Troubleshooting
| Lost deals are missing from the numbers | Losing archives the record, and archived records are excluded by default. Add the Lost, Inactive or Archived filter. |
|---|---|
| Grouped "days" figures look absurdly large | They are totals, not averages — divide by Count. |
| The graph and pivot disagree on the same month | They slice different dates: the graph by expected closing, the pivot by creation. Re-group either on the other date to compare. |
| No "win/loss ratio" number appears anywhere | There is no dedicated ratio view — apply Won + Lost, group by stage or salesperson, and read the counts side by side (or export the pivot). |
| An "Expected MRR" measure some documentation mentions is absent | Recurring-revenue measures exist only when the Recurring Revenues feature is enabled; it is off on this installation. |
| The chart shows greyed-out data nobody entered | Sample placeholder — the current filters matched nothing. Loosen the filters; it vanishes with the first real match. |
Common mistakes
- Reading the default screen as the whole story — it is open opportunities only; wins and losses need their filters.
- Comparing prorated revenue across salespeople whose probability habits differ — prorated numbers inherit every optimistic probability.
- Summing Geo Latitude because it was in the dropdown.
- Grouping by Lost Reason before the team actually records reasons at loss time.
- Analysing pipeline velocity without excluding test records — internal trials sit in the same table as real deals.
Was this article helpful?
Thanks — your feedback helps.
Running a window or door factory?
Ask for a demo