Monitor the factory from the Overview dashboards
What this does
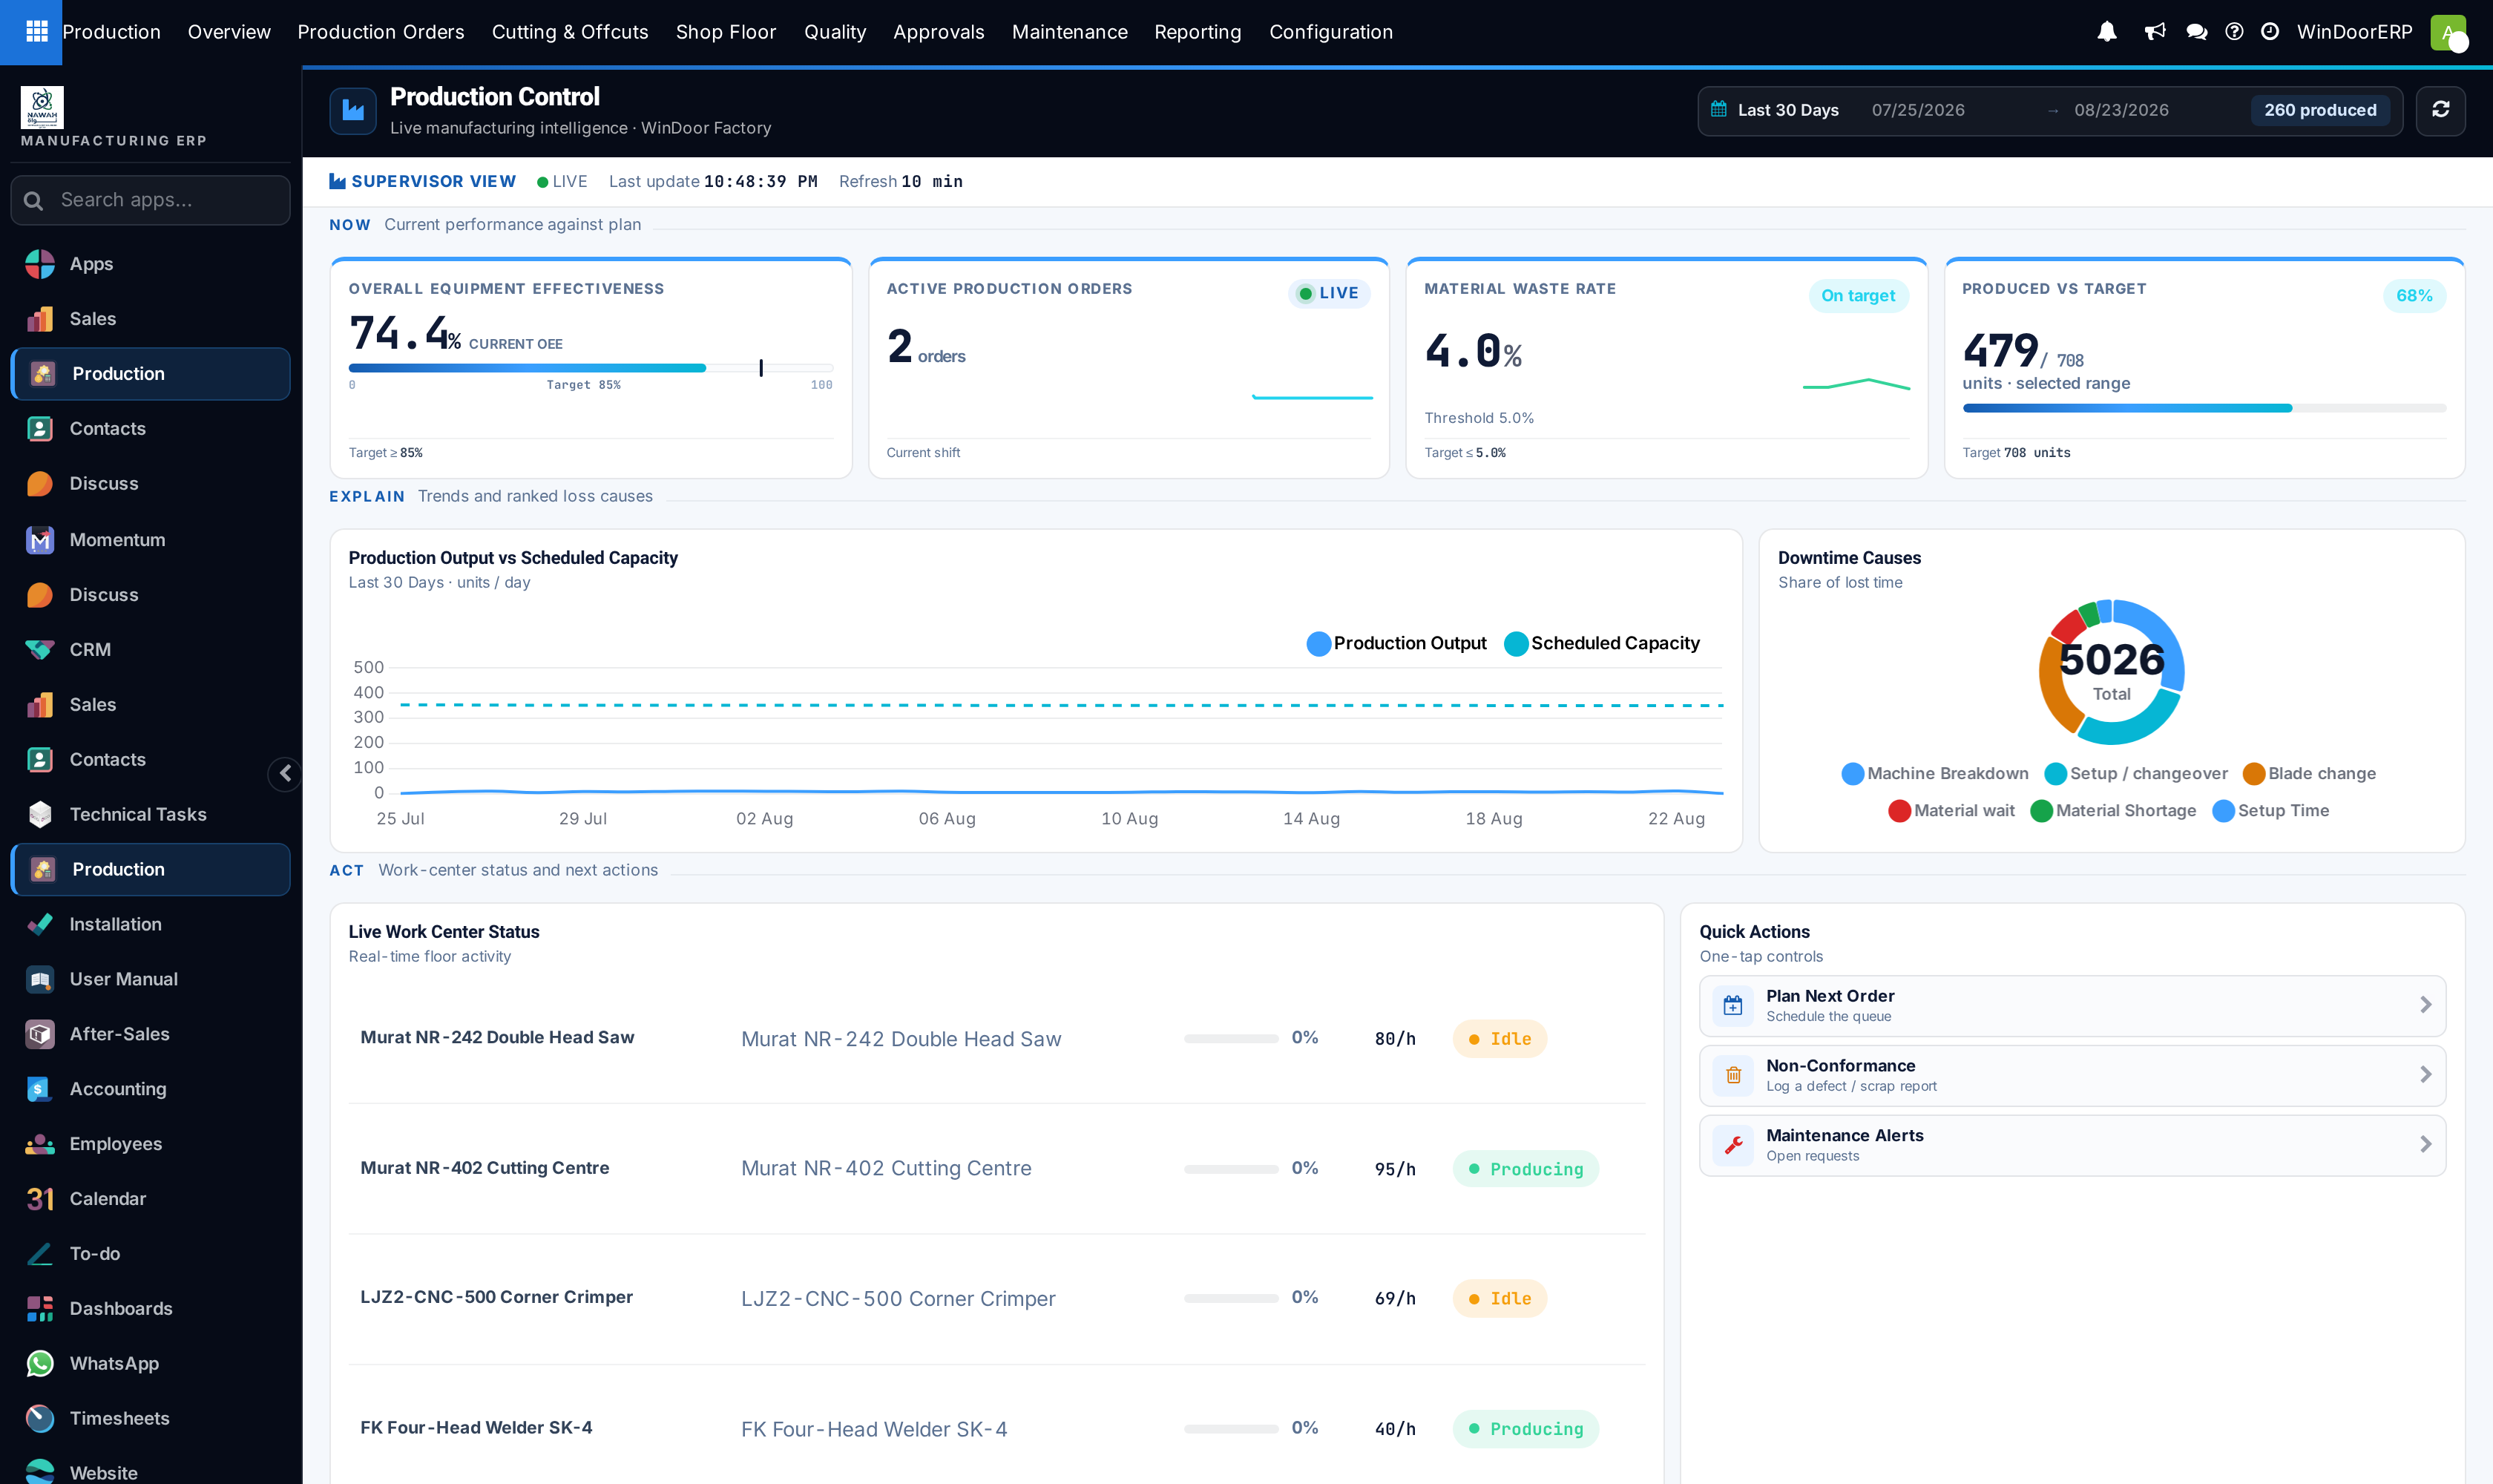
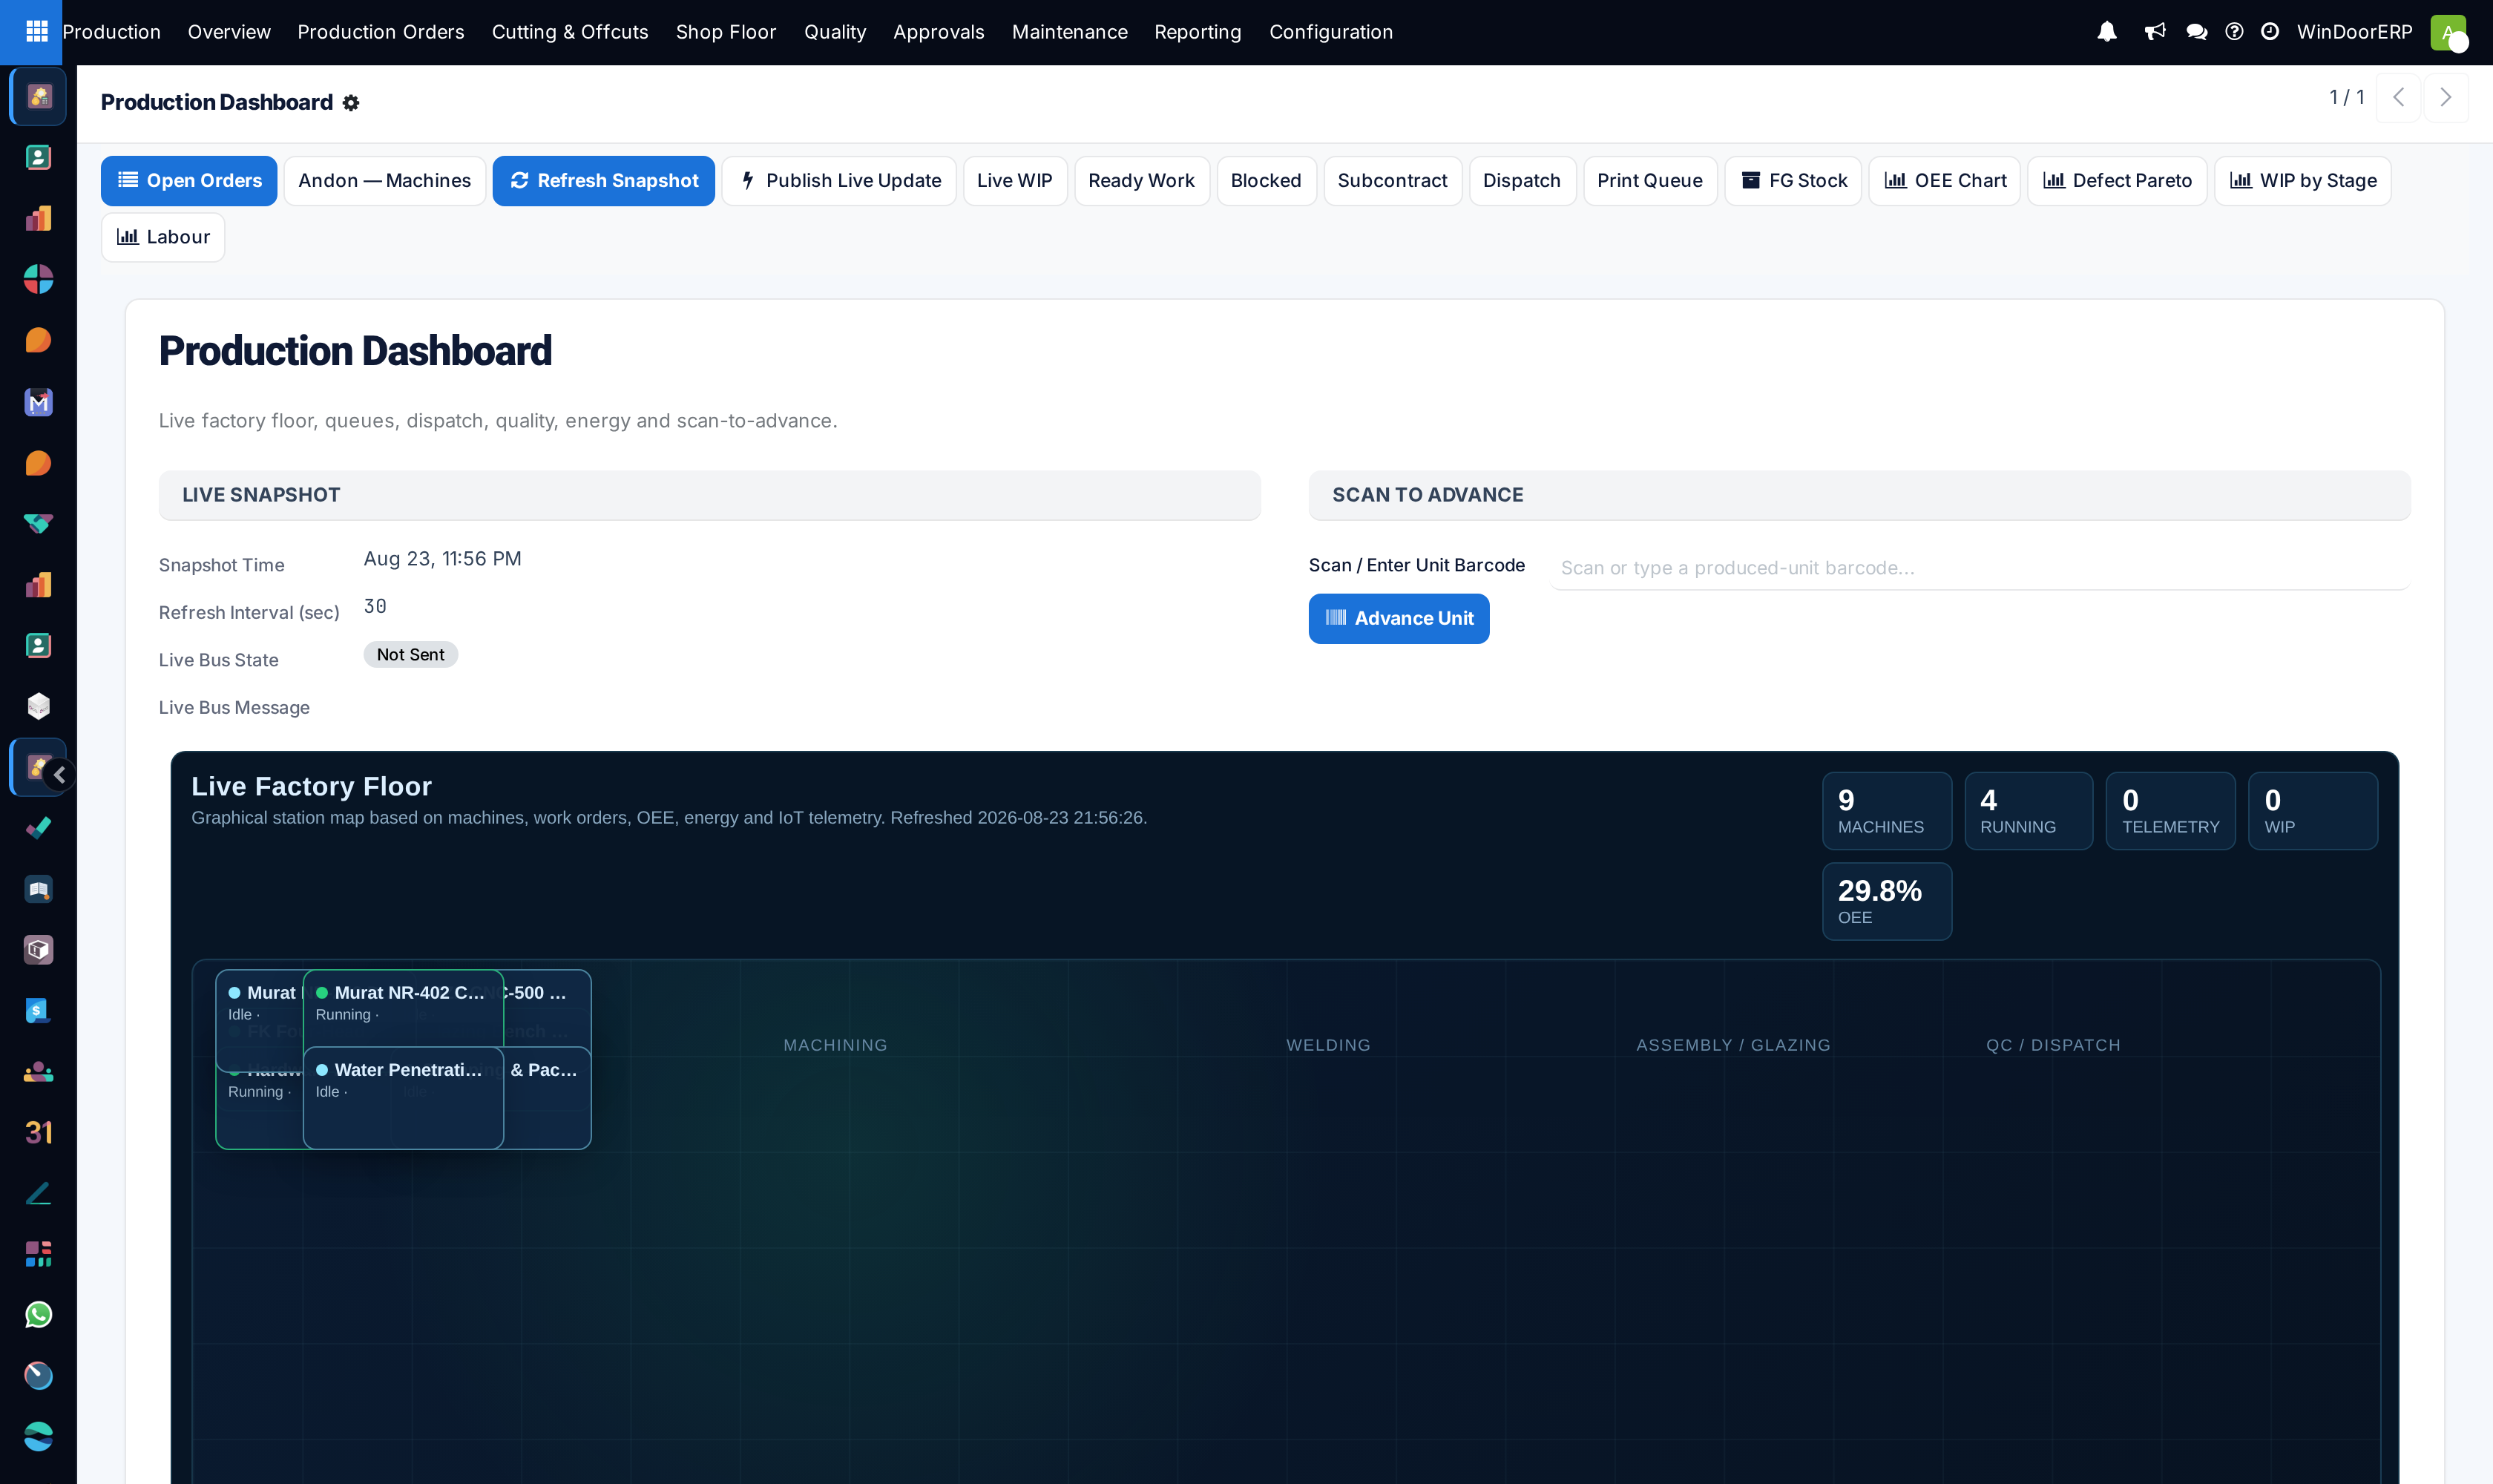
The Production › Overview menu holds the factory's two live views. Production Control is the analyst's screen: OEE, active orders, waste rate and produced-versus-target, with a downtime breakdown and the live state of each machine — refreshed when you press its refresh button or change the range. Dashboard is the self-updating wall view: a form that reloads itself every 30 seconds (and on every published floor update), carrying the graphical factory floor, its KPI panels, a scan box, and one-click drill-downs into everything currently moving — WIP, blocked work, subcontracting, dispatch, the print queue and finished-goods stock.
Everything both screens show is computed from the same records the rest of the app edits — work orders, labour logs, produced units, machines — so they are only as live as the floor's discipline in recording work.
Before you start
- Any production-user role — both screens are open to the whole production team.
- Machines registered with capacities, and labour logs actually being written: OEE, waste and downtime all read from labour logs, and machine states come from work orders starting and finishing (or the terminal).
Steps
-
01
Open Production › Overview › Production Control. The header badge tells you what you are looking at (LIVE, OFFLINE, LOADING); refresh with its ⟳ button when you want fresh numbers.
-
02
Pick the activity range — presets from Today to All Time; the default is the last 30 days. The produced count, waste sparkline and output chart follow the range.
-
03
Read the four KPI cards: Overall Equipment Effectiveness, Active Production Orders (a snapshot of orders in planning/ready/under-production — not range-scoped), Material Waste Rate against its threshold, and Produced vs Target — produced units against the total ordered quantity across open and done orders (the range-scoped produced count is the small chip beside the date range).
-
04
Read the charts row: Production Output vs Scheduled Capacity per day, and the Downtime Causes doughnut — the top loss reasons by logged minutes.
-
05
Act from the bottom row: the Live Work Center Status list shows each machine's state and rate, and the quick actions jump to planning, non-conformances and maintenance.
-
06
For the drill-down view, open Overview › Dashboard: it reloads itself on its refresh interval; scan a unit barcode in Scan to Advance (a successful scan also publishes a floor update to the live bus), and use the header buttons to open the exact records behind each number.
How the numbers are computed
| Figure | Where it comes from |
|---|---|
| OEE | The average over work orders that have an OEE figure. With none yet, a proxy is shown instead: running machines ÷ all machines. |
| Material Waste Rate | Scrap ÷ (good + scrap) from labour logs in the range. The threshold that turns the card red is a system parameter (default 5%). |
| Produced vs Target | Produced units against the total ordered quantity, summed across all non-cancelled production orders — an all-time completion gauge, not a range figure. |
| Downtime Causes | Labour-log minutes per loss reason, top six — every loss type, not only availability. |
| Work-center list | The first eight machines with their live state (Producing / Idle / Breakdown), per-machine OEE and rate. |
The Dashboard snapshot
The Dashboard recomputes on every load — and it loads itself: an interval (30 seconds by default, an administrator can change the parameter) plus every published floor update trigger a reload, with Refresh Snapshot there for an immediate one. Beyond the floor map it carries KPI panels Production Control does not have — machines and Andon counts with telemetry attention, flow and quality (average OEE, open NCRs), dispatch control (packed and loaded packages, pre-dispatch QC pending, open deliveries), finished goods, the print-server queue, and energy meters. It adds:
- The Live Factory Floor — machine tiles positioned as arranged in the Factory Planner, grouped into zones, with a small HUD (machines / running / telemetry / WIP / OEE) and a live-events strip listing down or blocked machines and stuck work orders (or "No blocking events in the current snapshot.").
- Scan to Advance inline — scan a produced-unit barcode to step it one floor stage without leaving the screen.
- Drill-down buttons across the header: Open Orders, Andon — Machines, Live WIP, Ready Work, Blocked, Subcontract, Dispatch, Print Queue, FG Stock, and the chart shortcuts (OEE Chart, Defect Pareto, WIP by Stage, Labour) into the Reporting analyses.
- Publish Live Update — pushes the floor snapshot to the live display bus for wall screens; the badge beside it reports Sent or Unavailable.
Note
A third Overview entry, Factory Planner, appears when the Work Orders feature is on — the visual floor-plan simulator whose saved scenarios are the Factory Layouts covered in the configuration article. The machine positions it saves are exactly what the Dashboard's floor map draws.
Troubleshooting
| Production Control shows LIVE but the widgets are empty or zero | The connection is fine — the records are missing. Check that labour logs and produced units are actually being recorded; on a brand-new database most tiles legitimately read zero. |
|---|---|
| OEE looks implausibly high on a fresh site | With no work-order OEE recorded yet, the card falls back to the running-machines share — a utilisation proxy, not real OEE. |
| Active Production Orders ignores the date range | By design: it is a now-snapshot of open orders, whatever range the charts use. |
| Downtime doughnut is empty although the floor stood still | Downtime only exists where labour logs carry minutes with a loss reason — pauses without a reason, or unlogged stoppages, are invisible. |
| The Print Queue button does nothing | It opens the label print queue only when the label-print module is installed; without it the button is silently inert. |
| The waste card shows no sparkline | The trend line renders only once the range holds at least six days of waste data; until then the card shows the number and threshold alone. |
Common mistakes
- Reading the dashboards as measurement when the floor is not recording — unlogged work shows as idle machines and zero output.
- Treating the capacity line as a plan. It is the raw sum of machine capacity ratings per day — a nominal reference; fixing the "gap" may just mean the capacities are optimistic.
- Expecting the wall screen to alert someone. Neither screen sends notifications — Andon calls and NCR escalations do that; the dashboards only display.
- Comparing this OEE with the Reporting pivot's summed OEE column — in the pivot the percentages add up unless read per row.
- Leaving Production Control open all day as a monitor — it refreshes only on its button; the self-reloading Dashboard is the wall-screen view.
Was this article helpful?
Thanks — your feedback helps.
Running a window or door factory?
Ask for a demo