Analyse finished output by stage and cost
What this does
Production › Reporting › Produced Units counts finished output: how many serialized units exist, at which floor stage they sit, and what they cost — per production order, per stage, over any period you group by. It is the "how much did we actually build" report, and the work-in-progress picture at the same time, because a unit's stage is where it physically is.
Before you start
- A production role — the whole Reporting menu is open to production users. This entry carries no feature gate of its own, so it is present even on a database where produced units cannot exist at all; an empty report here is not a permissions problem.
- Serialized units, which exist when the Barcode Scan-to-Advance feature creates them at production start, or when a finished order receives them into stock.
Steps
-
01
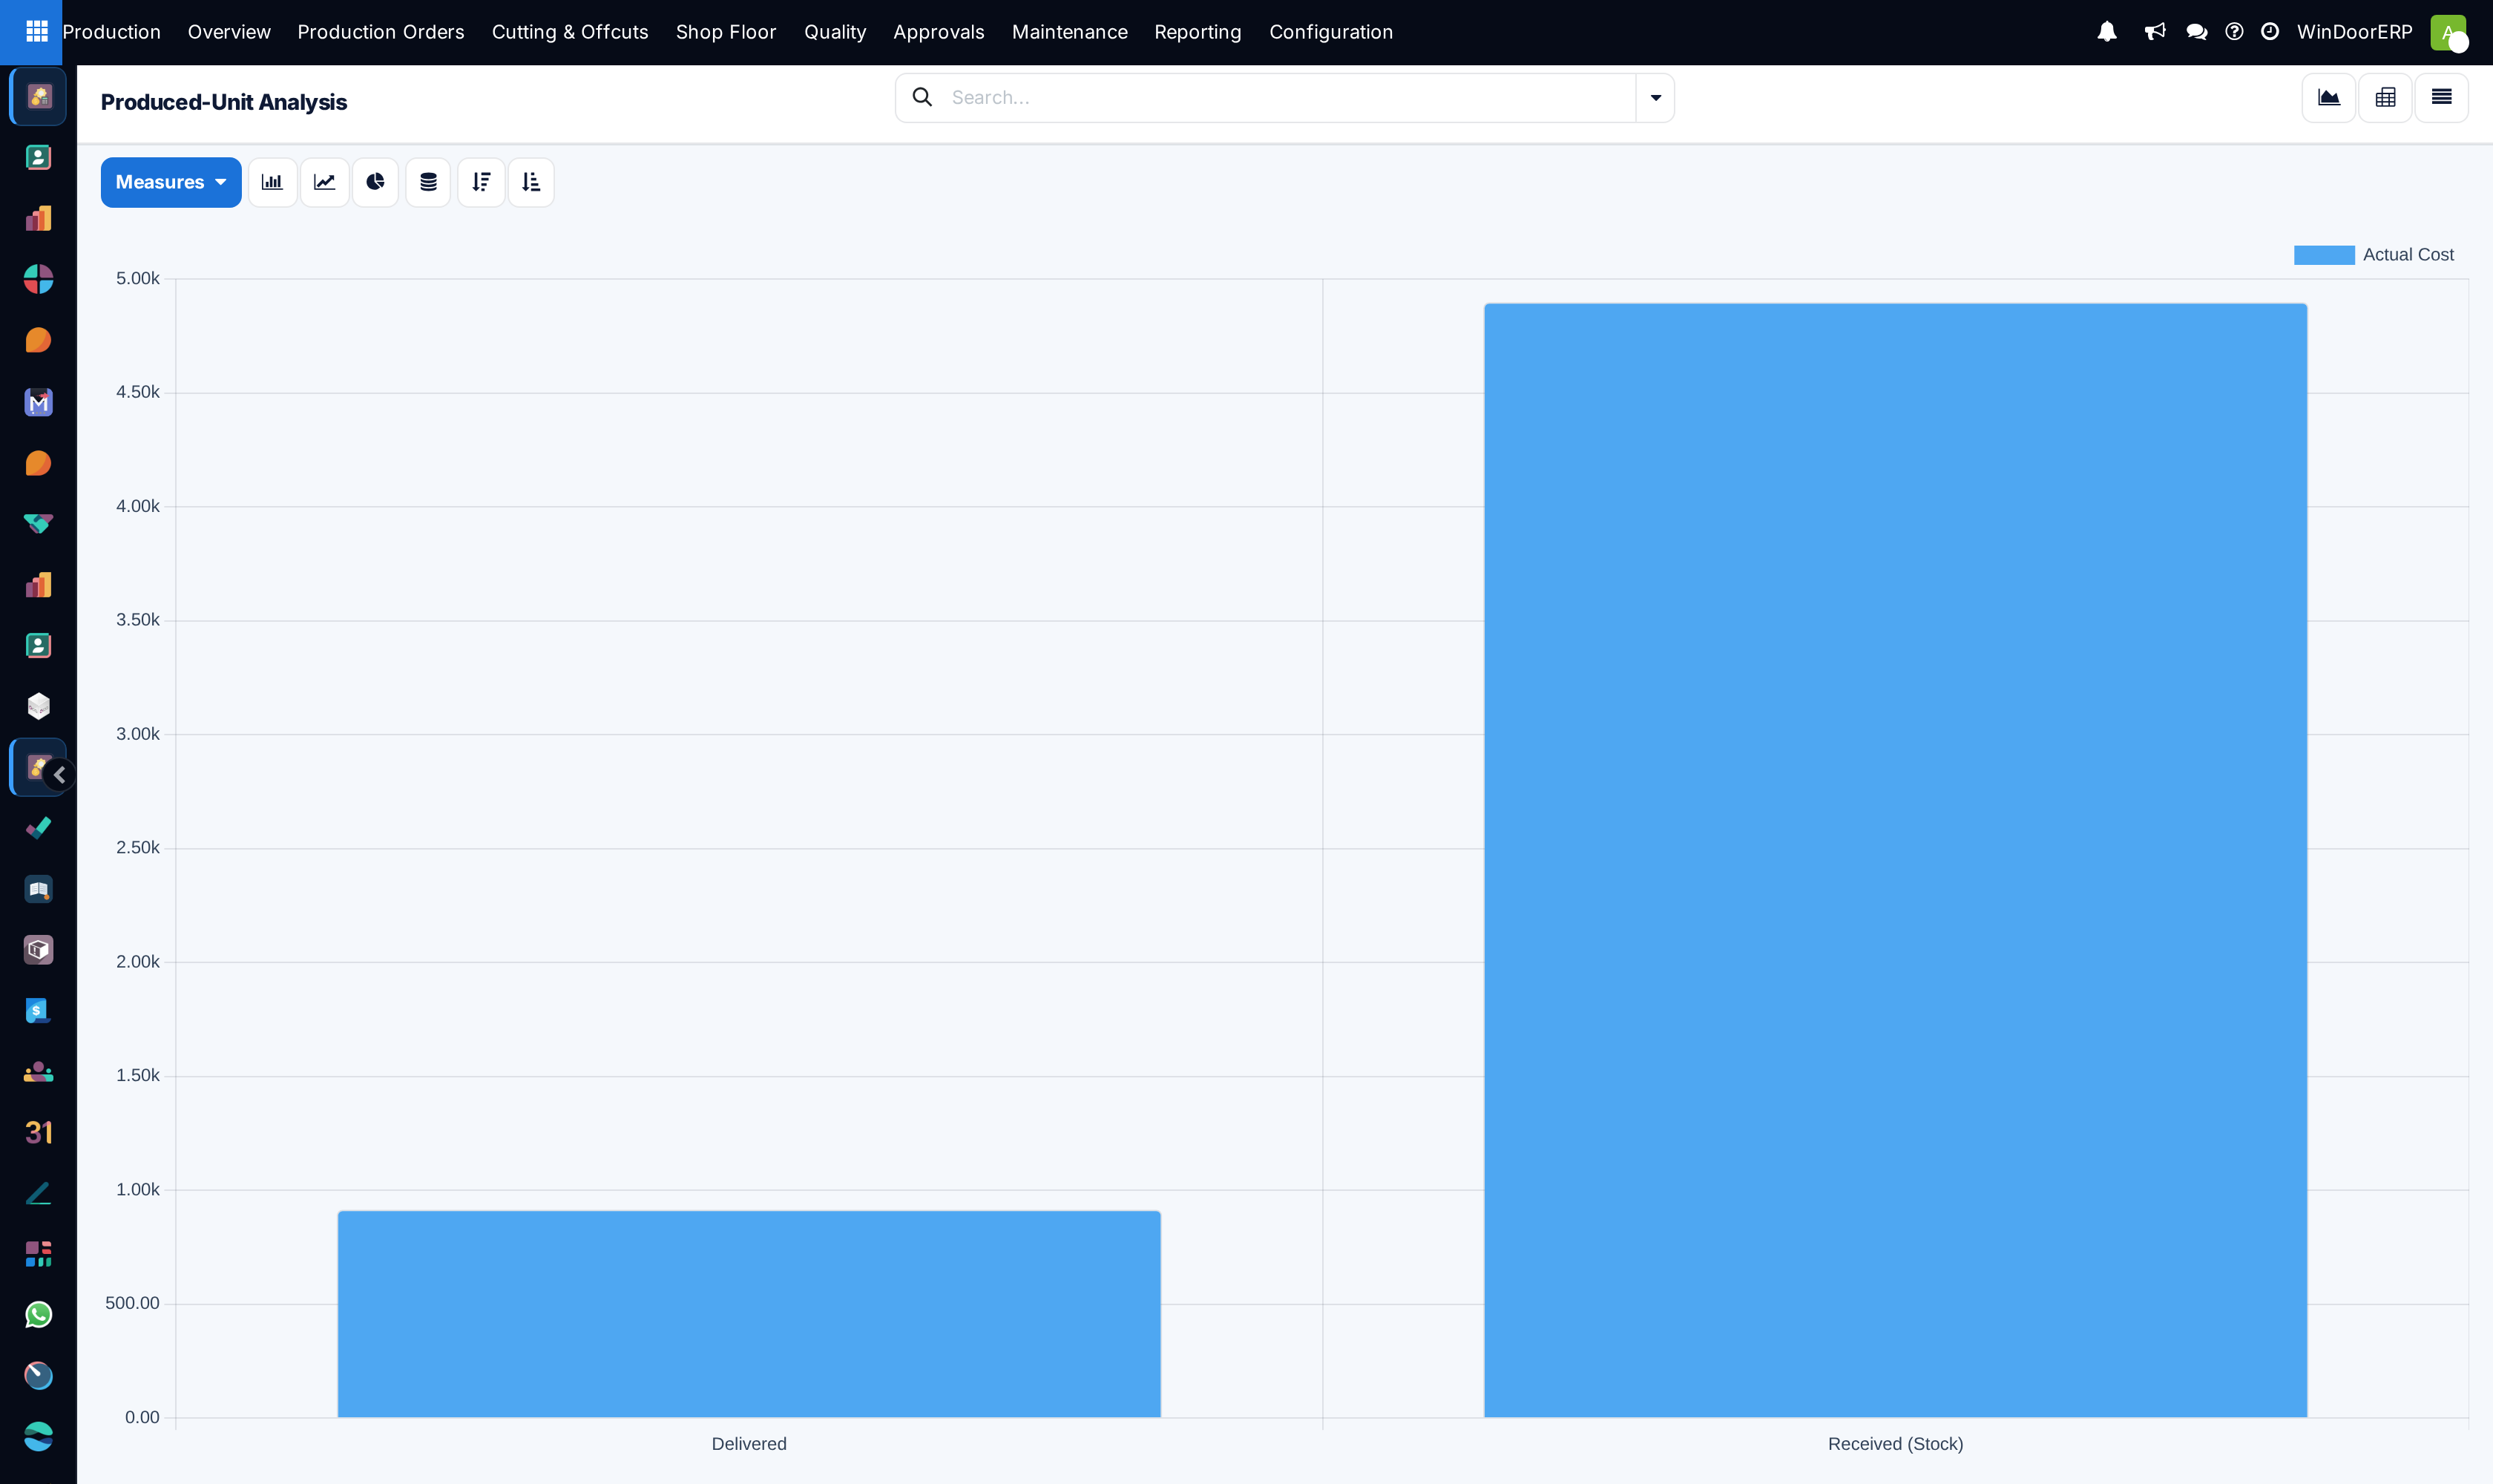
Open Production › Reporting › Produced Units. The bar chart opens on actual cost by stage.
-
02
Restrict the period first — the analysis opens over all units ever. There is no ready-made date filter to reach for: the filters offered are In Stock, Delivered, On Hold and CE Marked, with group-bys for Stage and Production Order, so build the date restriction with Add Custom Filter or approximate it by grouping on a date.
-
03
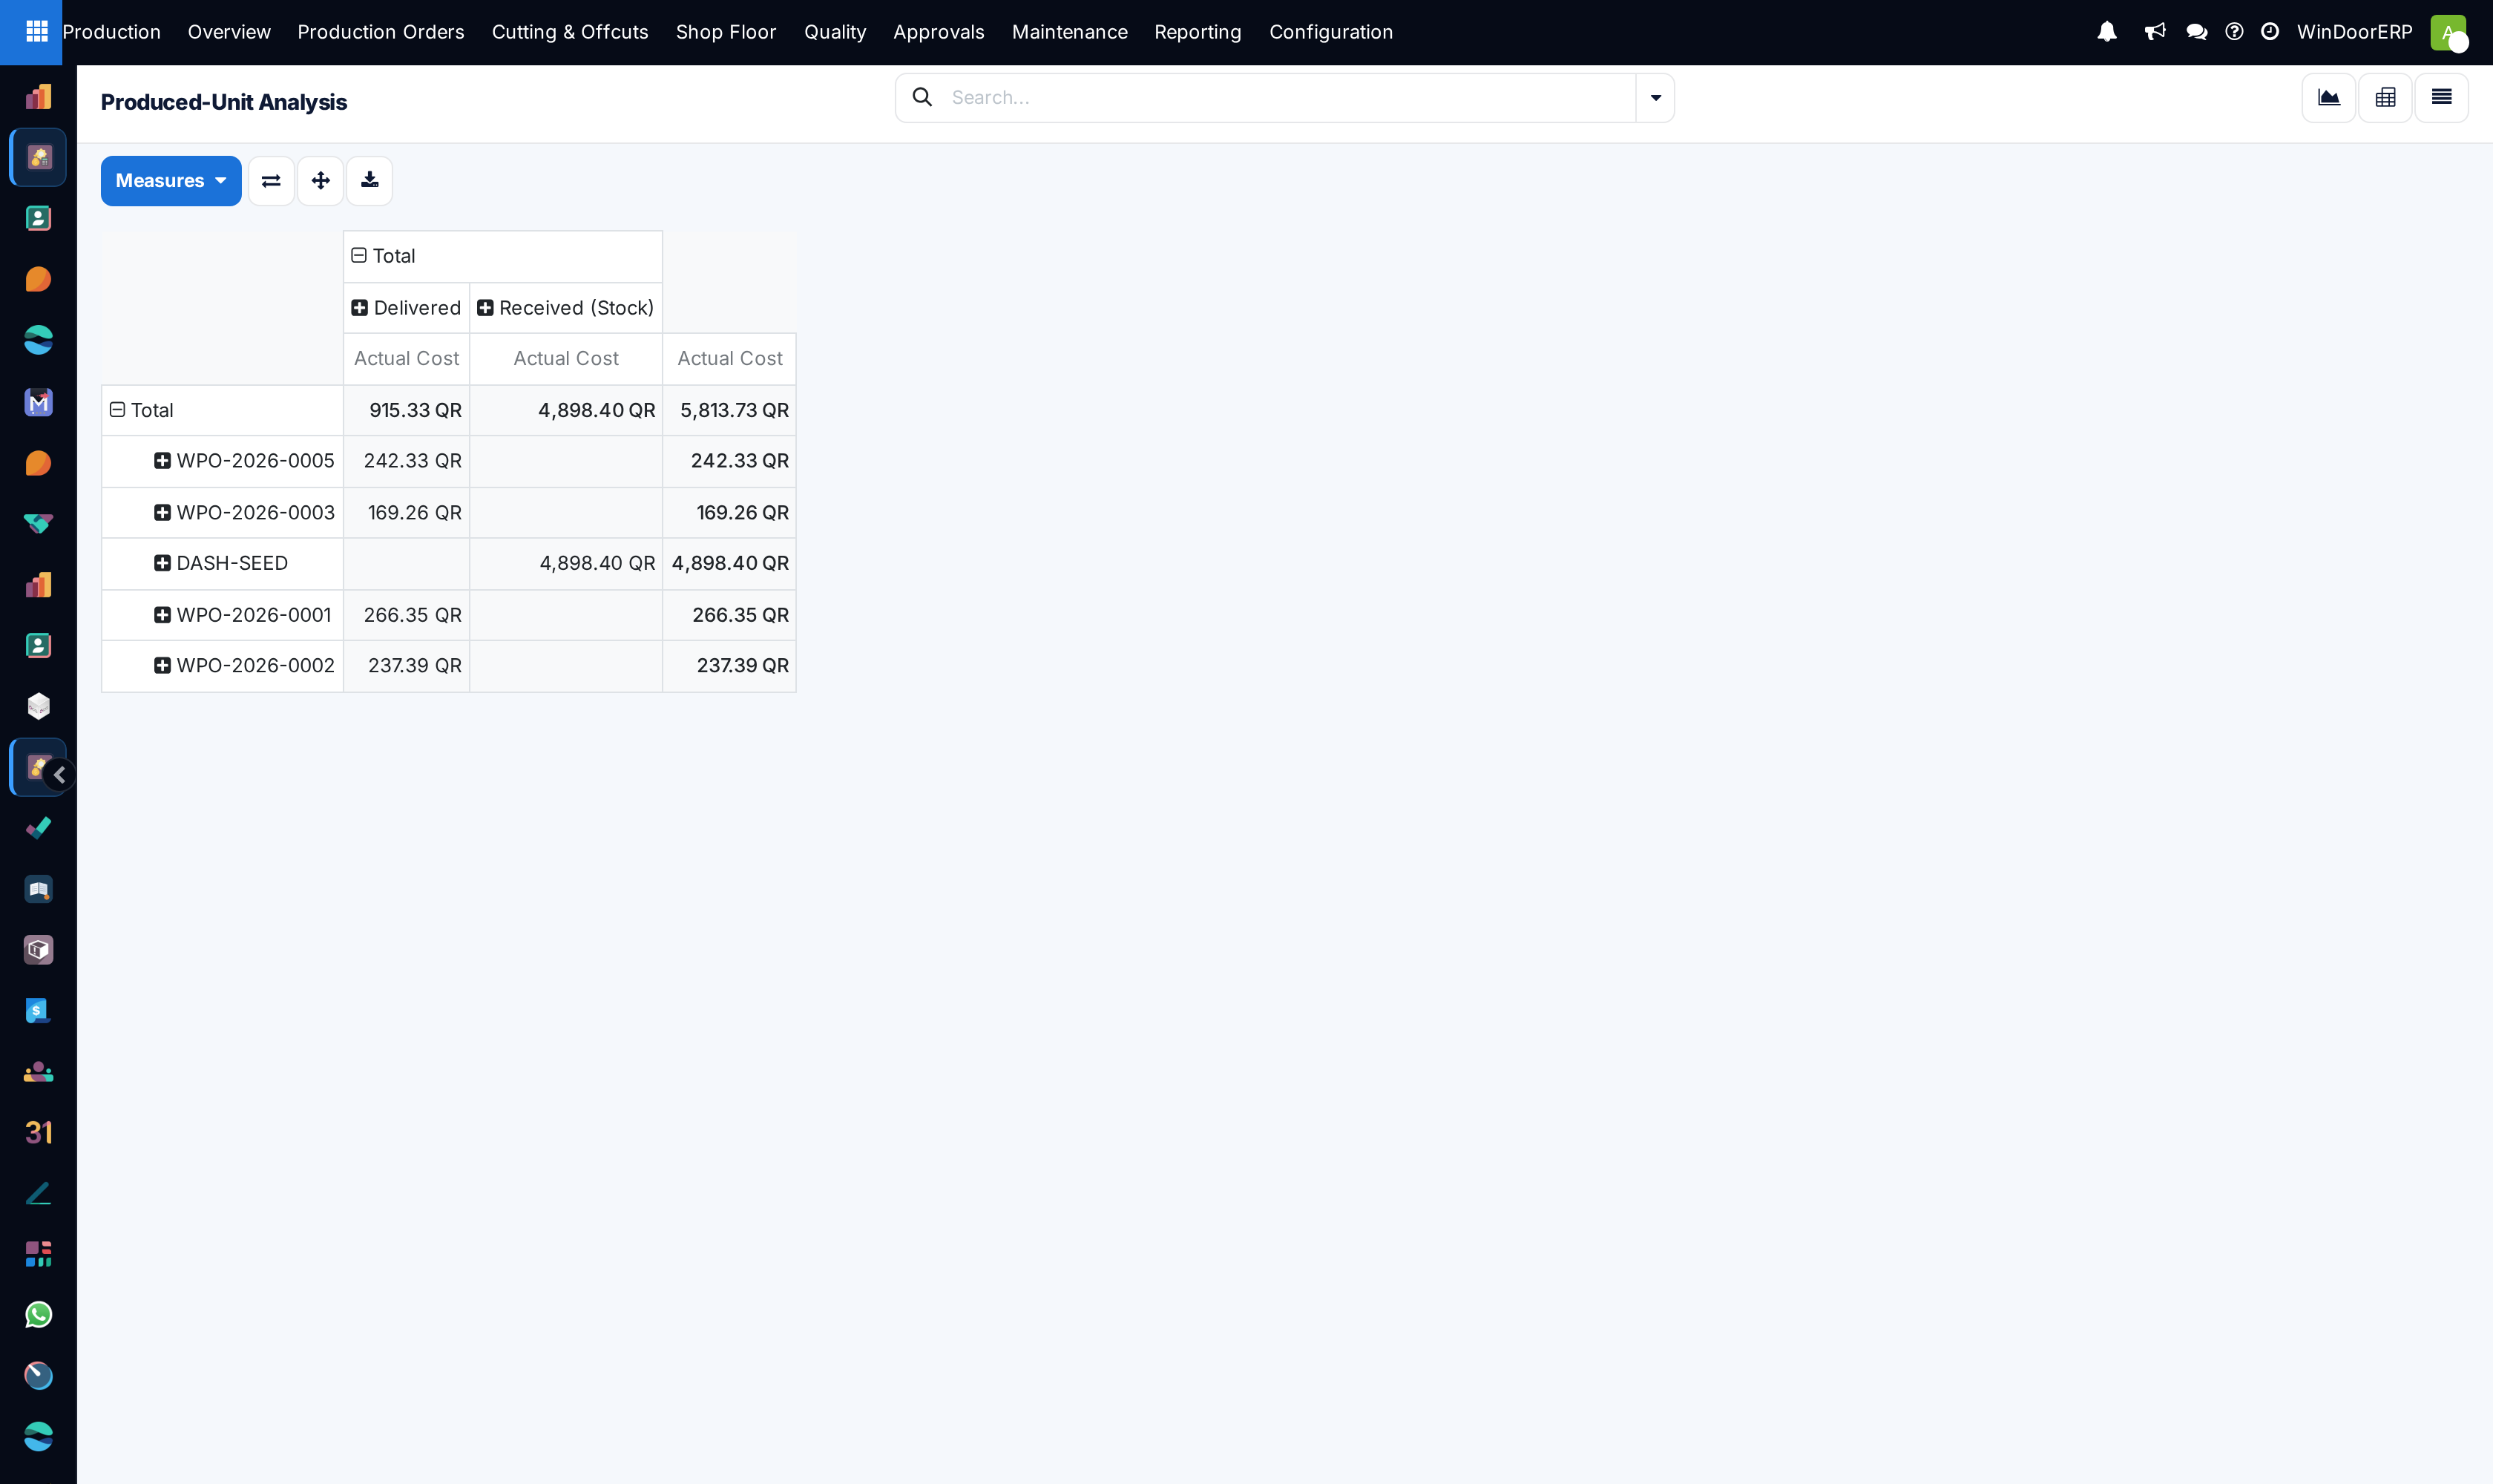
Switch to the Pivot for the standard cross-table: production orders down the side, stages across the top.
-
04
Change the measure from Measures — Count for units built, Actual Cost for money, or the individual material, labour and subcontract components.
-
05
Read completion as the shape of the stage columns: units piled in Queued or Cutting are work in progress; Received (Stock) and Delivered are finished output.
-
06
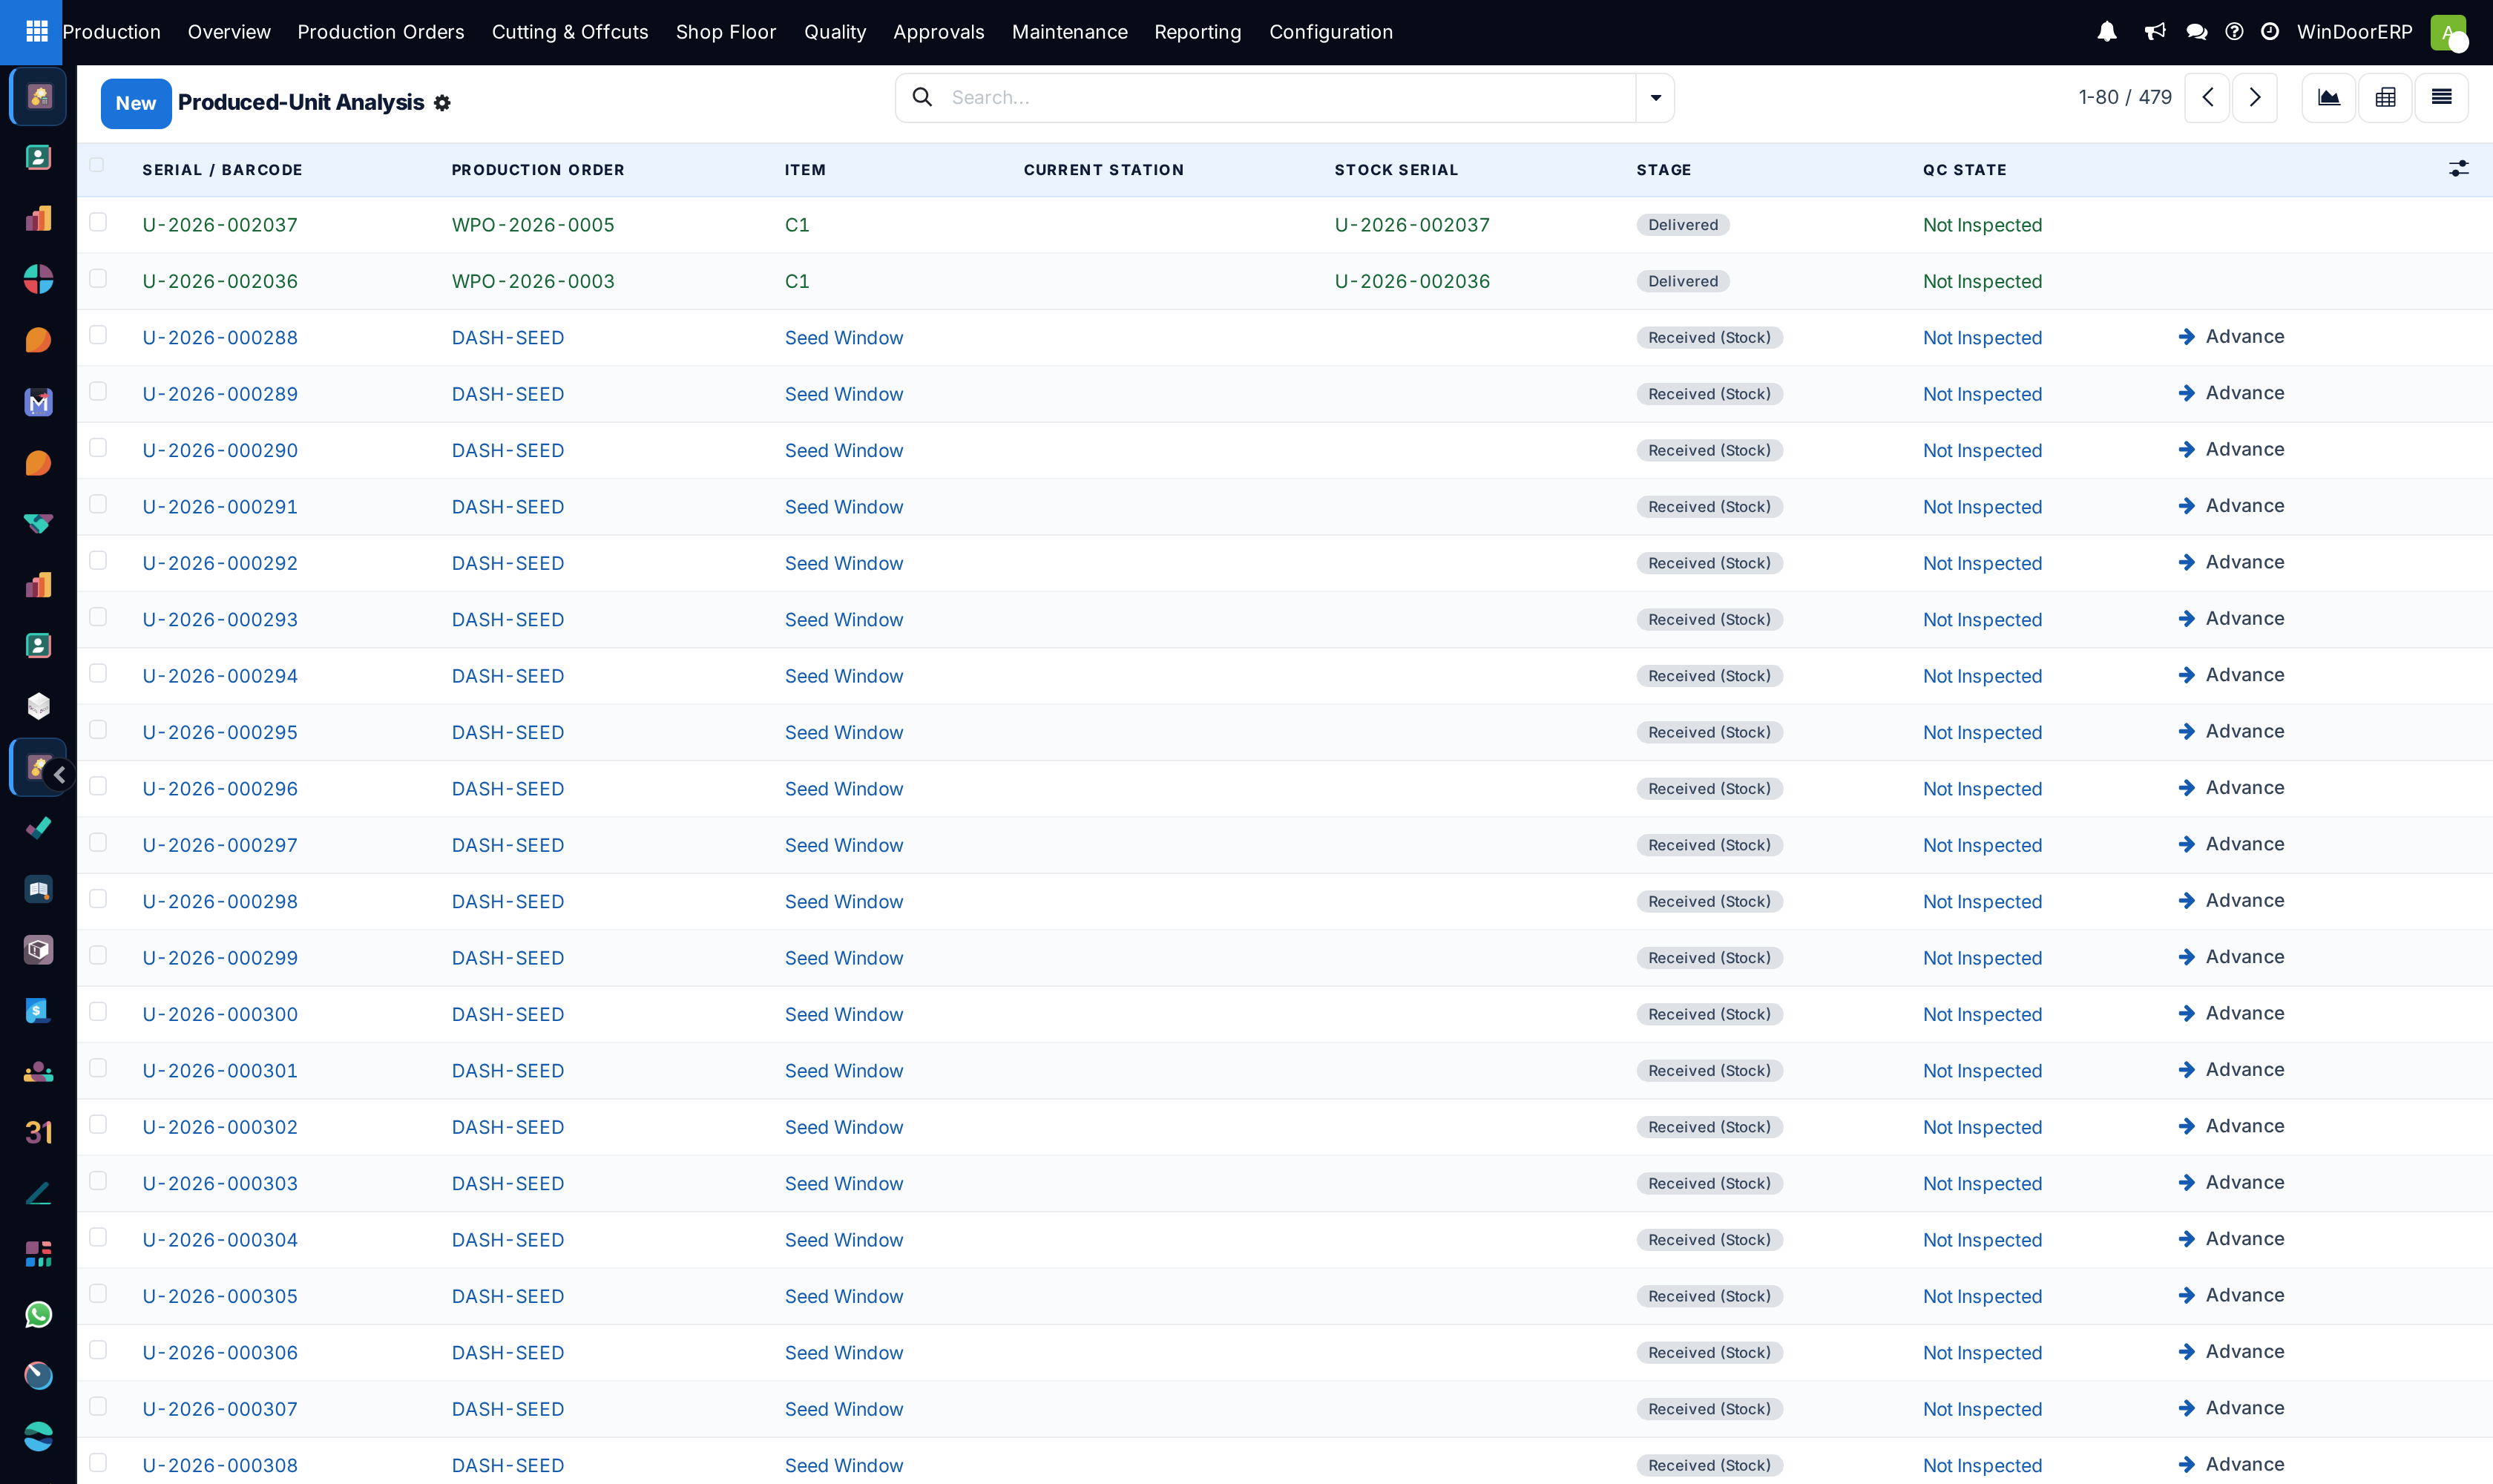
Click any bar or cell to open the units behind it.
What the measures mean
| Measure | Meaning |
|---|---|
| Count | Number of serialized units — the honest "how many windows" figure. |
| Actual Cost | Each unit's share of its item's costs: material + labour + subcontract. |
| Material / Labour / Subcontract Cost | The same split, available separately from the Measures menu. |
| Stage | Queued → Cutting → Welding → Glazing → Hardware → Quality Check → Packed → Received (Stock) → Delivered. Packed is the last floor stage; the two after it are warehouse states. |
Note
Units exist only where a feature creates them. Without piece scanning the report stays empty until orders are marked Done — and even then only if the Finished-Goods Inventory & Delivery feature is on, because it is the finished-goods receipt that creates the units at Done. With both features off, no unit is ever created and this report is permanently empty. And with no date filter the totals are all-time — always group or filter by a period before quoting a number as "output".
Troubleshooting
| The chart shows greyed sample data | Placeholder while nothing matches — it disappears with the first real unit. |
|---|---|
| Output looks impossibly high | No default date filter: you are seeing every unit ever. Group by month or add a period filter. |
| Cost columns are zero | The units' items have no costed material list or no labour logs — cost is inherited from the item, not typed on the unit. |
| Units never leave Packed | That is the last floor stage; receiving into stock is the warehouse step performed when the order is marked Done. |
| The report is empty although the factory is busy | Piece creation depends on the Scanning feature. Without it, units appear only at Done, and only where the Finished-Goods feature is on to receive them. With both off there are no units to report, however busy the shop is. |
Common mistakes
- Quoting all-time totals as monthly output.
- Reading Count as delivered windows — filter to the received or delivered stages for that.
- Comparing unit costs across orders whose labour was recorded with different discipline.
- Using this report to chase late work: it counts what exists, not what is overdue — that is the work-order analysis and the dashboards.
Was this article helpful?
Thanks — your feedback helps.
Running a window or door factory?
Ask for a demo