Analyse labour, work orders and quality in Production Reporting
What this does
Production › Reporting holds four pivot-and-graph analyses over the factory's execution records: Work Orders (planned versus actual minutes, output and OEE per station), Quality / NCRs (the defect Pareto — non-conformances by root-cause stage, category and disposition), Produced Units (work in progress and actual cost by floor stage), and Labour (minutes, good and scrap quantities and labour cost per operator). Each opens on live records — clicking through lands on the underlying work order, NCR, unit or log.
None of the four applies a date filter by default: every analysis opens over all records ever. The first move on each is almost always adding a date filter.
Before you start
- A production-user role; the Quality / NCRs entry additionally needs the Production Quality Inspector role.
- Recorded execution: labour logs with quantities, and finished work orders. Analyses over unrecorded work read as empty — or, on a brand-new database, as greyed-out sample data that vanishes the moment a first real record exists.
Steps
-
01
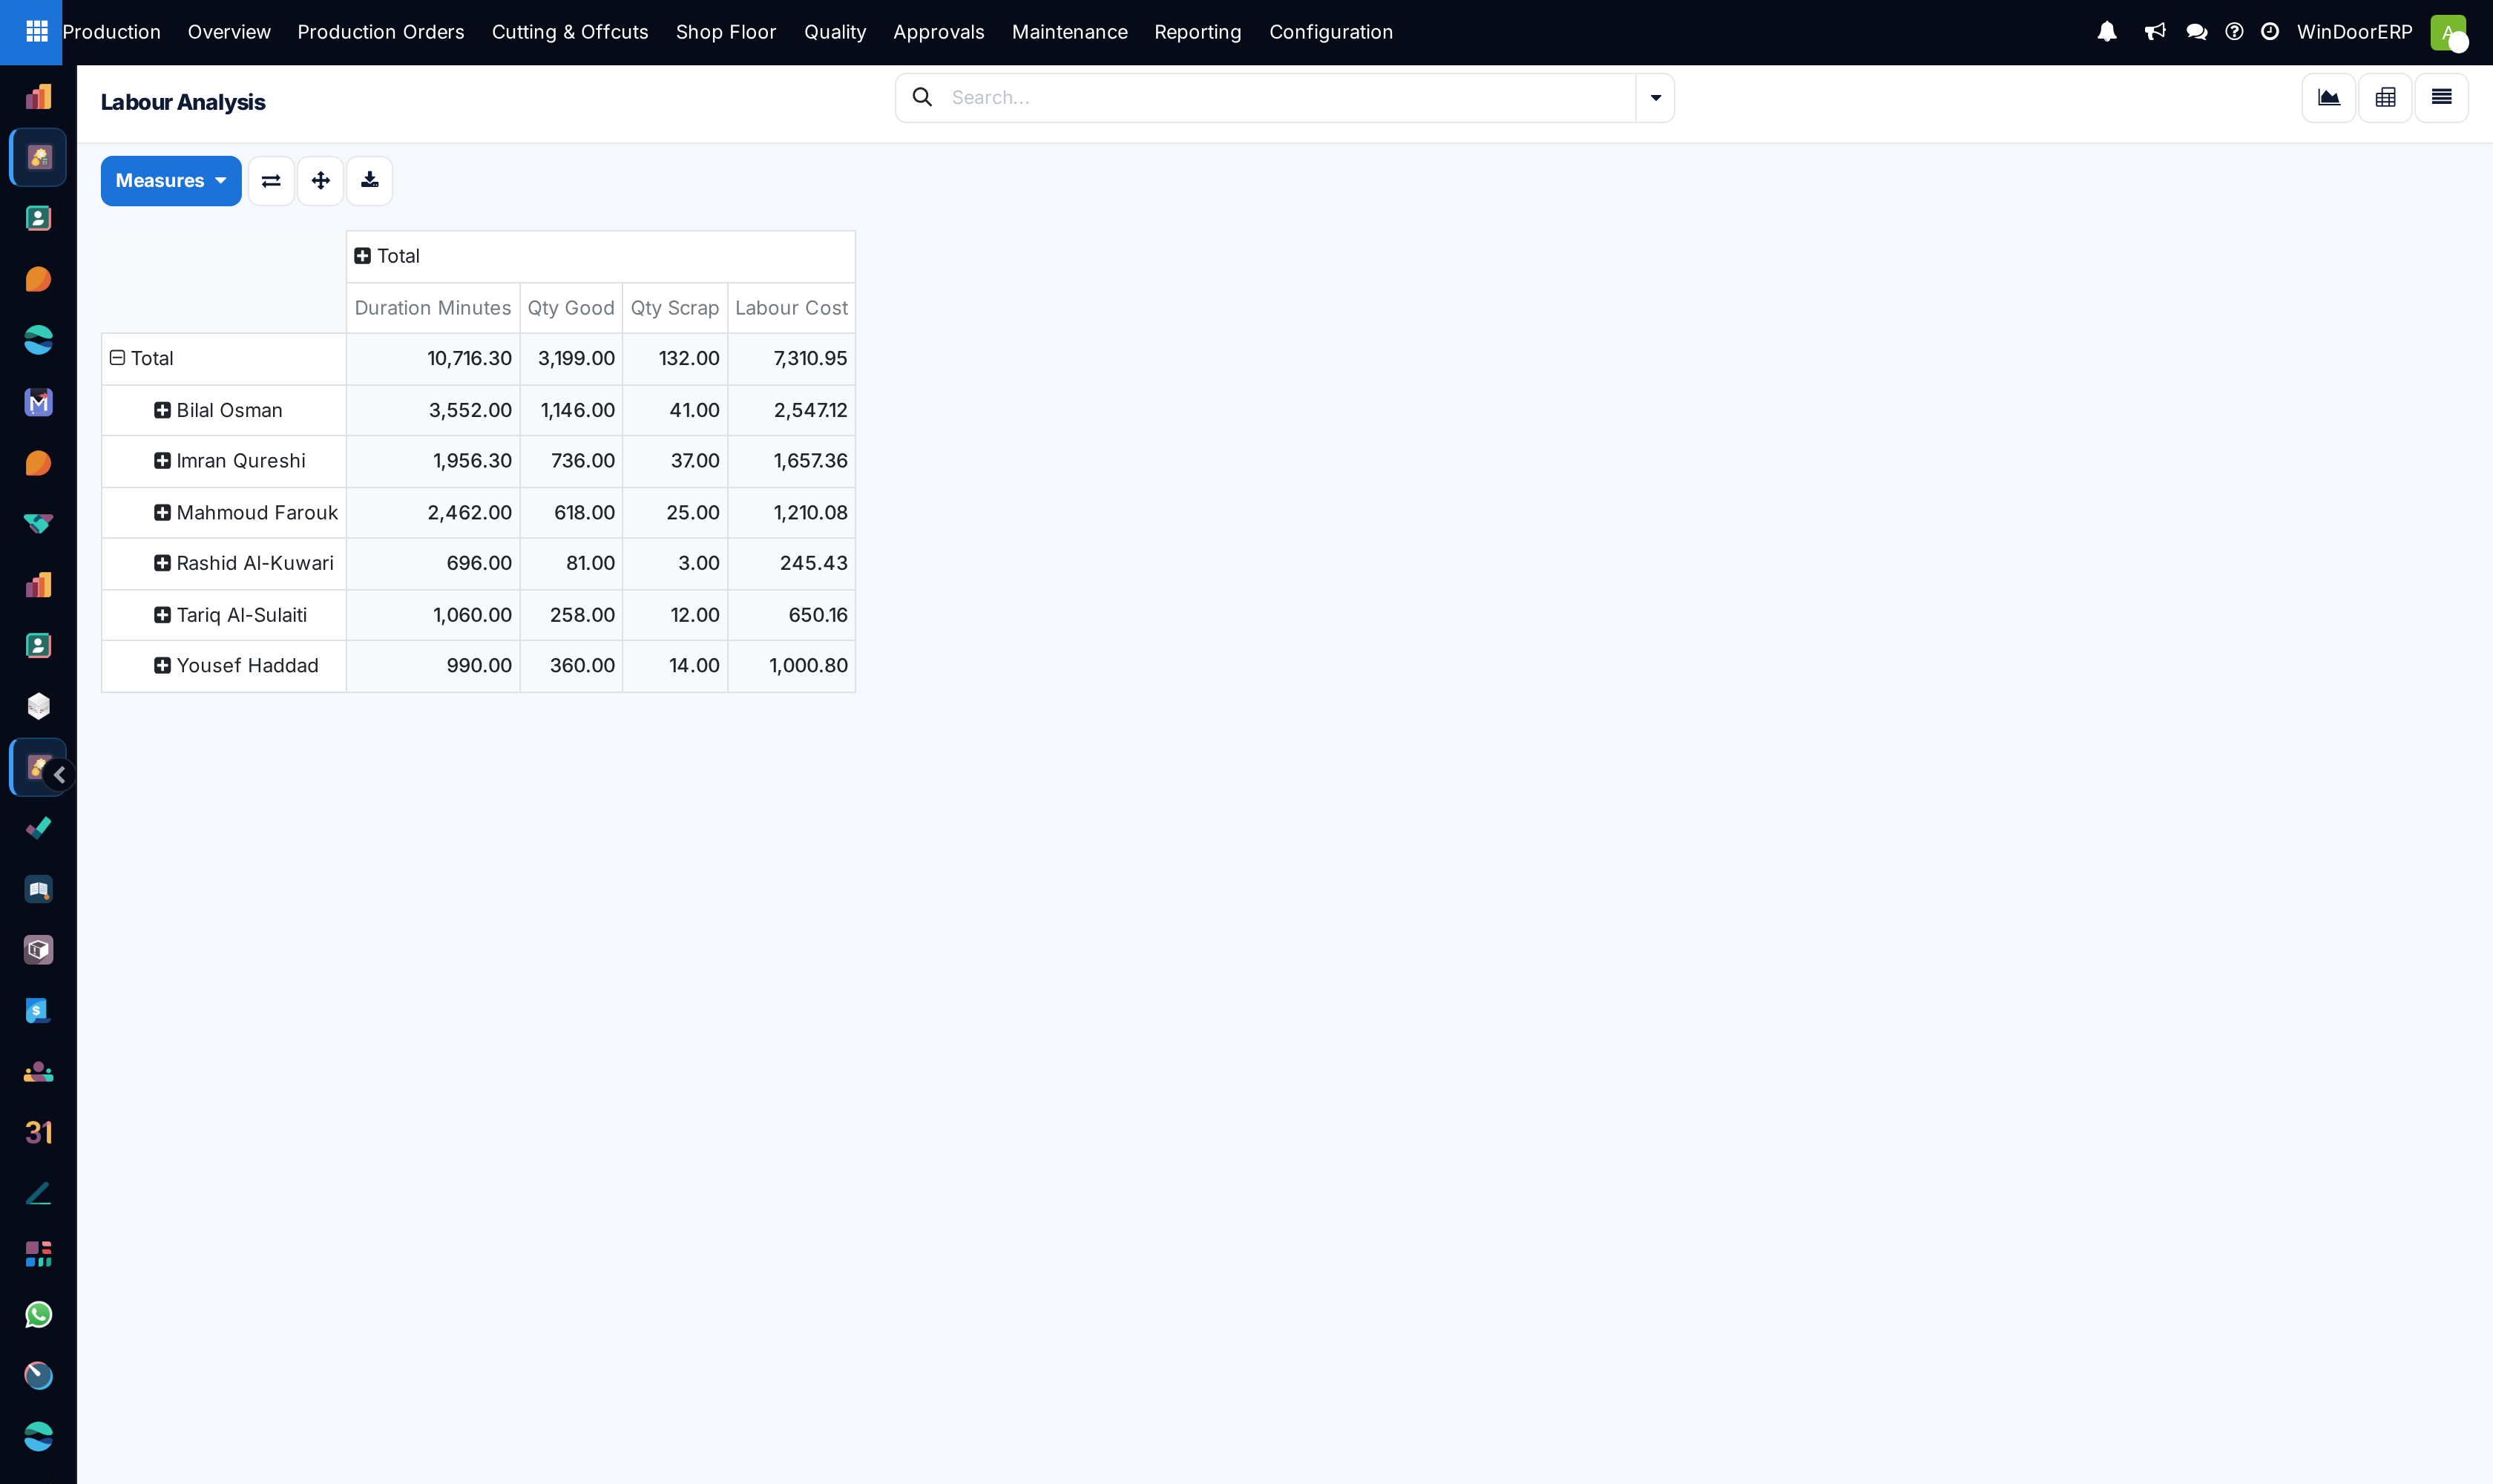
Open Production › Reporting › Labour. The bar chart shows minutes and labour cost per operator; the pivot adds good and scrap quantities.
-
02
Add a date filter first (group or filter on the start date) — the screen opens unfiltered over the whole history.
-
03
Pick measures from Measures — beyond the defaults, every stored number on the model is offered (piece-rate cost on labour, downtime and energy cost on work orders, the cost split on units).
-
04
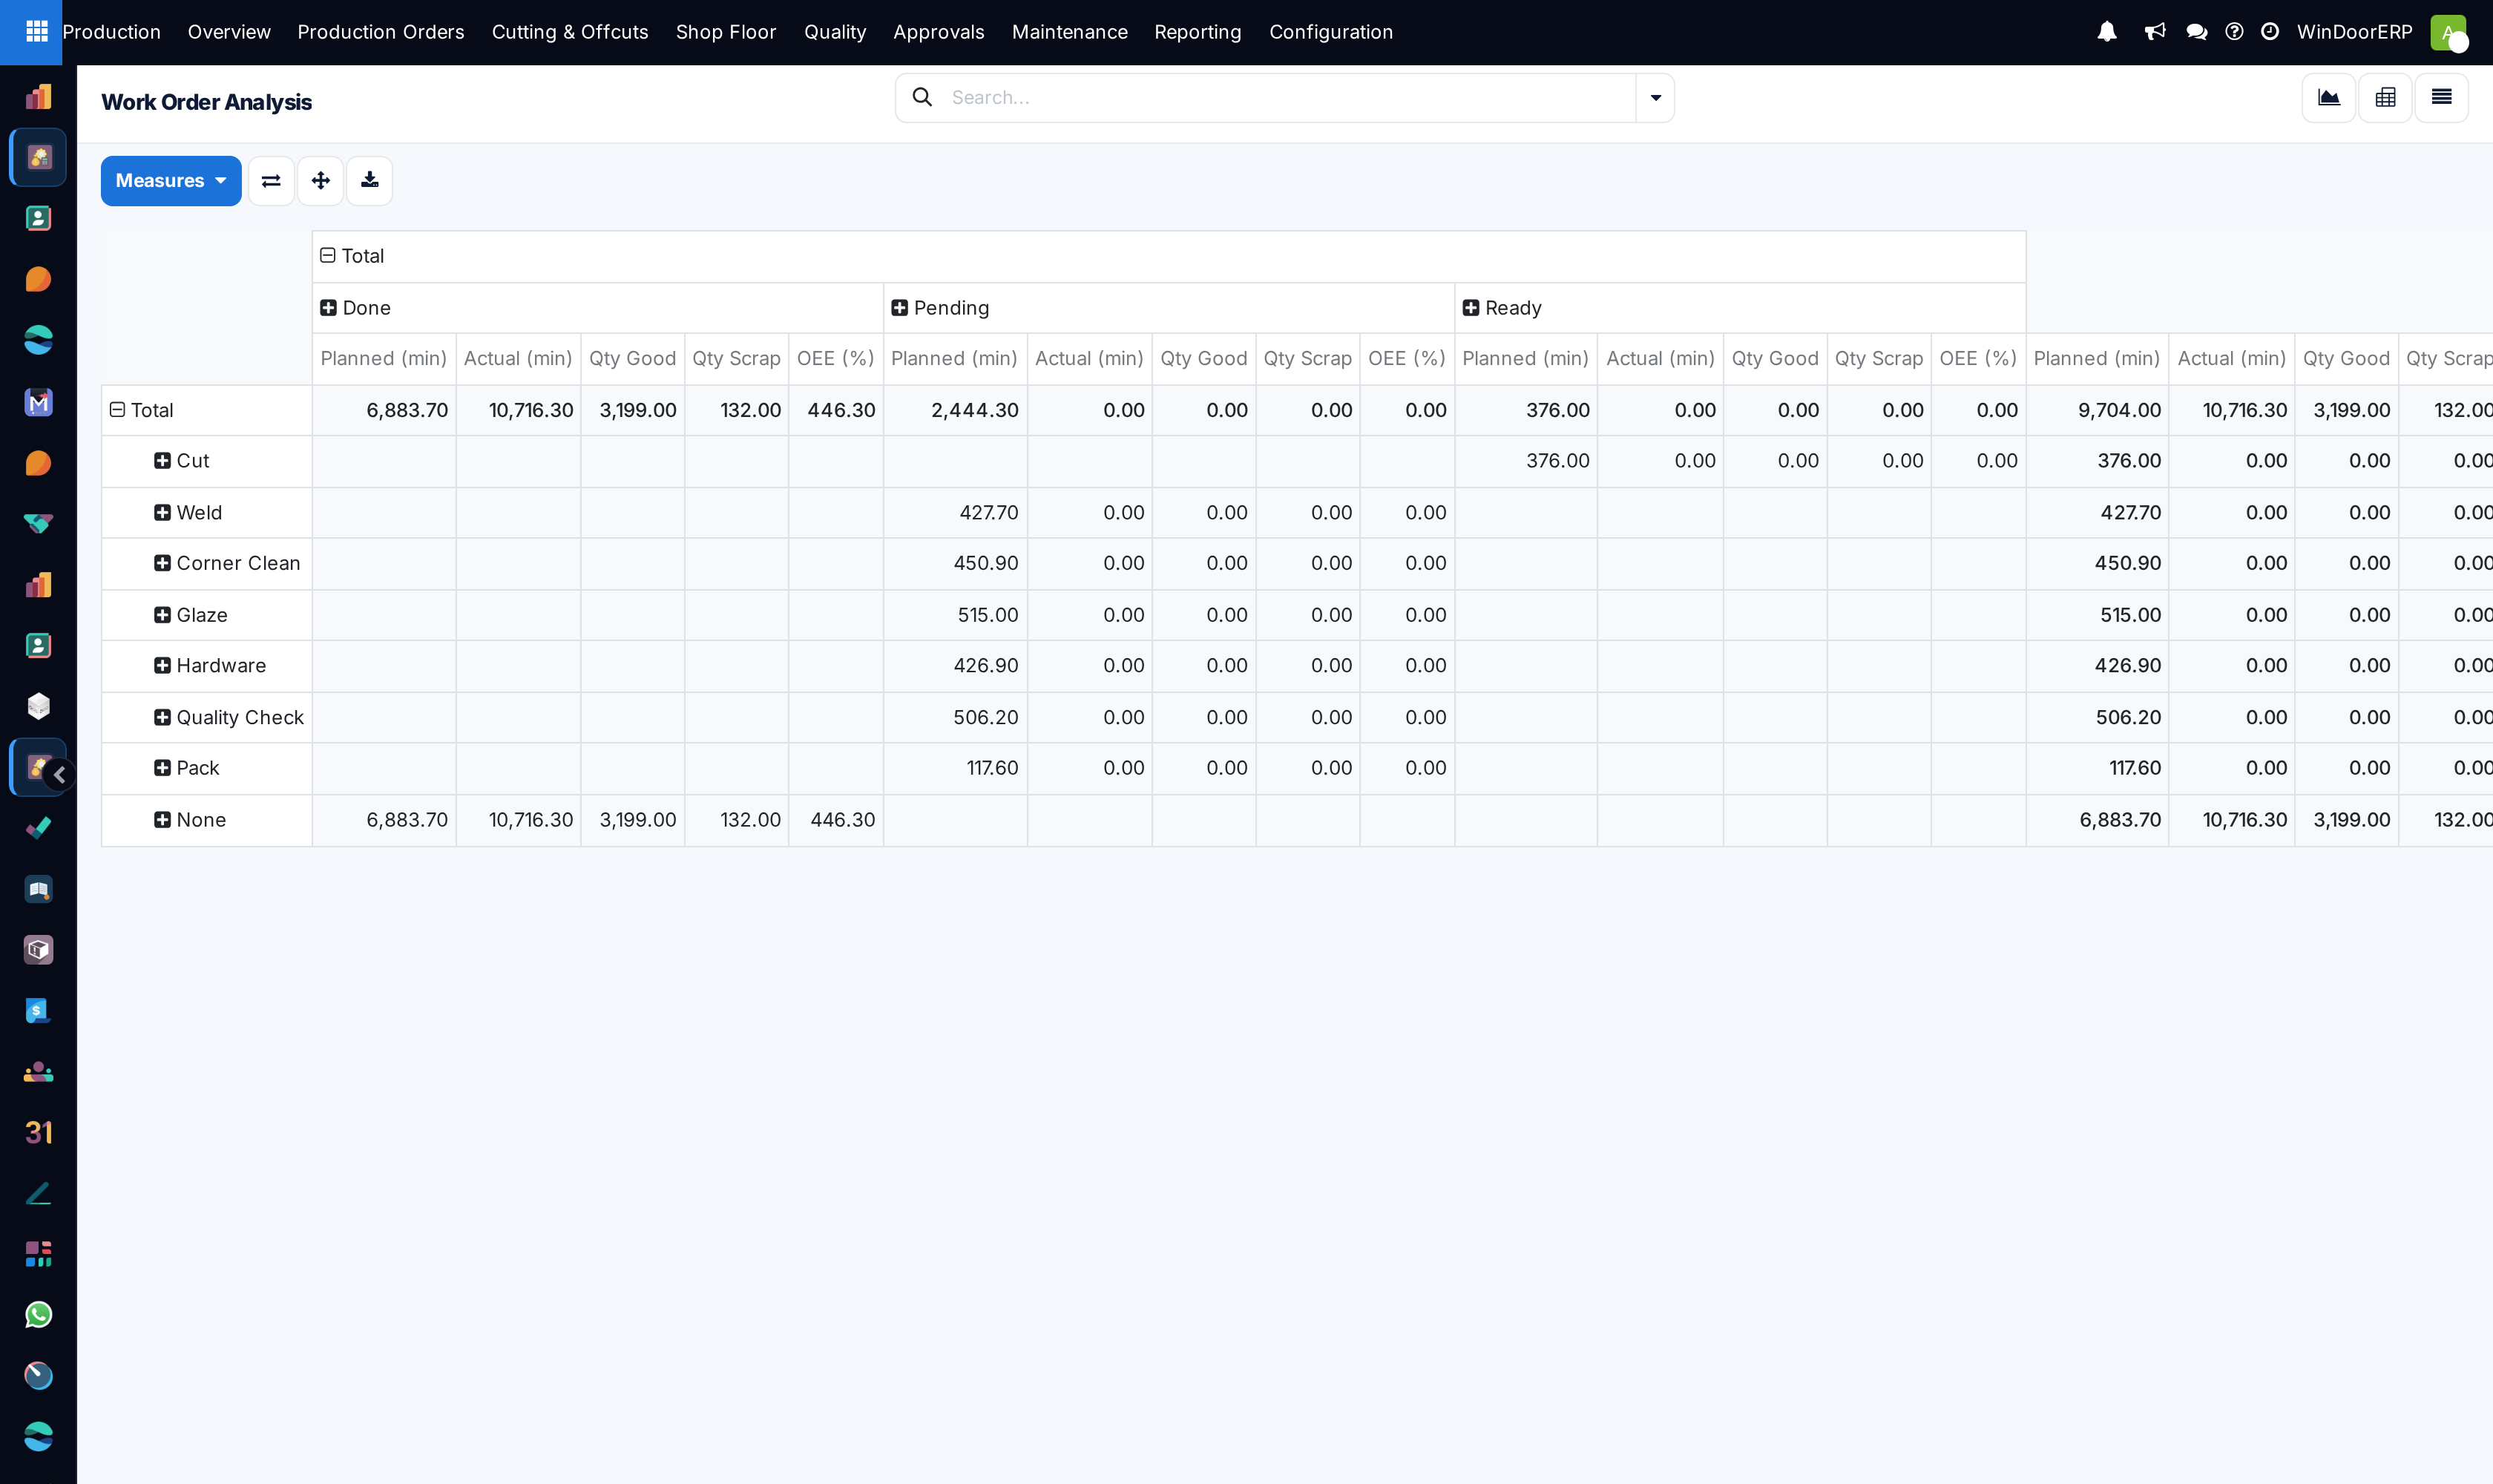
Switch to Reporting › Work Orders for the station view: the bar chart shows OEE and actual minutes per work center; the pivot adds planned minutes and the quantities, split by state.
-
05
Use Reporting › Quality / NCRs as the defect Pareto — count of non-conformances by root-cause stage, and the category × disposition cross-table.
-
06
Use Reporting › Produced Units for WIP: units and actual cost per floor stage, per production order.
What each analysis shows
| Analysis | Rows over | Default measures |
|---|---|---|
| Work Orders | One row per work order | Graph: OEE and actual minutes by work center. Pivot: planned and actual minutes, good and scrap quantities, OEE — work center × state. |
| Quality / NCRs | One row per non-conformance | Count by root-cause stage (graph) and defect category × disposition (pivot). |
| Produced Units | One row per serialized piece | Actual cost by stage (graph) and production order × stage (pivot). |
| Labour | One row per labour log | Duration minutes and labour cost by operator (graph); plus good and scrap quantities (pivot). |
Important
OEE columns add up — and a summed OEE is meaningless. The pivot's Total row happily shows figures like OEE 446%: several work orders' percentages added together. Read OEE per row only, never on group or total lines (the three OEE components — availability, performance, quality — are also offerable measures with the same caveat). The minutes, quantities and costs, by contrast, are true sums.
Where the numbers come from
- Minutes, quantities and labour cost are the labour logs the terminal (or a supervisor) records — time × the work center's hourly rate plus good units × the piece rate.
- OEE is computed per work order from its logs: availability (downtime minutes with an availability-type loss reason), performance (actual versus planned minutes) and quality (good versus scrap).
- Actual cost on produced units is each unit's share of its item's material, labour and subcontract costs.
- The Labour list view is the same screen as Shop Floor › Labour Logs — payroll buttons included, so a manager can drill from an analysis straight into a payroll export. (With the Work Orders feature off, the Shop Floor menu entry disappears and this Reporting entry becomes the only way to the logs.)
Troubleshooting
| The analysis shows data on a system nobody has used | Greyed-out sample rows render while the result set is empty — placeholder, not real records. They disappear with the first real data. |
|---|---|
| Numbers look far too big | No default date filter — you are looking at all-time totals. Filter or group by date. |
| A total row shows OEE above 100% | Summed percentages. Read OEE per row. |
| Quality / NCRs is missing from the Reporting menu | That entry needs the Production Quality Inspector role on top of production user. |
| An operator's labour differs from the terminal's leaderboard | Different records: the kiosk's Today's Leaderboard counts pieces scanned today, while Labour Analysis aggregates labour logs — different units and windows, not directly comparable. (The backend Operator Leaderboard, meanwhile, is the all-time labour-log view.) |
Common mistakes
- Reading planned-versus-actual variance as operator performance when the plan minutes were rough estimates — calibrate planned minutes before judging people by them.
- Comparing labour cost across operators on different piece rates and hourly rates as if it were effort.
- Treating scrap counts as a quality measure on their own — scrap only appears where operators record it at Finish.
- Building a Pareto on Quality / NCRs while the floor raises NCRs without root-cause stages — group by what is actually filled.
- Screenshotting sample data into a management report. If every bar is grey and suspiciously smooth, it is the placeholder.
Was this article helpful?
Thanks — your feedback helps.
Running a window or door factory?
Ask for a demo