Rank customers by what they bought — and why this menu counts quotations too
What this does
Sales Analysis By Customers answers one question well: who buys, and how much. It is the Sales Analysis report opened with the customer grouping already applied, so the first thing you see is one row per customer.
Use it to rank accounts, to see whether a contractor's volume is growing or fading, and to spot the handful of customers a fenestration business actually depends on.
Before you start
- This screen does not restrict itself to confirmed orders. Read the warning below before you quote a number from it — it is the single most important thing about this menu.
- Rows are order lines, so a customer's figure is the sum of their lines, not a count of their orders.
- Only graph and pivot are available here. There is no list view on this menu.
Steps
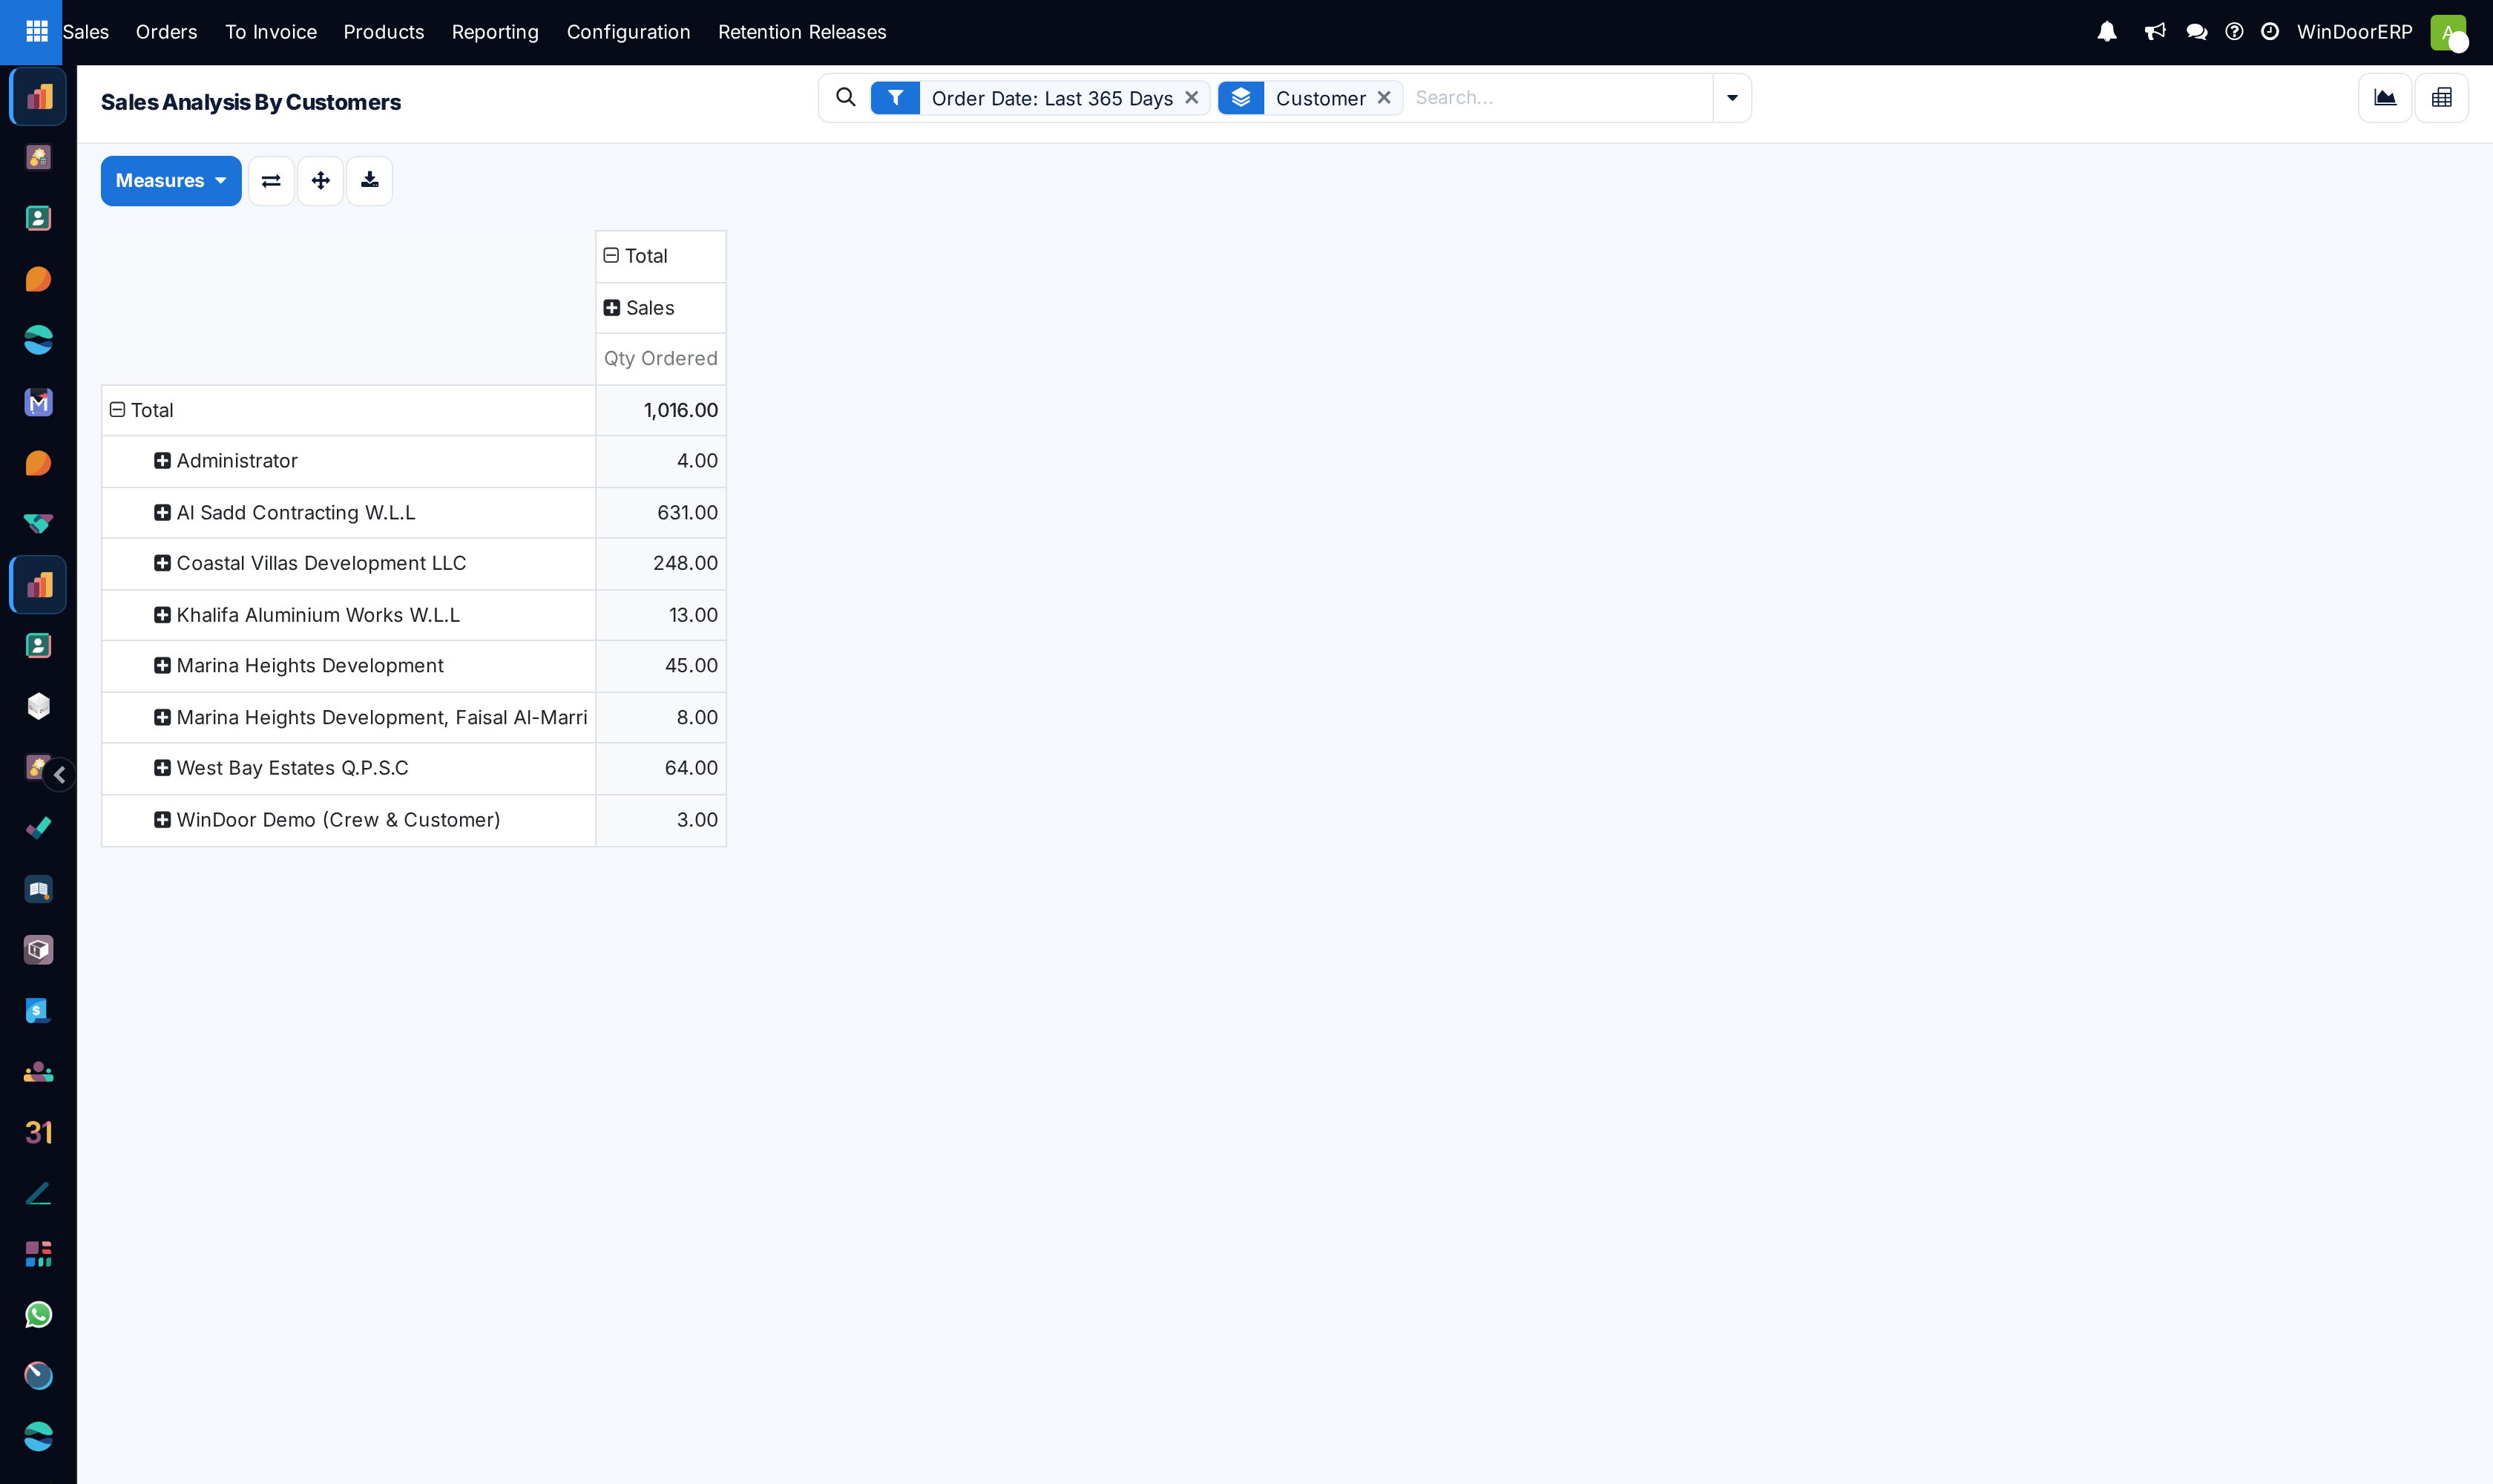
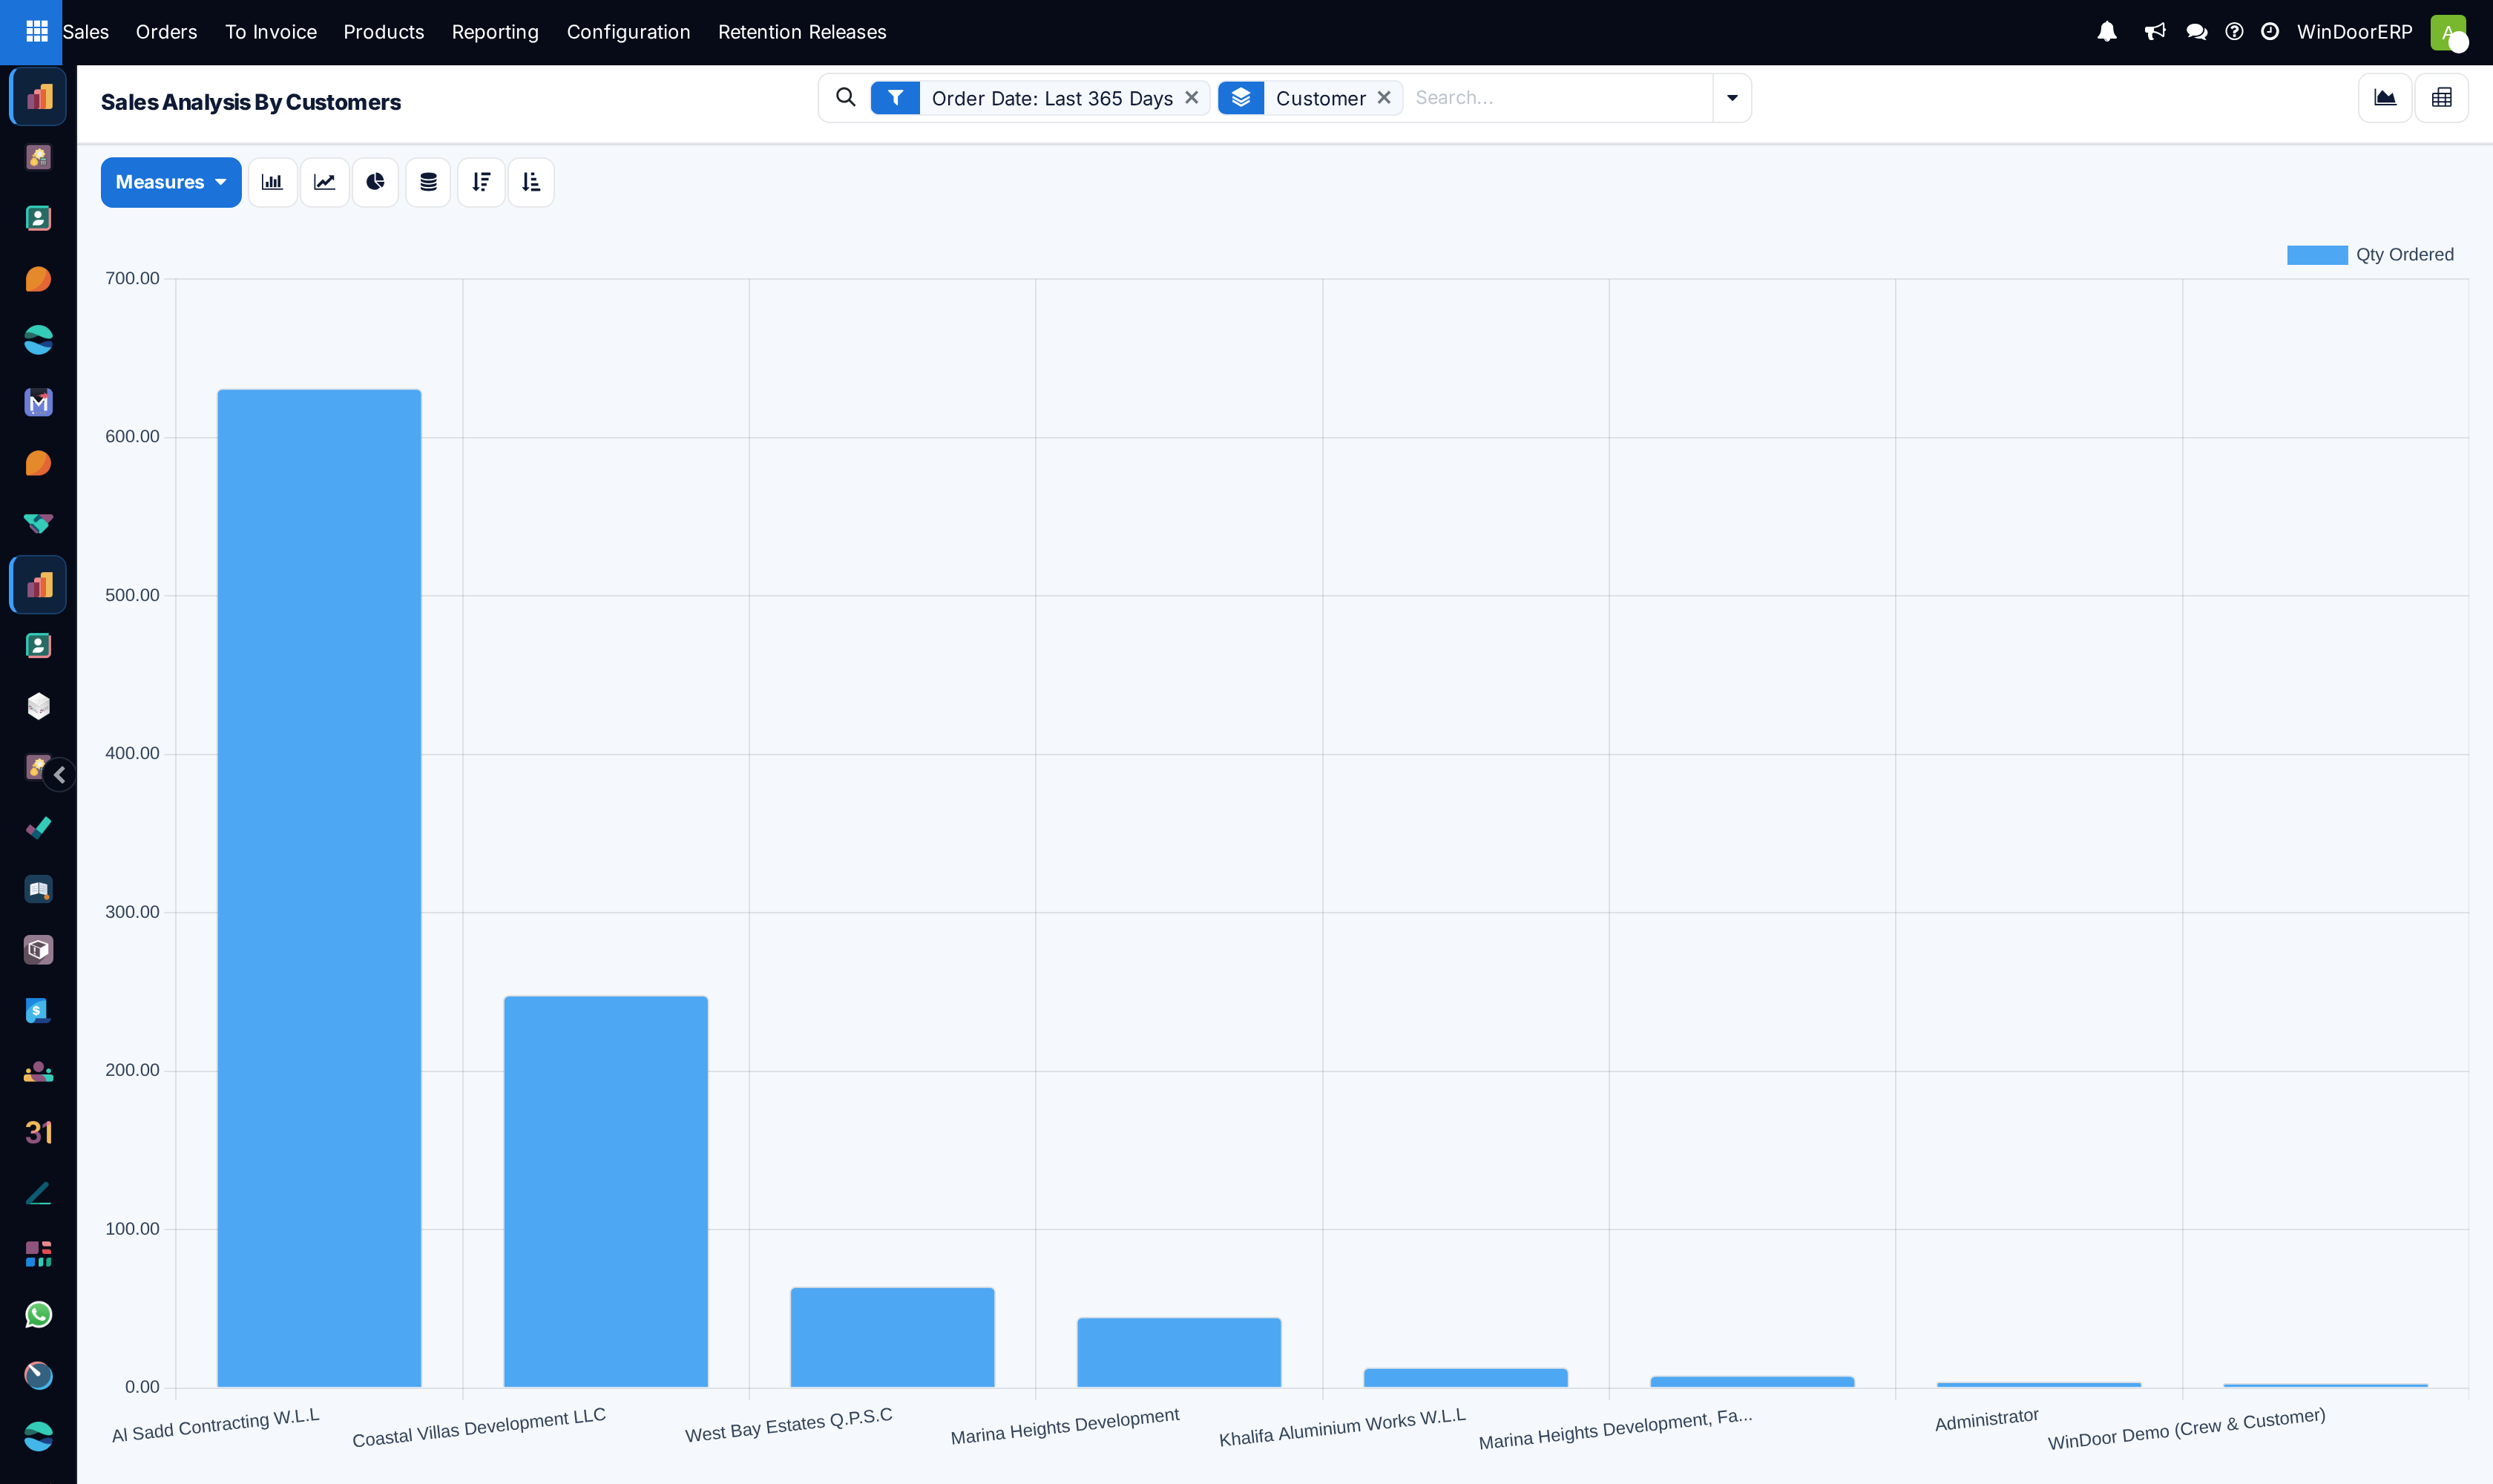
This menu includes quotations; the Sales menu does not
Look at the search bar. Sales › Reporting › Sales opens with two facets, Sales Orders and Order Date: Last 365 Days. This menu opens with only the date one. The Sales Orders filter — the one that excludes quotations, sent quotations and cancelled orders — is simply not applied here.
The effect is not small. On the demonstration data, the same period and the same measure give 991 under the Sales menu and 2,864 here, because everything merely quoted is counted as though it had been sold. Nearly two thirds of what this screen shows had not been won.
So a customer ranking taken straight from this menu ranks customers by what they were offered. Apply the Sales Orders filter yourself before using any figure from here as revenue.
-
01
Open Sales › Reporting › Customers.
-
02
Change the measure. It opens on Qty Ordered; for an account ranking you almost always want Untaxed Total.
-
03
Switch to the pivot with the button at the top right — a ranking reads far better as a table than as a chart.
-
04
Add a second grouping such as Order Date to turn the ranking into a trend per customer.
-
05
Use the download button to take the table into a spreadsheet if it is going into a report.
Grouping is by contact, not by company
The grouping uses the customer on the order, which is the exact contact chosen — not the company they belong to. A developer who orders through three site offices appears as three rows, and their true total is the sum of them.
The report does carry Customer Entity, which is the parent company, and grouping by that instead consolidates the branches into one row. If your customers are corporate groups with child contacts, that is usually the grouping you actually want.
What else to group by
| Customer Entity | The parent company, consolidating child contacts. |
|---|---|
| Customer Country / Customer State | Geographic view, as far as the contact records are filled in. |
| Customer Industry | Contractor versus developer versus private, if the industry field is maintained. |
| Order Date | Combined with the customer, gives a per-account trend. |
| Salesperson | Who holds each account. |
| Product Category | What a given customer actually buys — windows, doors, services. |
Troubleshooting
| The totals are far higher than the Sales menu shows | The Sales Orders filter is not applied here. Add it. |
|---|---|
| One customer appears several times | Grouping is by contact. Group by Customer Entity to consolidate. |
| A big account is missing | Their orders are older than a year — the date facet. Remove it. |
| There is no list view | Correct: this menu offers graph and pivot only. Use Reporting › Sales for a list. |
| The quantities look meaningless | Different products use different units. Switch the measure to Untaxed Total. |
Common mistakes
- Presenting this screen's totals as revenue without adding the Sales Orders filter.
- Ranking accounts on Qty Ordered, which adds square metres to pieces.
- Treating child contacts as separate customers.
- Comparing a figure from here with one from Reporting › Sales without noticing the two screens start with different filters.
Was this article helpful?
Thanks — your feedback helps.
Running a window or door factory?
Ask for a demo