Read the operator leaderboard: output, yield and cost per operator
What this does
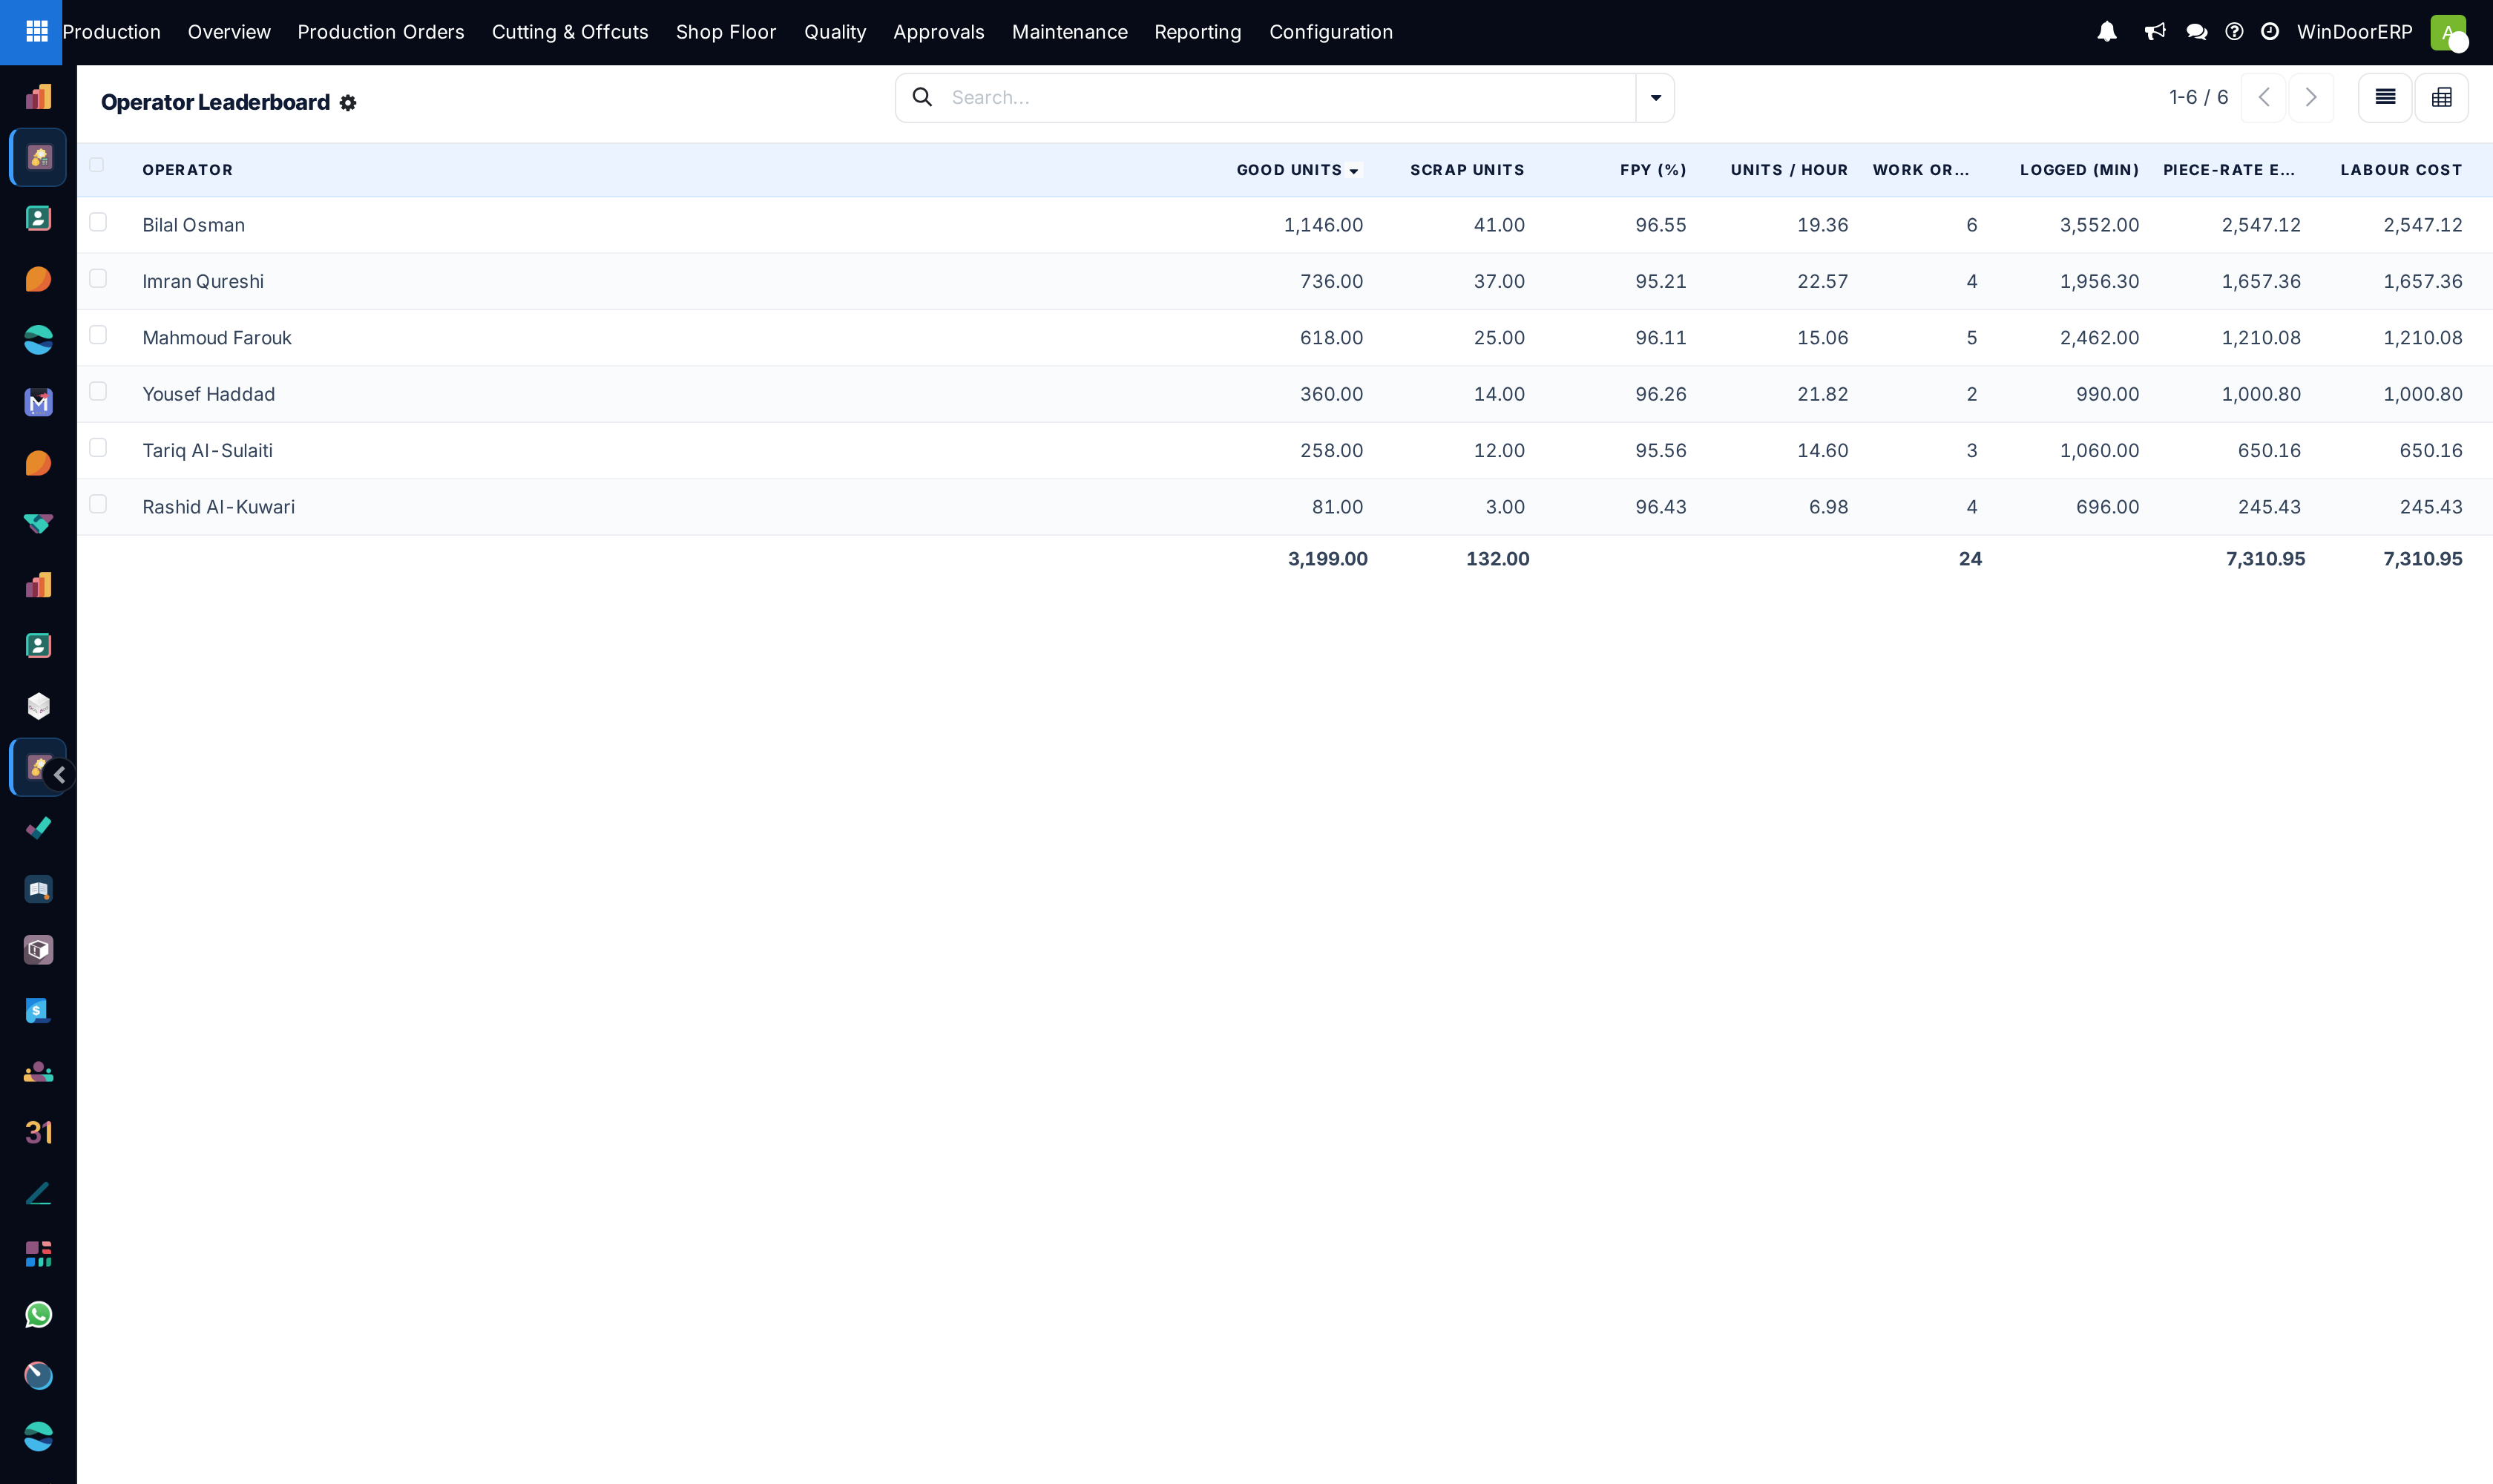
Production › Shop Floor › Operator Leaderboard aggregates every labour log into one row per operator: units produced, scrap, first-pass yield, throughput, minutes logged, piece-rate earnings and labour cost. Sorted by output it reads as the shop-floor leaderboard; pivoted, it is a diagnostic on the process — which station consumes the most labour per finished unit, and why. Read it the second way first: the numbers rank stretches of logged work, not the worth of people.
Before you start
- The Work Orders & Routing feature is on and labour logs are flowing from the terminal — the leaderboard is computed entirely from them.
- Good and scrap counts are being reported honestly at the station; yield is only as truthful as the counts.
Reading it
-
01
Open the leaderboard. It arrives sorted by Good Units, with column totals for units, scrap, work orders, earnings and cost.
-
02
Read FPY (%) next to the output — a high producer with a low first-pass yield is making rework, not windows.
-
03
Read Units / Hour for pace, remembering it blends whatever mix of operations each operator logged.
-
04
Switch to the Pivot to cross output, scrap and throughput per operator — and take questions, not conclusions, back to the floor.
-
05
For the money side, Piece-Rate Earnings and Labour Cost per operator reconcile against the payroll batches from the labour topic.
What each column means
| Column | Computed as |
|---|---|
| Good Units / Scrap Units | Sums of what the operator's logs reported. |
| FPY (%) | Good over good-plus-scrap — the share made right first time. |
| Units / Hour | Good units over logged hours. |
| Work Orders / Logged (min) | How many distinct orders the operator touched, and the minutes behind them. |
| Piece-Rate Earnings / Labour Cost | The money the logs priced — piece earnings alone, and the full time-plus-piece cost. |
The board is a read-only aggregation over all logged history — there is no built-in week or month window, so period questions belong in the labour analysis pivot, filtered by date, rather than here. It also knows nothing a log does not: an operator whose work is not logged simply is not on it.
Using it well
The honest uses are comparative and procedural: spotting the station whose throughput lags its peers, the operator whose yield says the training did not land, the scrap pattern that follows one machine rather than one person. Pair it with the operator skills matrix — a low number from a Trainee on a hard station is a schedule finding, not a person finding. The dishonest use — monthly bonuses read straight off the ranking — teaches the floor to game the counts within a week.
Troubleshooting
The menu is missing — the Work Orders & Routing feature is off; the leaderboard exists only inside that layer.
An operator is absent from the board — no labour log carries their name; check they clock in as themselves rather than under a colleague's badge.
Numbers look inflated for one person — check for hand-typed logs alongside terminal ones, and whether their logs carry another station's easy operations.
The board disagrees with the payroll batch — the board sums all history while a batch froze one period; compare periods in the labour analysis, not here.
Common mistakes
- Publishing the ranking as a wall chart without the yield column — output alone rewards speed over quality within days.
- Comparing operators across different stations as if the work were the same.
- Reading the all-history totals as "this month" — the board has no period filter.
Was this article helpful?
Thanks — your feedback helps.
Running a window or door factory?
Ask for a demo