Measure salespeople — after you add the filter this screen leaves off
What this does
Sales Analysis By Salespersons is the Sales Analysis report grouped by salesperson, so you land on one row per person. It is the screen used for pipeline reviews and for anything that touches how a sales team is measured.
Because it is used that way, the one thing you must know about it is what it counts — and by default it counts more than sales.
Before you start
- Like the Customers menu and unlike the Sales and Products menus, this one does not apply the Sales Orders filter. Everything quoted is counted.
- The salesperson comes from the order, not from the line, so every line of an order is attributed to the same person.
- Graph and pivot only; no list view here.
Steps
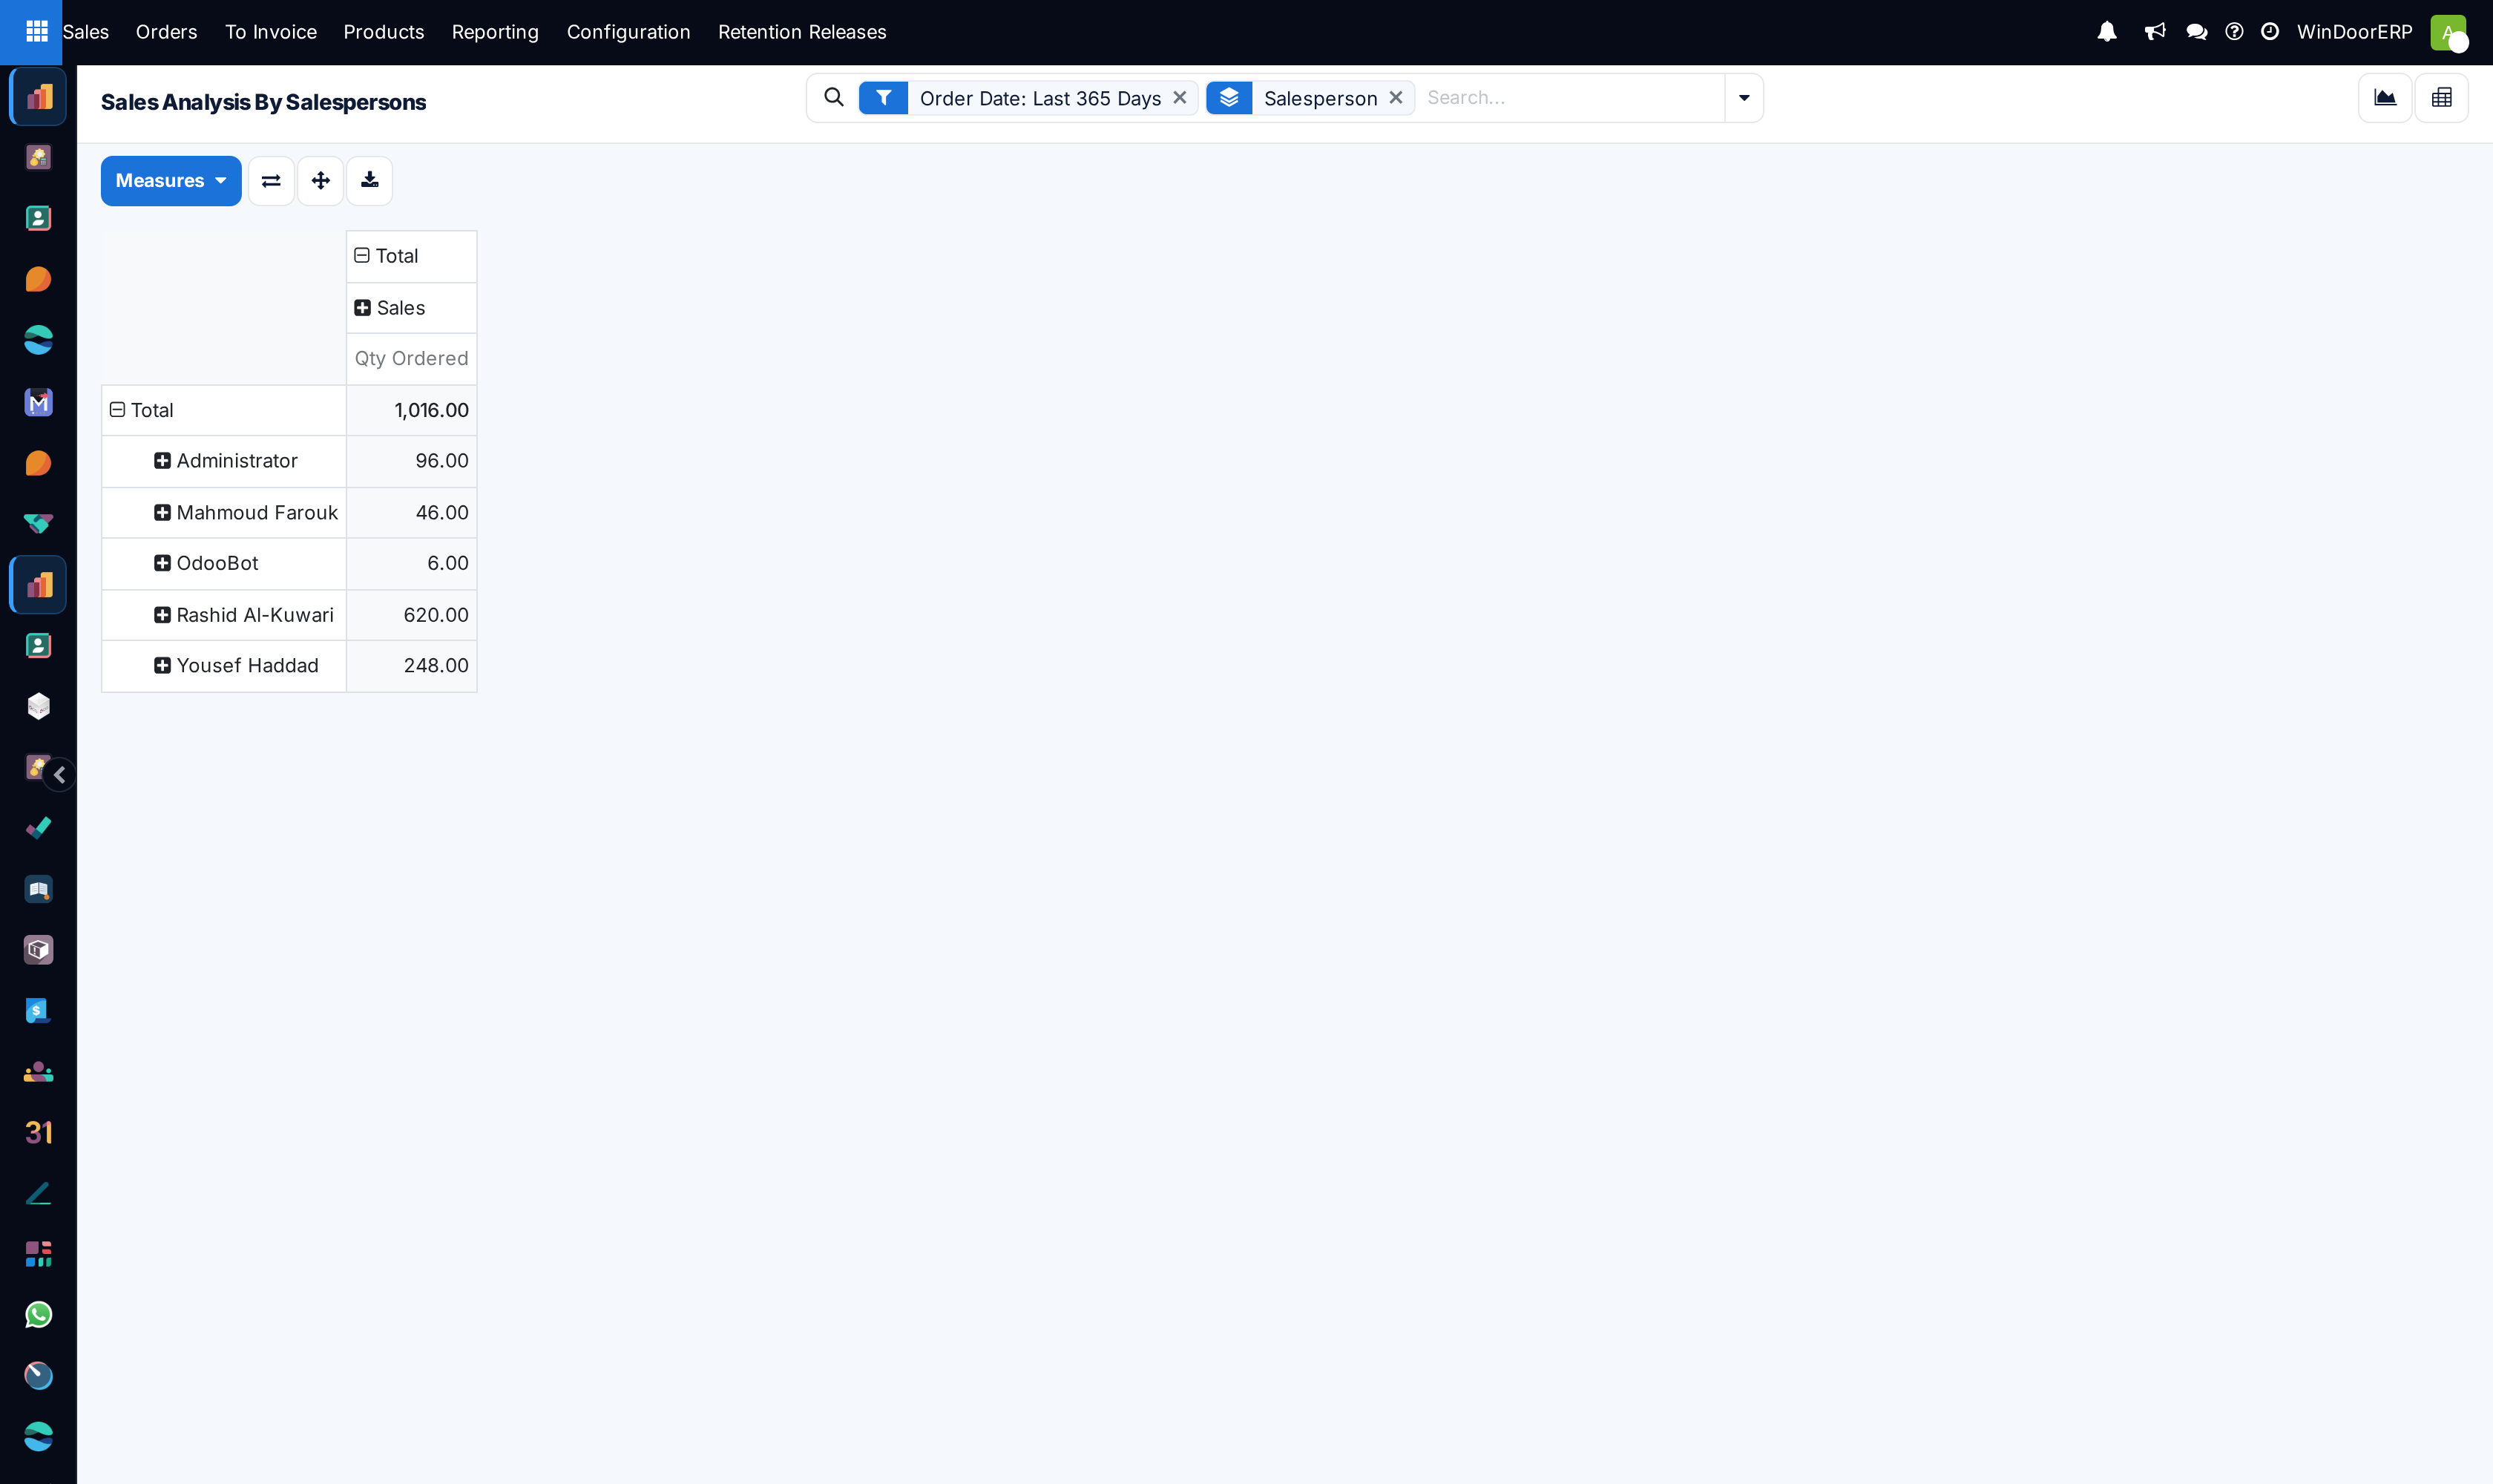
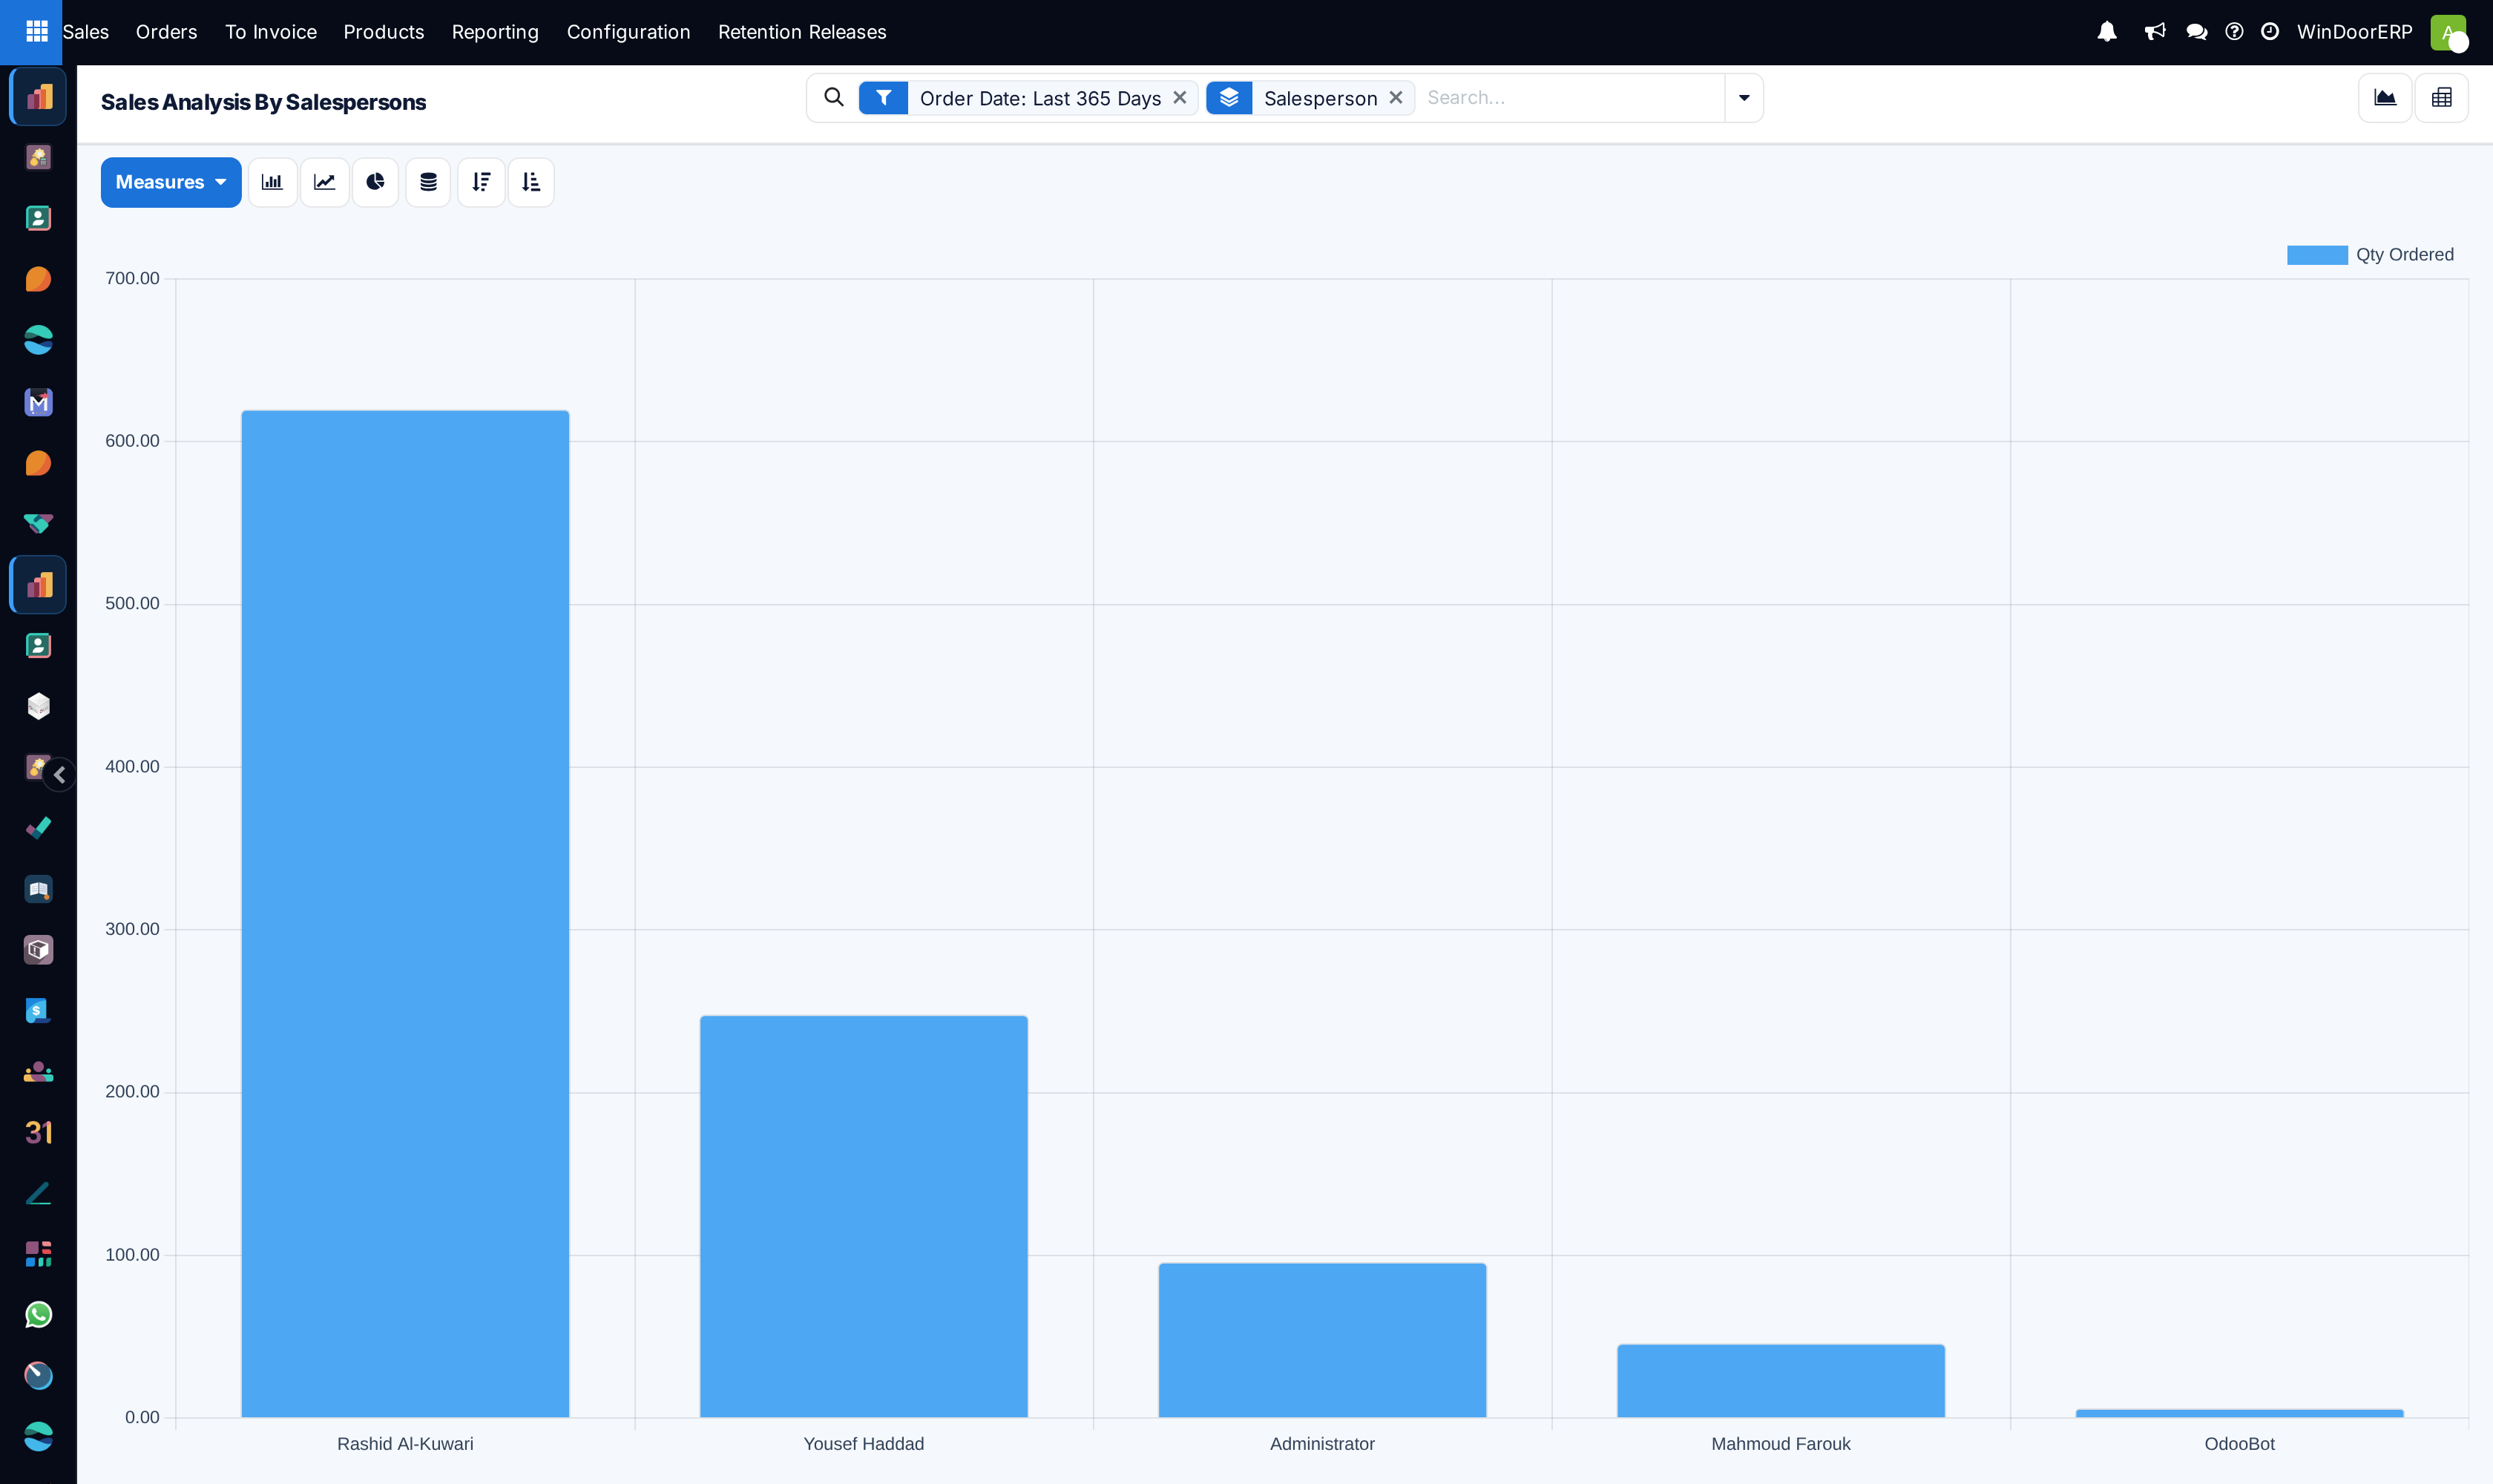
By default this measures quoting, not selling
The search bar here carries only Order Date: Last 365 Days and the salesperson grouping. The Sales Orders filter that excludes quotations, sent quotations and cancelled orders is not applied.
On the demonstration data the difference is 991 against 2,864 for the same period and measure. A person who quotes prolifically and closes little therefore looks like the top performer on this screen as it opens.
Never use this menu for a performance conversation without adding the Sales Orders filter first. It is one click, and it changes who is at the top.
-
01
Open Sales › Reporting › Salespersons.
-
02
Add the Sales Orders filter before reading anything as performance. This is the step people skip.
-
03
Switch the measure to Untaxed Total — a person's value matters more than their line count.
-
04
Add Order Date as a second grouping to see a person's trend rather than a single number.
-
05
Group by Sales Team instead to compare teams rather than individuals.
How a line is attributed
The salesperson is a field on the order, so all of an order's lines carry the same person. Reassigning an order moves its whole history to the new owner — there is no record here of who held it when the work was done.
Orders raised without an explicit salesperson fall to whoever created them, which is why an administrator account often appears in this report with a real figure beside it. That is a data-entry artefact, not a person's performance.
Useful second groupings
| Sales Team | Compares teams rather than individuals, which is usually the fairer unit. |
|---|---|
| Order Date | A trend per person; a single total hides whether someone is improving. |
| Status | Splits each person's figure into quotations, orders and cancellations — the clearest way to see the effect of the missing filter. |
| Customer | Which accounts each person actually works. |
| Product Category | Whether someone sells services alongside fabrication. |
Troubleshooting
| Someone's figure looks impossibly high | Quotations are being counted. Add the Sales Orders filter. |
|---|---|
| An administrator or bot account appears | Orders created without a salesperson default to their creator. |
| A departed colleague still shows figures | Attribution follows the order's current salesperson. Reassigning their orders moves the history too. |
| Totals disagree with Reporting › Sales | That menu applies the Sales Orders filter; this one does not. |
| There is no list view | Correct — graph and pivot only. |
Common mistakes
- Holding a performance review on this screen as it opens, with quotations counted as sales.
- Ranking on Qty Ordered, which mixes units.
- Reading an administrator row as a person's results.
- Comparing one person's total against a figure someone else took from a differently filtered menu.
Was this article helpful?
Thanks — your feedback helps.
Running a window or door factory?
Ask for a demo