What sells by product — and why it cannot tell one window from another
What this does
Sales Analysis By Products is the Sales Analysis report opened with the product grouping applied, so you land on one row per product. It answers what sells, in what volume, and at what value.
In a fenestration catalogue it answers that question well for services and poorly for windows — for a reason worth understanding before you rely on it.
Before you start
- Unlike the Customers and Salespersons menus, this one does apply the Sales Orders filter, so it shows confirmed orders only. Its totals are comparable with Reporting › Sales and not with the other two.
- Quantities here mix units freely — square metres, linear metres and pieces in one column. Read the warning below before summing anything.
- Graph and pivot only; there is no list view on this menu.
Steps
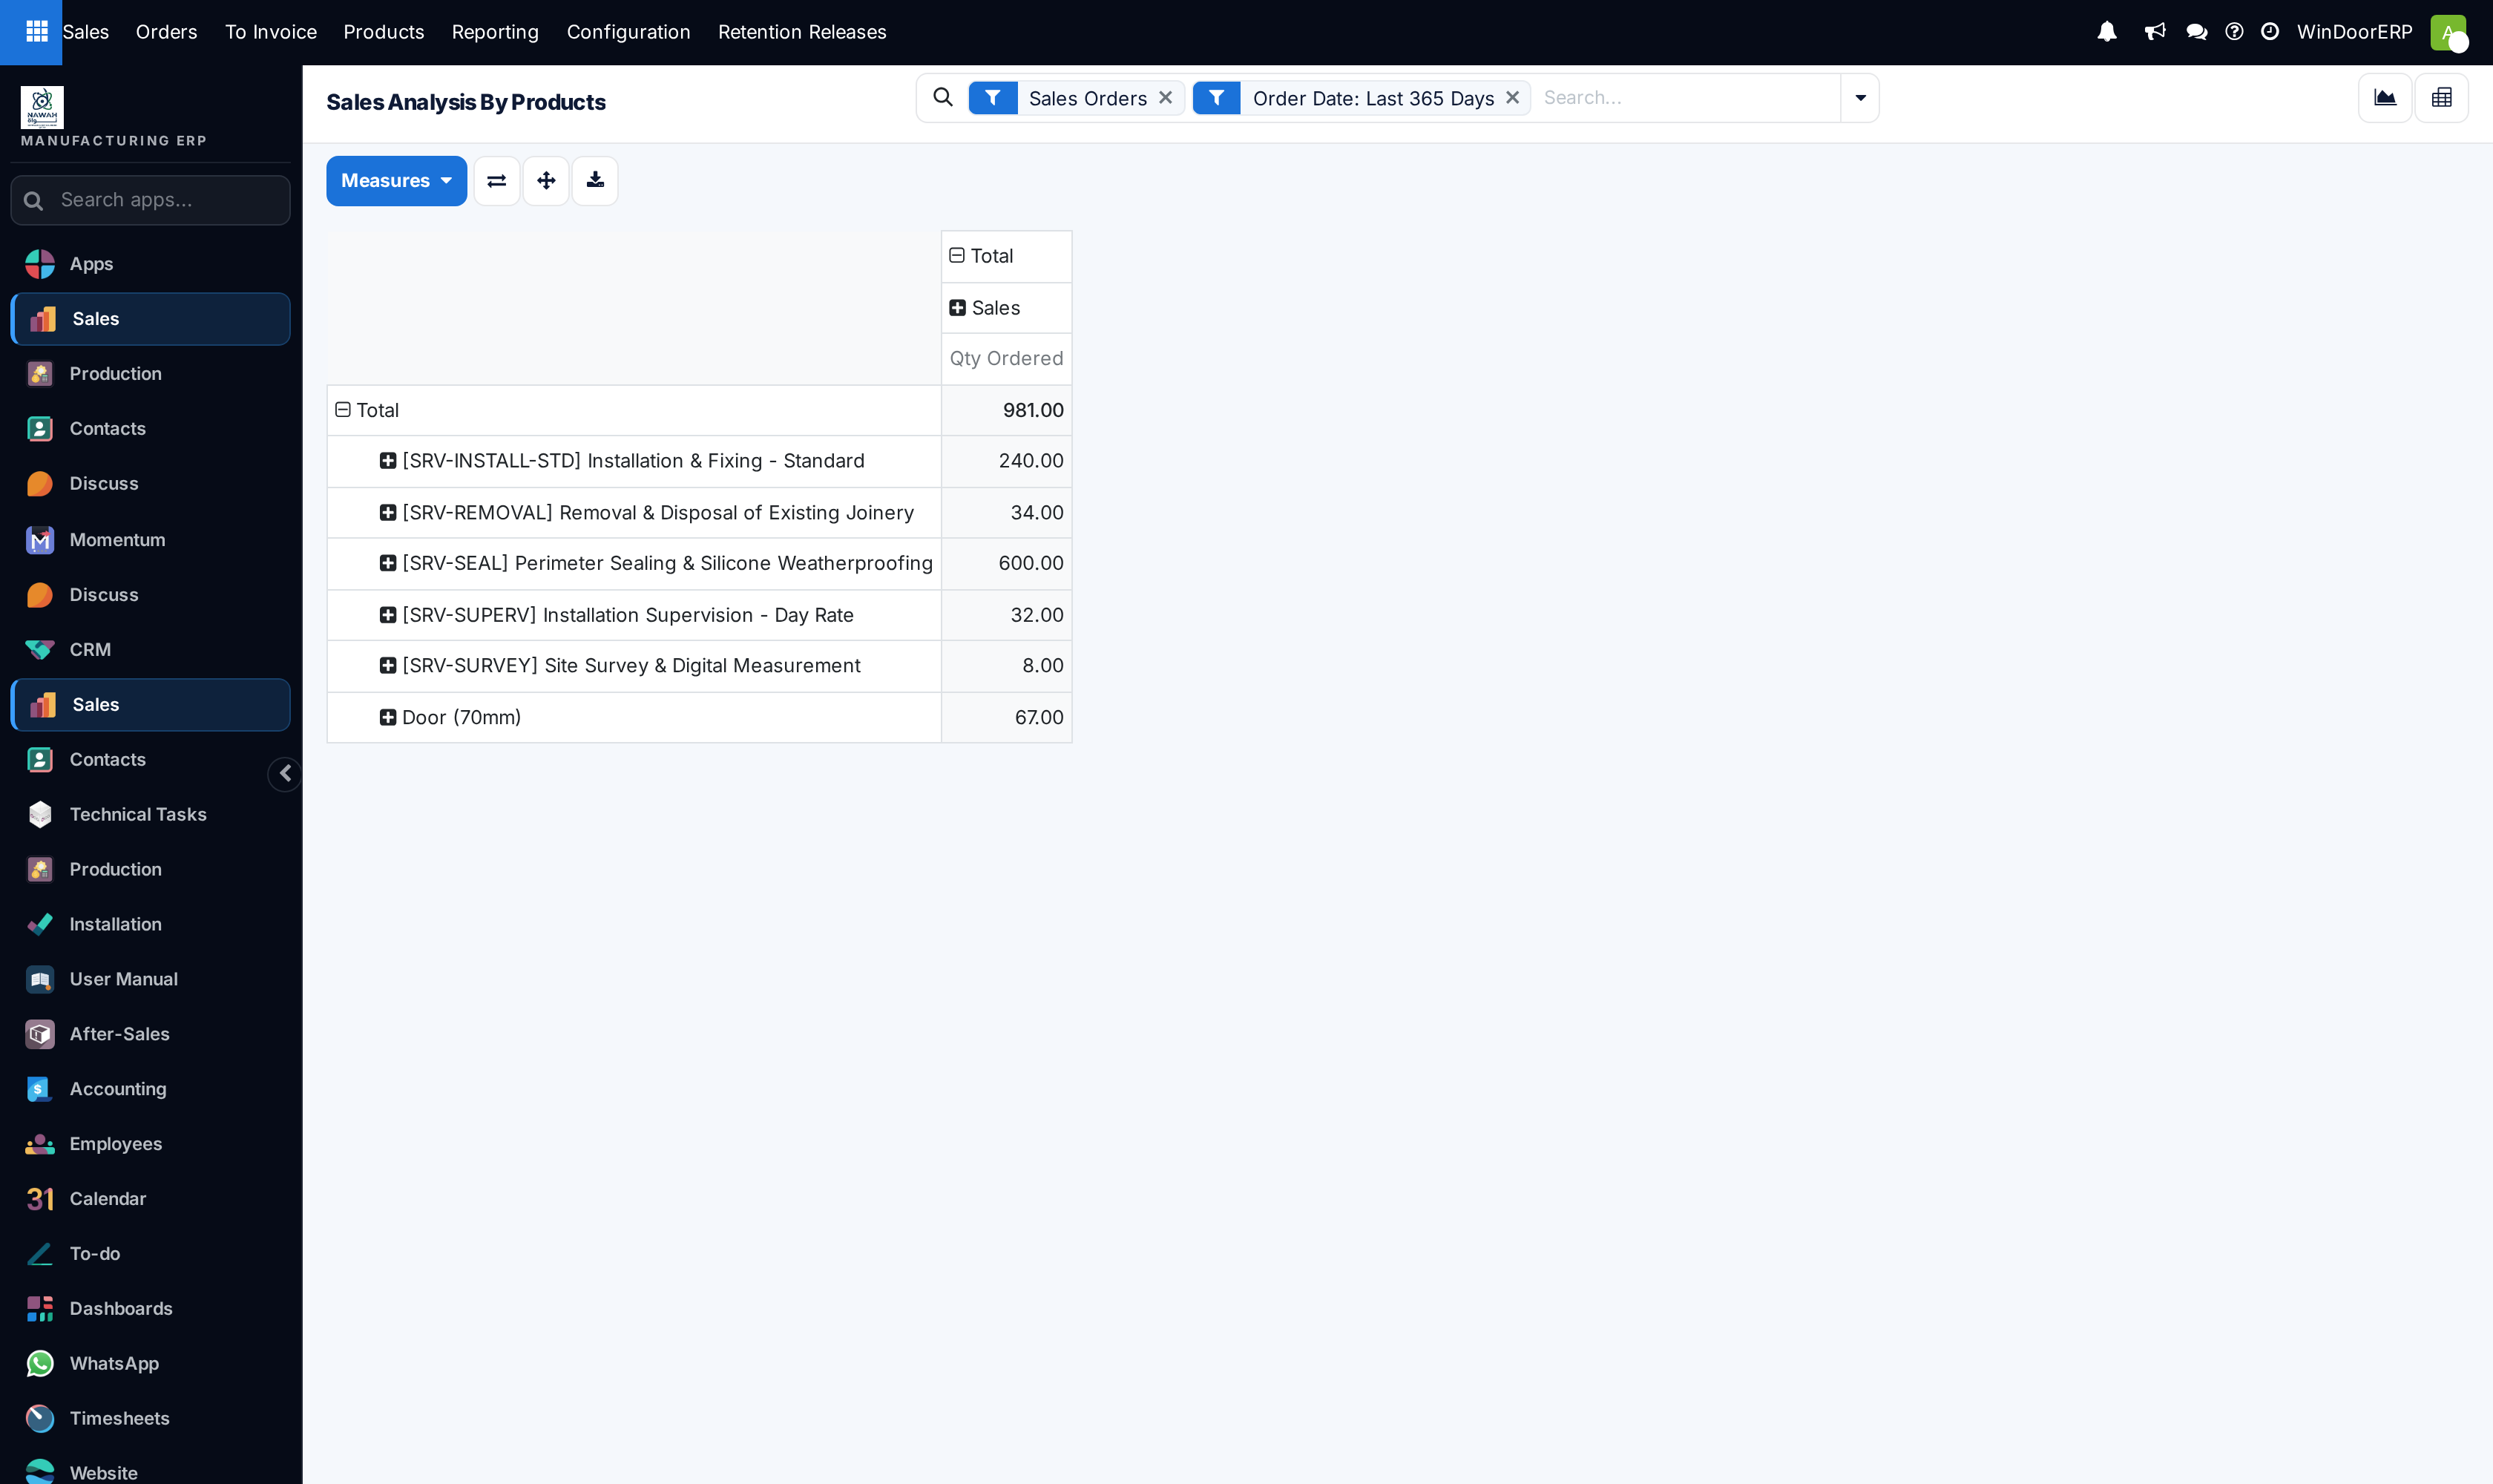
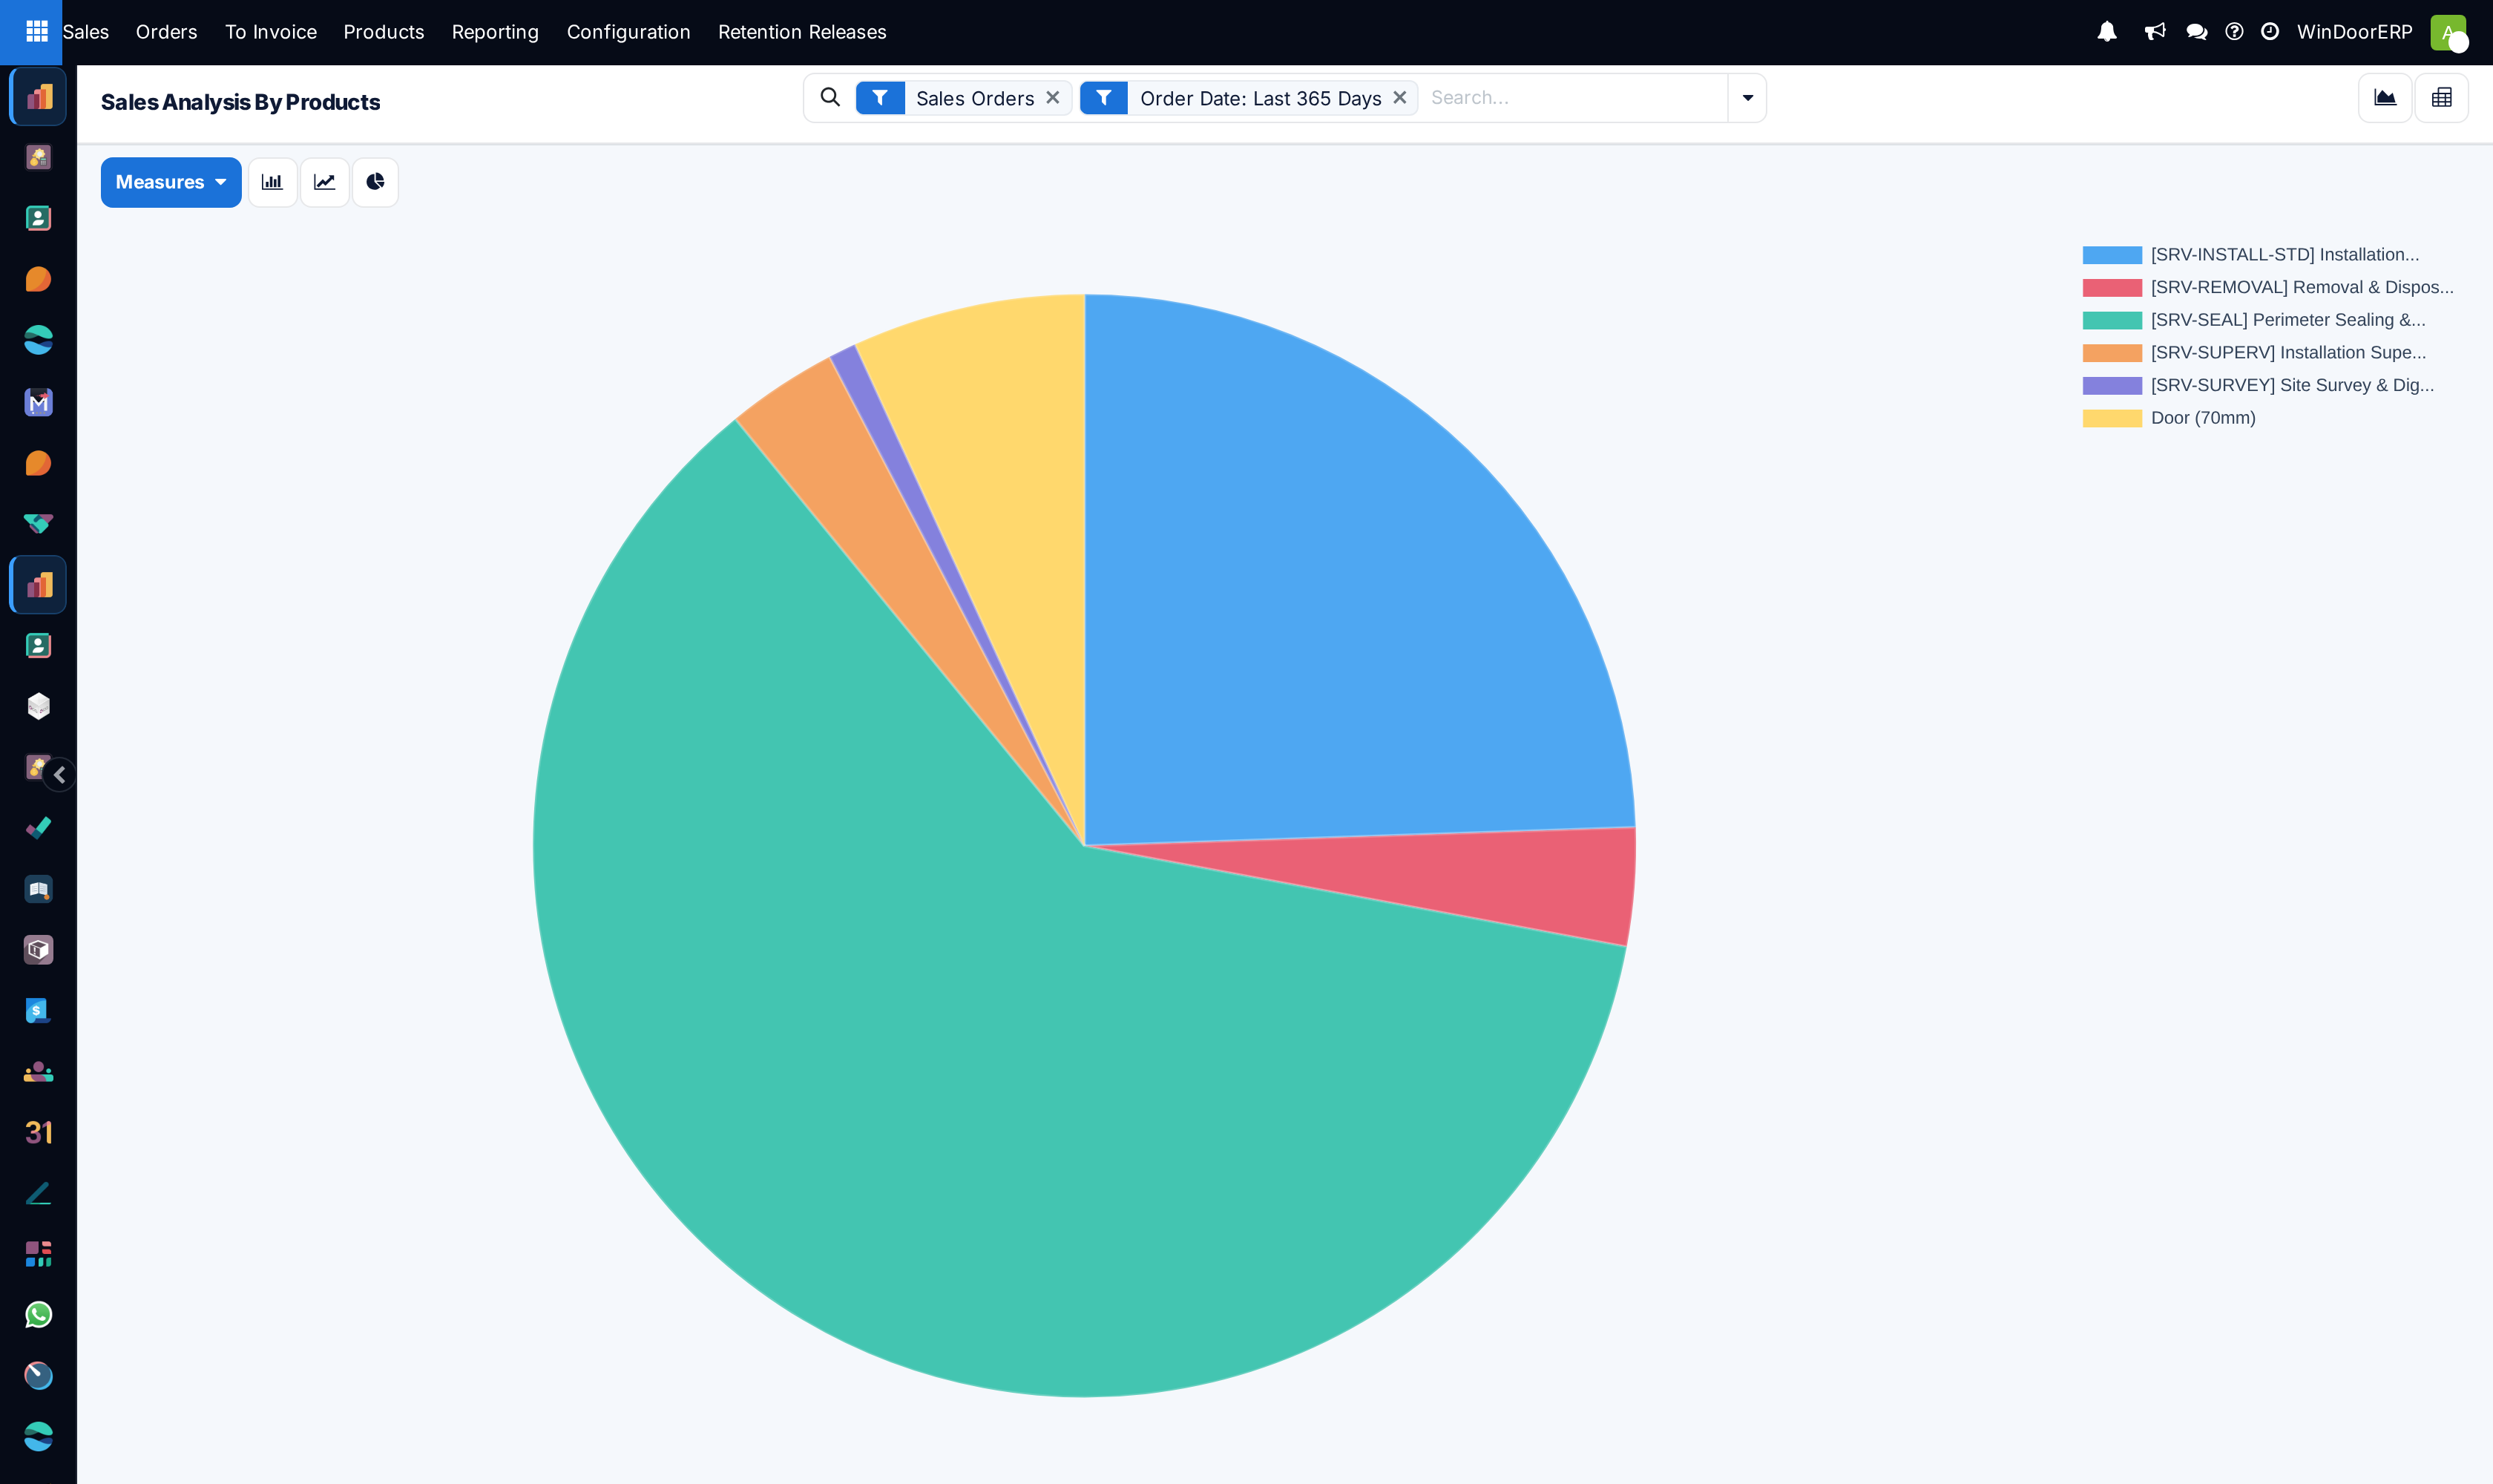
Every window is the same product, so this report cannot tell them apart
WindoorERP quotes made-to-measure work against a small number of generic products and puts the specification in the line description and the design. On the demonstration data, 36 of the 41 fabricated lines sit under just two products — Door (70mm) and Door (60mm).
So a product ranking shows a couple of enormous generic rows and a handful of precise service rows. It cannot tell you whether tilt-and-turn outsold sliding, or which profile series is most popular, because that distinction was never stored on the product.
For questions about what kind of window sells, the answer is in the designs and their analyses, not here. This report is reliable for services, for bought-in goods, and for total value — not for the shape of the window mix.
-
01
Open Sales › Reporting › Products.
-
02
Switch the measure from Qty Ordered to Untaxed Total if you want value rather than volume.
-
03
Group additionally by Product Category to separate fabricated goods from services in one view.
-
04
Add Order Date as a second grouping for a trend per product.
-
05
Switch to the pivot and use the download button when the figures are going into a report.
Quantities across mixed units
The quantity column adds whatever unit each line uses. On the demonstration data that means 600 linear metres of sealing, 240 square metres of installation and 74 pieces of window are added into one meaningless number.
Two ways round it. Group by Unit so each unit gets its own row, or stop using quantity and switch the measure to Untaxed Total, which is denominated in money and therefore adds up.
Product versus Product Variant
Both groupings exist. Product is the catalogue item; Product Variant is the specific combination of its attributes. On this fleet no product carries attributes, so every product has exactly one variant and the two groupings give identical results. They will diverge the day variants are actually used.
Troubleshooting
| Two rows dominate everything | They are the generic fabricated products. Expected — see the note above. |
|---|---|
| The quantity total is nonsense | Units are being added across unit types. Group by Unit, or measure value instead. |
| Totals disagree with the Customers menu | That menu does not apply the Sales Orders filter and this one does. Compare like with like. |
| A product is missing entirely | It was only ever quoted, never confirmed — and the Sales Orders filter excludes quotations here. |
| Grouping by variant changes nothing | No product carries attributes yet, so each has a single variant. |
Common mistakes
- Trying to read the window mix from this report. The product does not carry the specification.
- Summing a quantity column that spans metres and pieces.
- Comparing its totals against the Customers or Salespersons menus, which start from a different filter set.
- Concluding a profile series is unpopular because it does not appear — series are not products.
Was this article helpful?
Thanks — your feedback helps.
Running a window or door factory?
Ask for a demo