Work the Quotations list: its filters, its seven views, and what the pivot really counts
What this does
Sales › Orders › Quotations is the screen a salesperson lives on. This article is about working it as a book rather than one record at a time: the filters it opens with, the seven views behind the switcher at the top right, and what the pivot and the graph on this menu genuinely count — which is not what the words "quotation pipeline" usually lead people to expect.
It is worth separating from its two neighbours. Sales › Orders › Orders is the same model with a different search view and a different default chip, covered in its own article. Sales › Reporting runs on a different model altogether — one row per order line — and has its own defaults. The three disagree by design, and most arguments about sales numbers come from comparing readings taken on two of them.
Before you start
- The menu opens with My Quotations already applied. Every count, total and chart on this screen is your own work until you remove that chip.
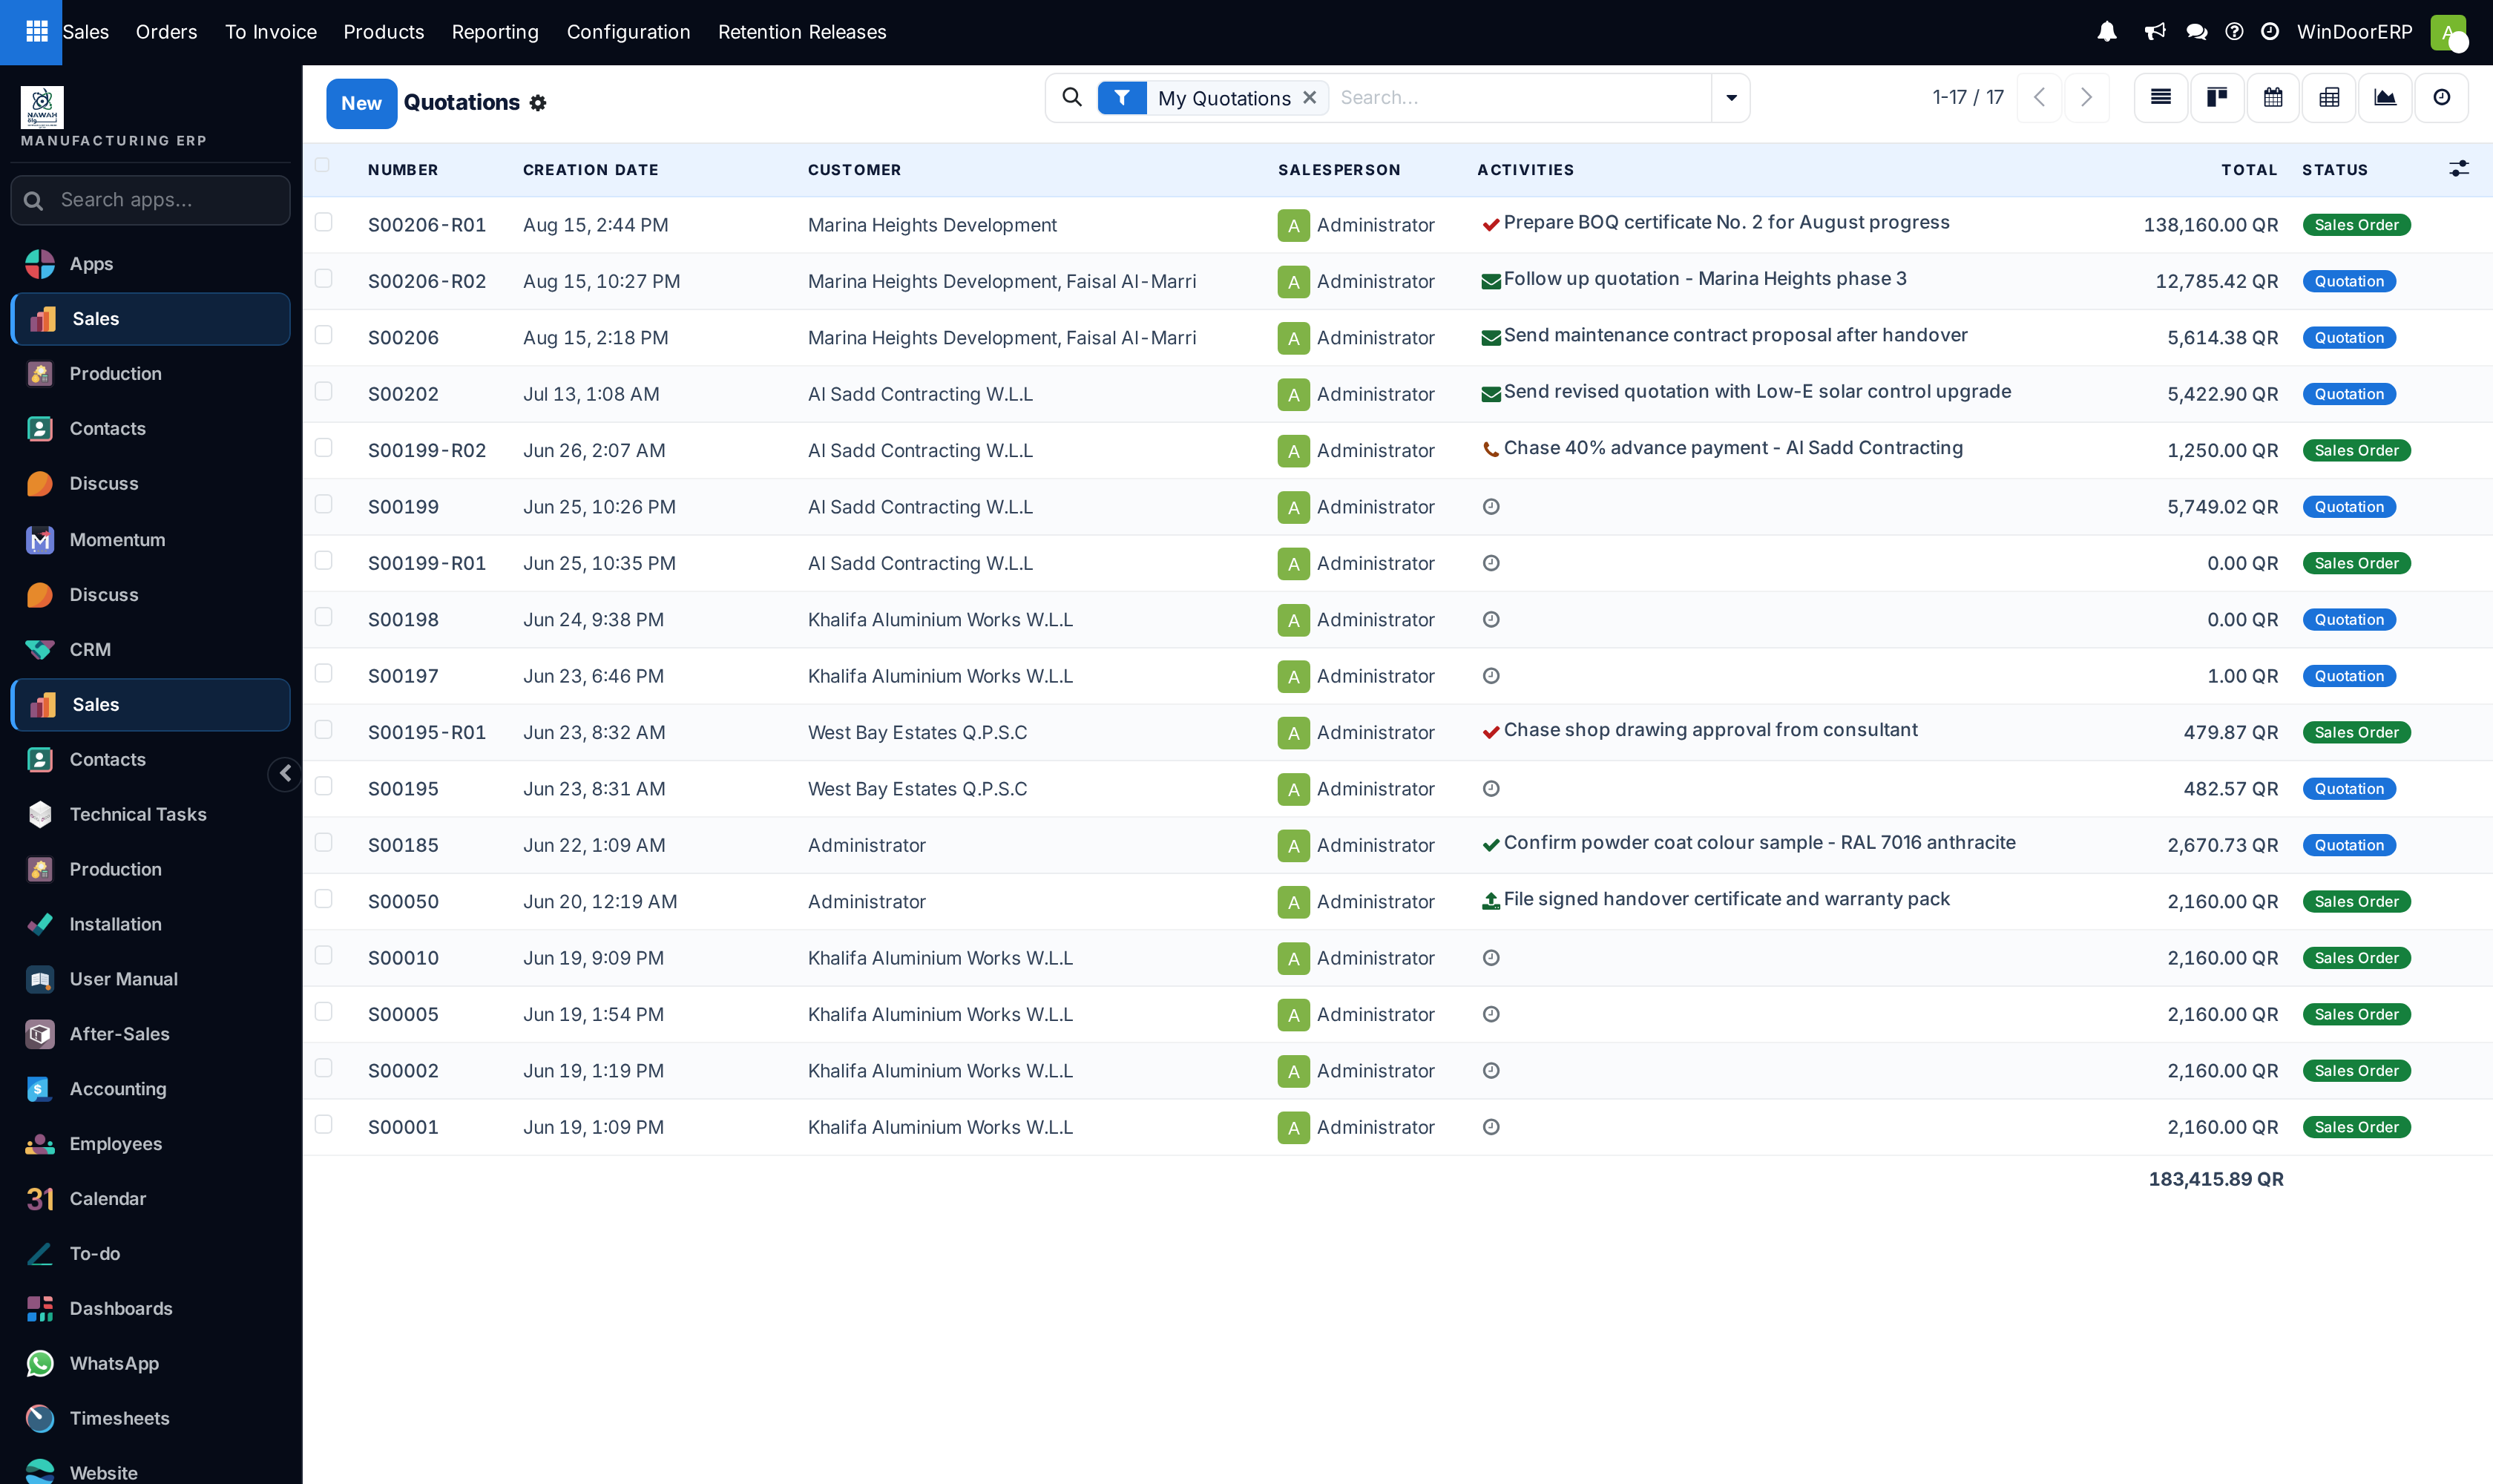
- Despite the menu name, the list is not restricted to quotations. It carries confirmed sales orders too — the Quotation and Sales Order badges in the Status column are both normal here.
- A row is one order. Counting rows counts deals, not openings and not lines. For anything per product or per opening, use Sales Analysis.
- Variation orders sit in the list beside the contracts they vary. Total the list without excluding them and the same scope is counted twice.
Steps
-
01
Open Sales › Orders › Quotations. Note the My Quotations chip in the search bar and decide whether you want it; remove it to see the team's book.
-
02
Add Filters ▸ Quotations to cut the list down to offers only — draft and sent — or Sales Orders to see confirmed contracts only.
-
03
Add Filters ▸ Main Orders Only before you total anything, so variation orders are not counted alongside their parent contracts.
-
04
Use Group By ▸ Salesperson or Customer to fold the list into sub-totals without leaving the list view.
-
05
Switch to pivot for the numbers laid out as a grid, and open Measures before you read anything — the view opens on one measure and it is the tax-inclusive total.
-
06
Switch to graph for the same figures as bars, then change the grouping if you want a trend; it does not open as one.
-
07
Export what you need with the download button beside Measures in the pivot, which writes the grid as it stands to a spreadsheet.
The search panel on this menu
This menu has its own search view, which is why its filters differ from the ones on Orders. Typing in the box searches the order reference, the customer reference and the customer name at once.
| Filter | What it selects |
|---|---|
| My Quotations | Orders where you are the salesperson. Applied automatically when the menu opens. |
| Quotations | State is Quotation or Quotation Sent. This is the filter that makes the screen live up to its name. |
| Sales Orders | State is exactly Sales Order. Cancelled orders are excluded by it, and by the Quotations filter too, so neither chip ever shows them — remove both to see cancellations. |
| Create Date | The only date filter offered, and it is the record's creation date, not the order date. The list's date column is Creation Date for the same reason. |
| Main Orders Only / Variation Orders Only | Splits contracts from their variations. Use the first before totalling. |
The Group By list offers Salesperson, Customer, Order Date and Payment Method — and nothing else. There is no group-by for status, so the obvious way to compare quotations against orders is not offered here; add Status as a column and sort, or use the two filters in turn. Beyond the filters, the panel also lets you search by Salesperson, Sales Team, Product, Project, Campaign, Activities of and Activity type.
Seven views, and what each is for
| View | What it gives you |
|---|---|
| List | The default. Number, Creation Date, Customer, Salesperson, Activities, Total and Status, with a grand total at the foot. Expiration, Client Order Ref, Tags and several others are available from the ⚙ column toggle at the right of the header. |
| Kanban | The same records as cards, with the activity clock on each. |
| Calendar | Plots the next activity deadline, not the order date and not the expiry. Orders with no activity do not appear, and nothing can be created from it. |
| Pivot | The grid, described below. |
| Graph | The chart, described below. |
| Activity | Orders down the side against activity types across the top, colour-coded by how late each is. |
| Form | One order, opened from any of the above. |
The pivot: one row per order, one measure to start with
The pivot opens with Order Date grouped by month down the rows, nothing across the columns, and a single measure, Total. That measure is the tax-inclusive order total, and its grand total will match the sum at the foot of the list exactly — a useful check, and a trap if you quote it as revenue.
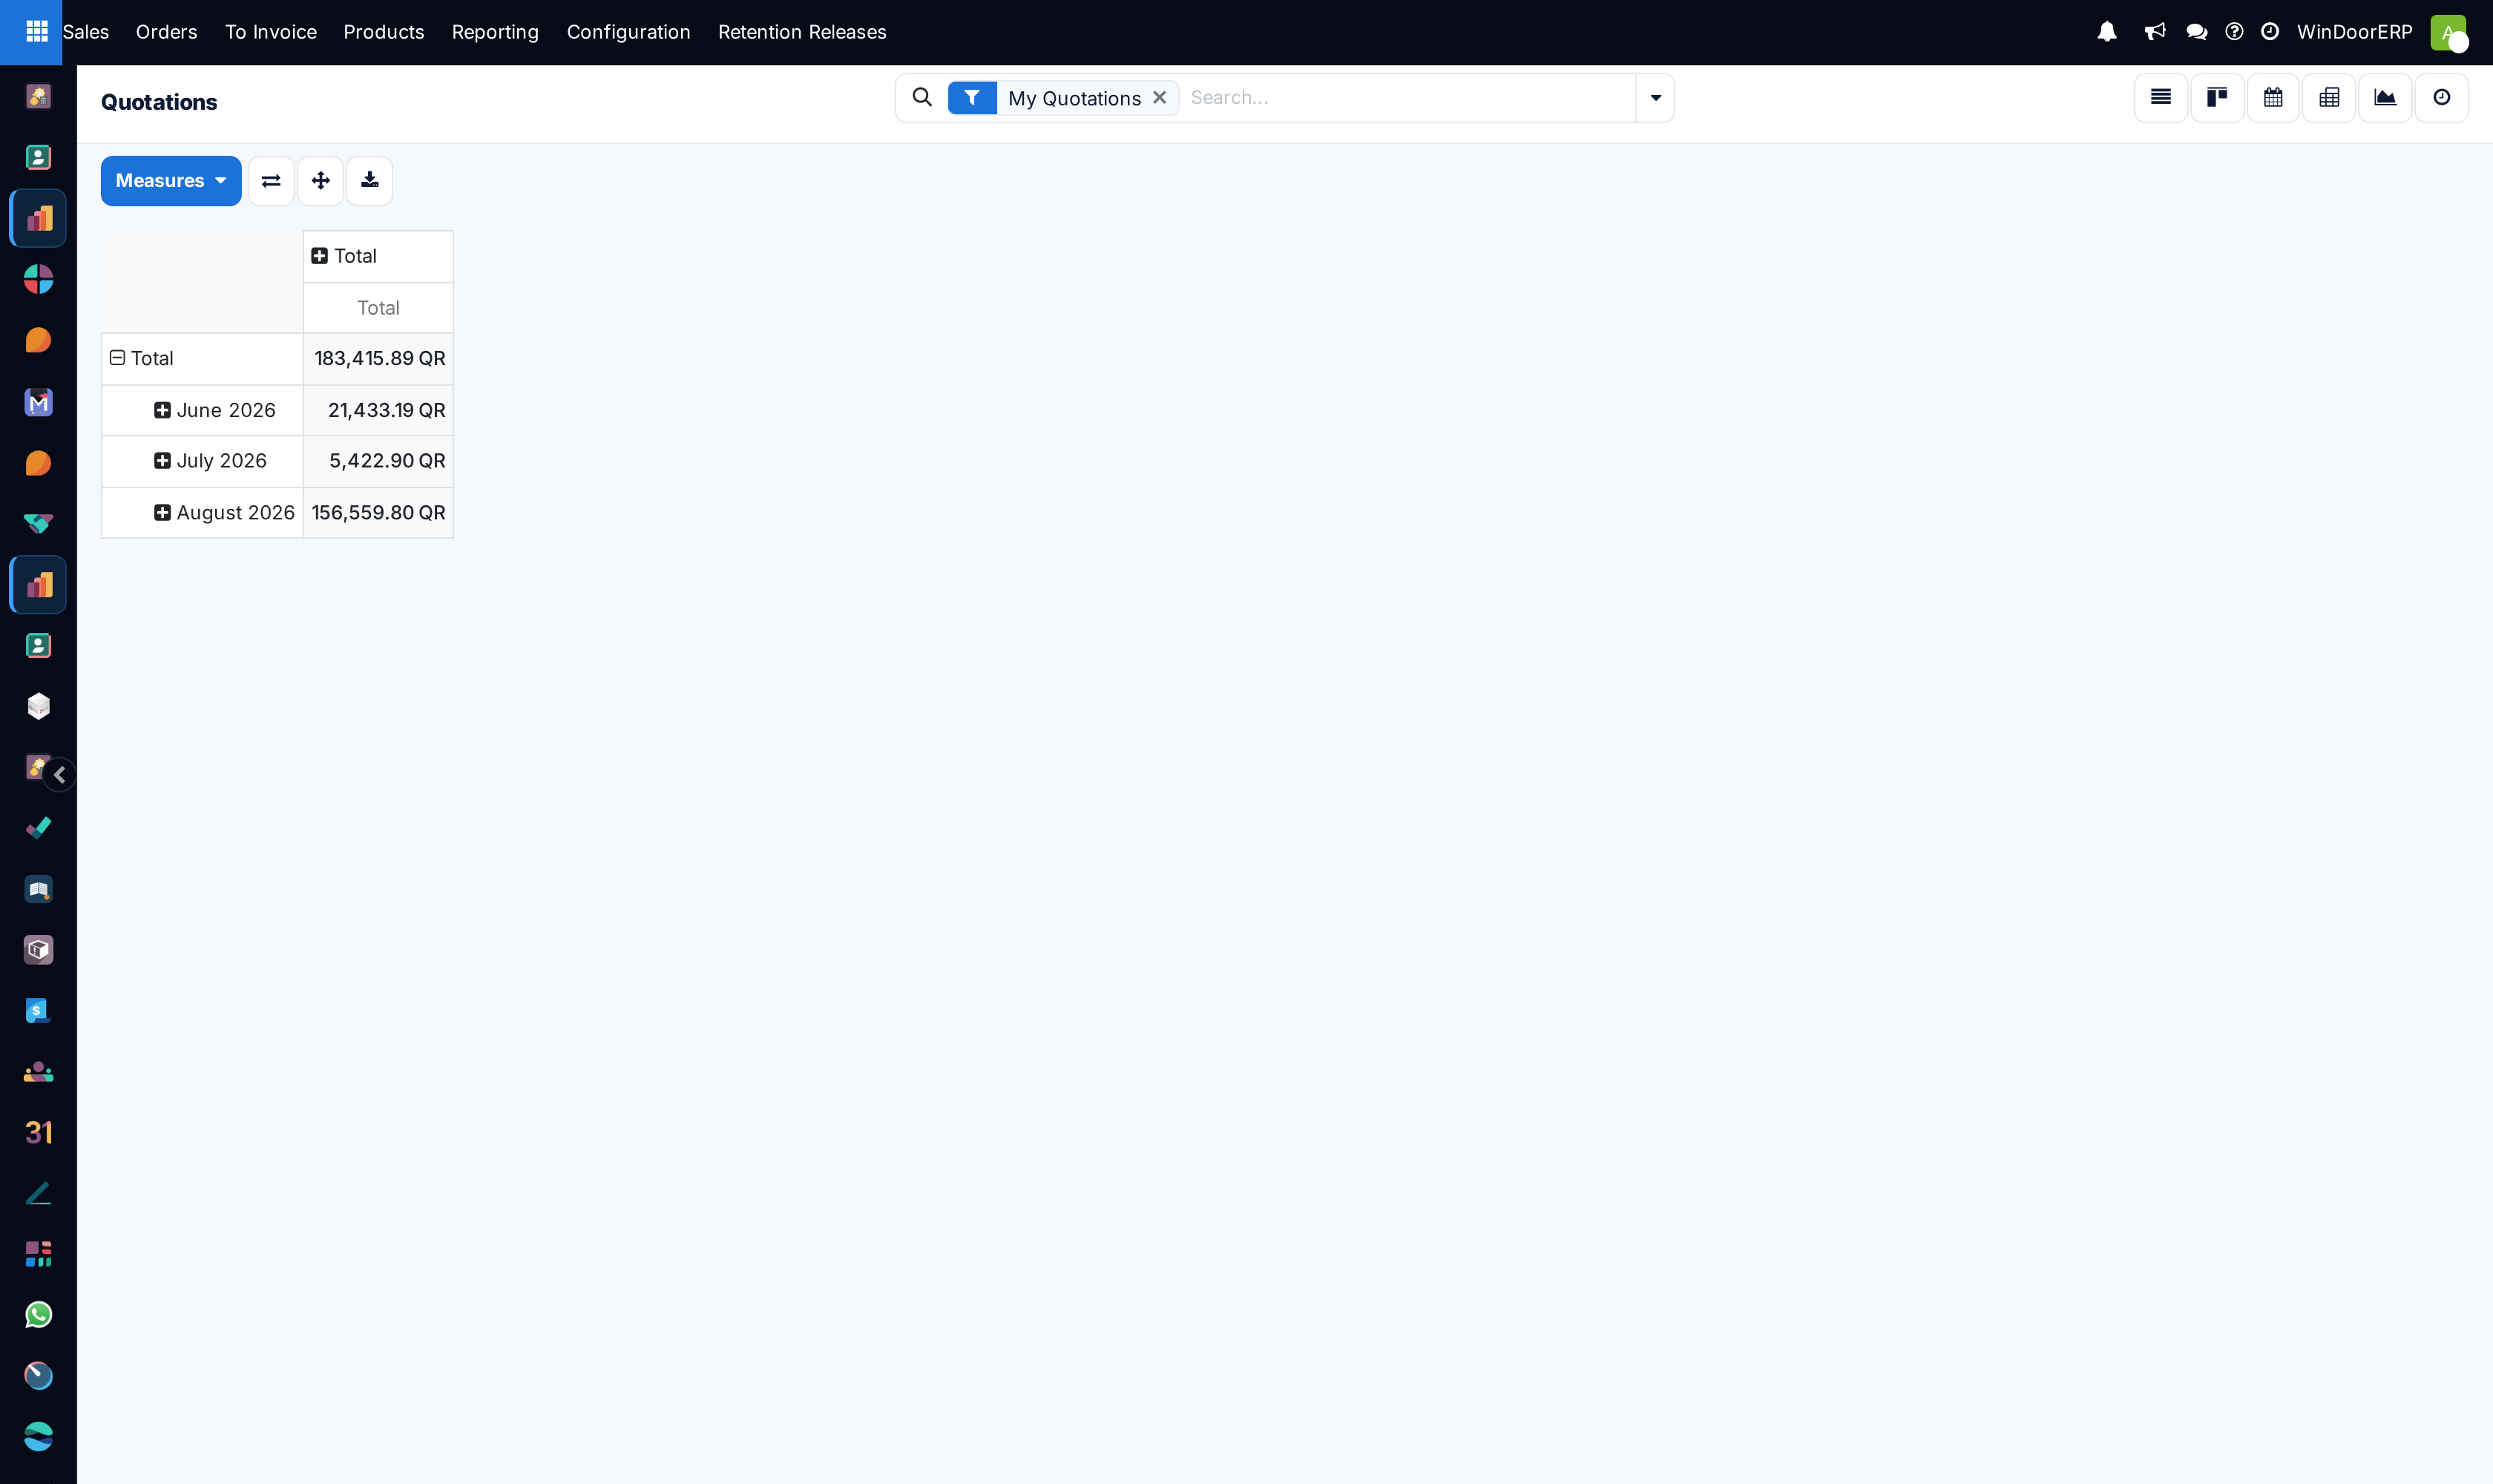
Click a row header to expand it by any field — Customer, Salesperson, Sales Team, Status. The toolbar beside Measures flips the axes, expands every level at once, and downloads the grid to a spreadsheet.
| Measure | What it is |
|---|---|
| Total | The order total including tax. The default, and the one people quote by mistake. |
| Untaxed Amount | The order total before tax. This is what most reports mean by the value of the offer. |
| Taxes | The tax portion. Rarely useful on its own; useful to prove why two readings differ. |
| Count | Number of orders. The only volume measure on this screen, and the one to use for win rates. |
| Everything else in the menu | The list is built from the order's stored numeric fields, so it also offers technical values such as Currency Rate, Prepayment percentage, Revision Number and even Delivery Latitude. They are summable and meaningless. Do not read a total of them. |
The graph: bars per customer, not a trend
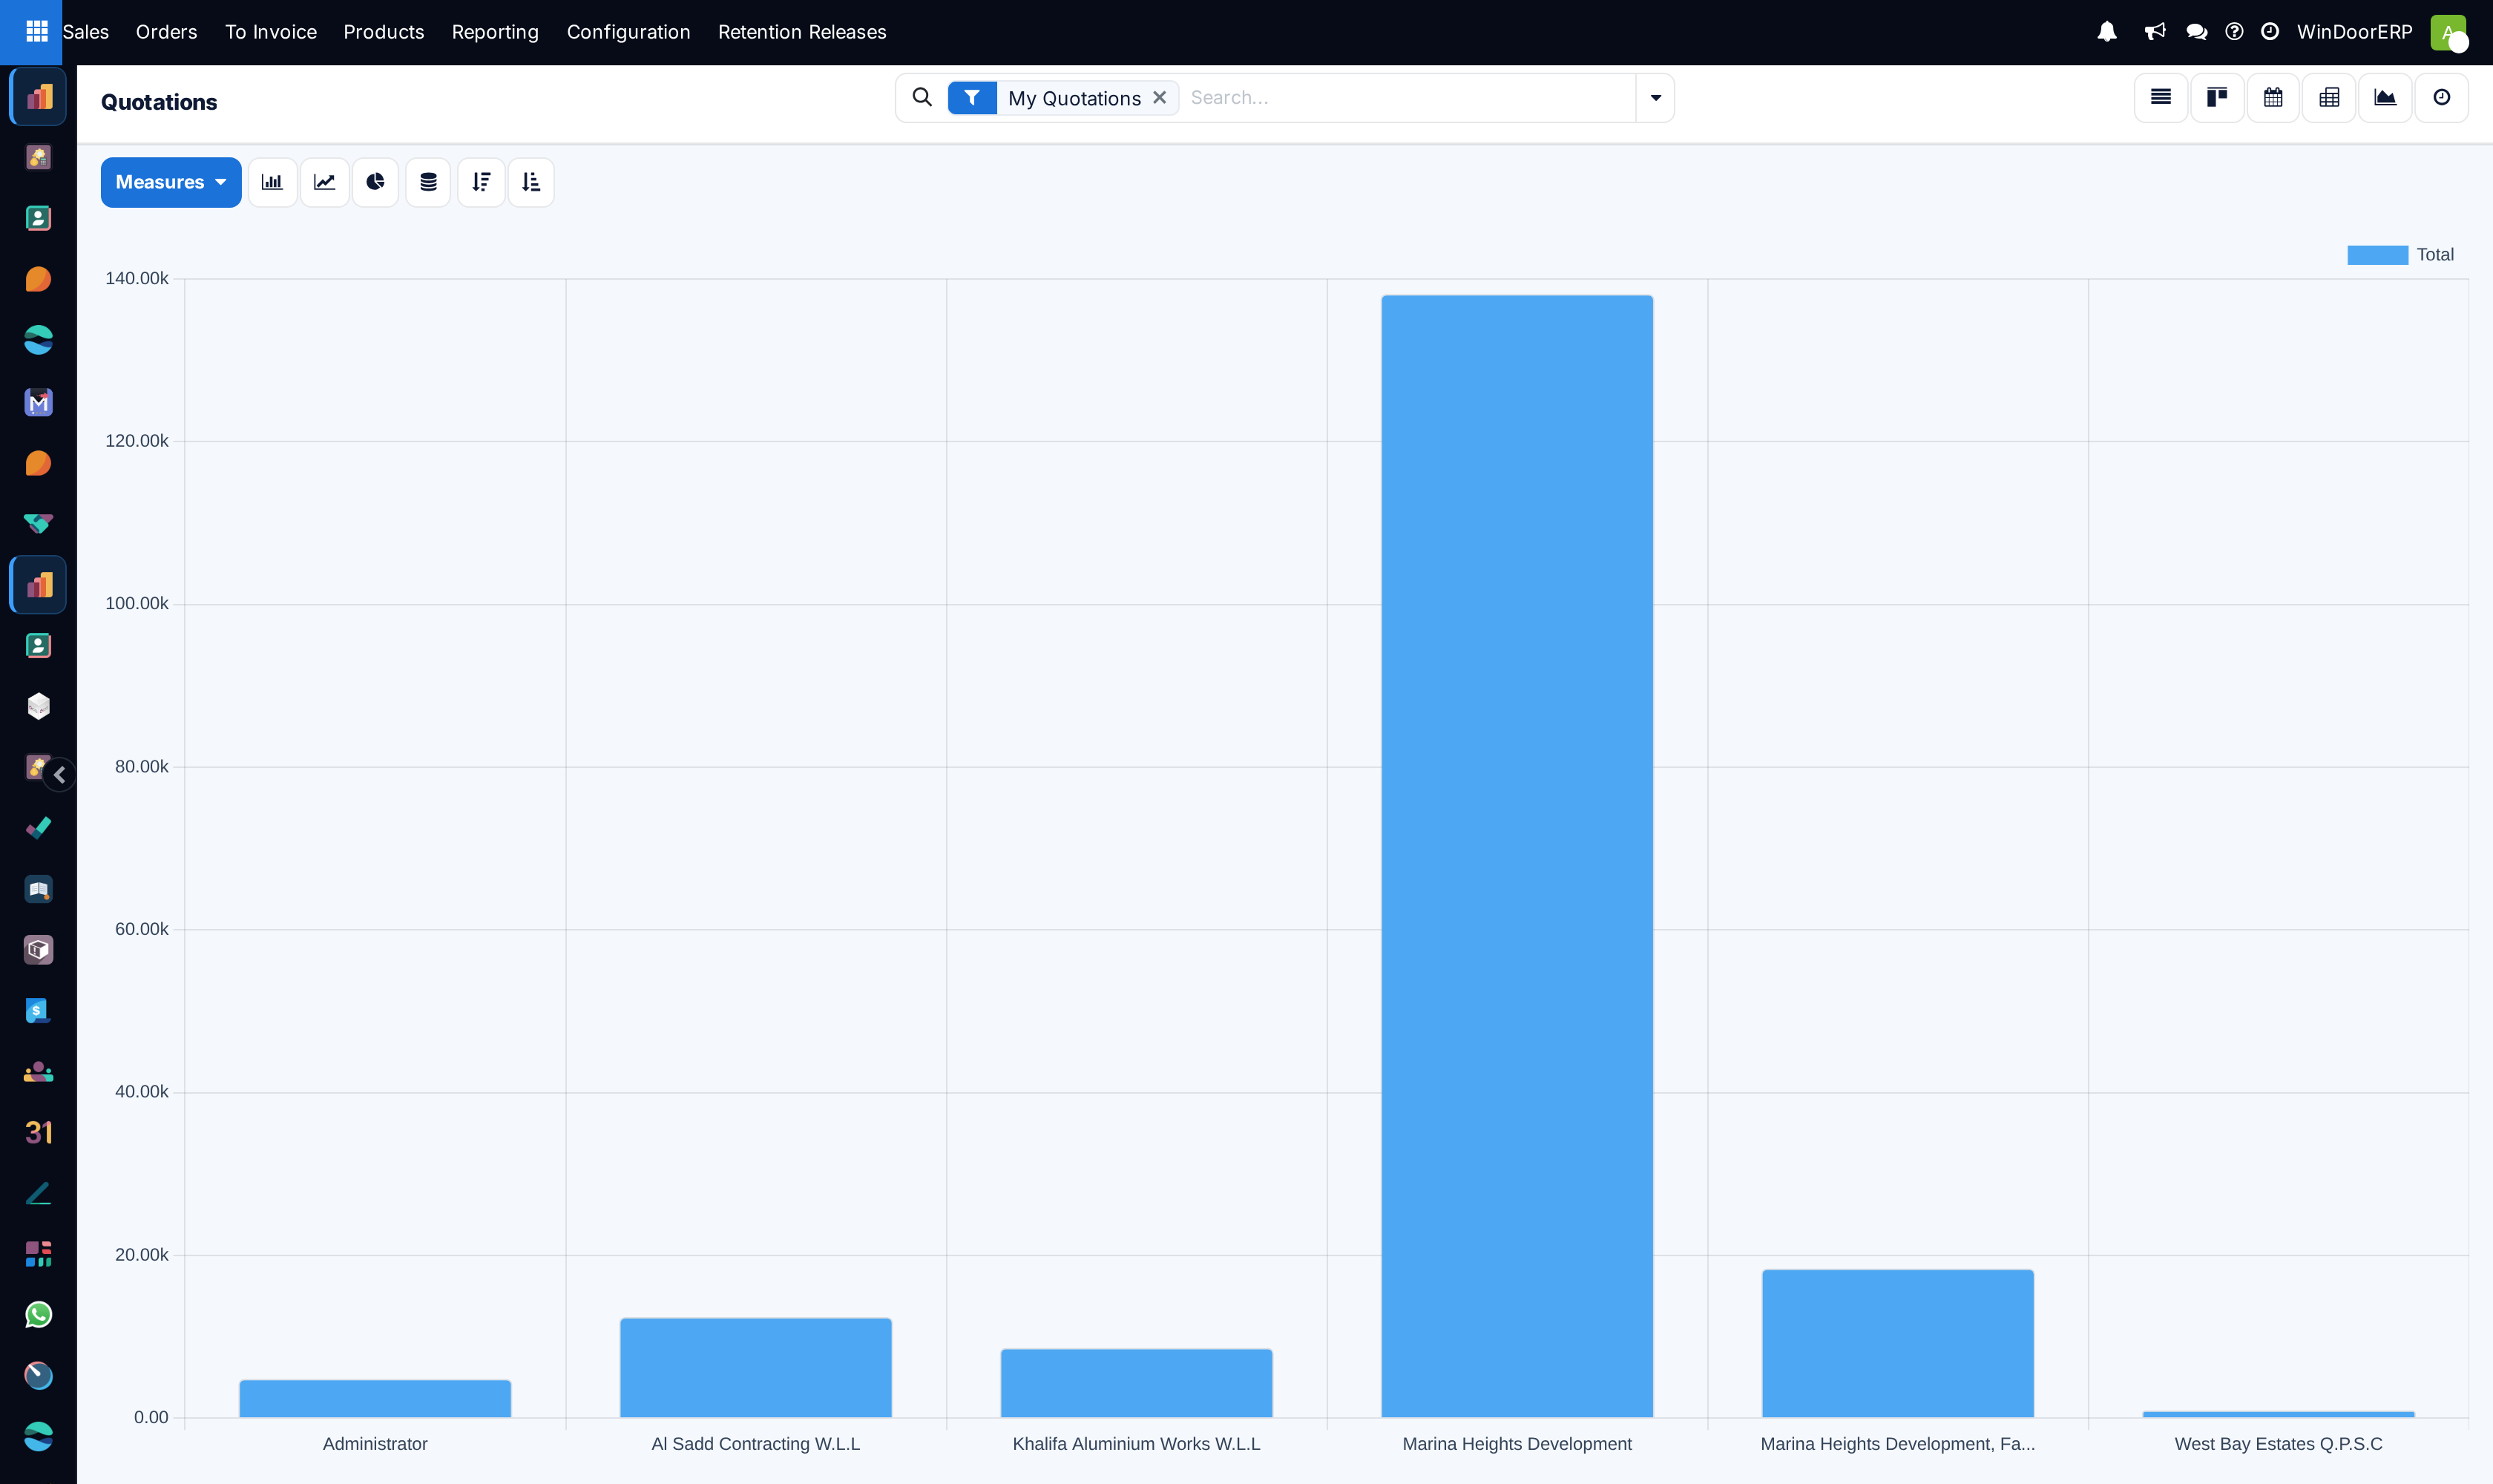
The graph opens as a bar chart of Total grouped by Customer. It is not a time series: a single tall bar is one large contract, not a good month. To make it a trend, change the grouping to Order Date and pick the line chart from the toolbar, which also offers a pie, stacking, and ascending or descending sort.
Measuring conversion honestly
There is no conversion measure anywhere in the Sales app — no win rate, no average days-to-close, no stage velocity. Sales orders have no stages and no probability; those belong to the CRM pipeline, which is where a real funnel lives. What this screen can give you is a defensible approximation, built from two readings.
- Remove My Quotations if you want the team, and add Main Orders Only.
- Apply Filters ▸ Quotations, set the pivot measure to Count and to Untaxed Amount, and write both numbers down.
- Swap the filter for Sales Orders, leave everything else alone, and read the same two numbers.
- Compare. The second over the first is your conversion by count and by value, for whatever period you had grouped.
Two caveats that matter. The two readings are snapshots of what things are now, not of what was quoted then, because a quotation that was confirmed no longer counts as a quotation. And the period is the order date, which for a confirmed order is the date it was confirmed. For a genuine cohort — what became of everything quoted in March — the pipeline reporting in CRM is the right tool, not this list.
This is not the Sales Analysis report
The pivot and graph here run on the orders themselves, one row per order, and honour whatever chips are in the search bar. Sales › Reporting › Sales runs on a separate reporting model, one row per order line, opens on a graph rather than a pivot, and arrives with two filters already applied that exclude quotations altogether. Do not expect the two to agree unless you have matched the filters deliberately. See Sales Analysis: measures, groupings and the two filters that are already on.
Three things this screen cannot show you
Each of these is a real capability that exists in the software and is switched off on this fleet. They are listed here because their absence is what sends people looking for a fault.
| Missing | Why, and what to do instead |
|---|---|
| Margin as a measure | Margins come from an optional module that is not installed here, so there is no margin field on an order and none in the Measures menu. The switch is Sales › Configuration › Settings ▸ Pricing ▸ Margins, described there as showing margins on orders, computed as sales price less the cost on each product's own form. Enabling it needs product costs to be maintained to be worth anything. Ask your administrator, and expect a conversation about costing first. |
| Discount % as a measure or a column | The per-line discount column is disabled for every user on this fleet, so no discount is ever recorded on a line and any discount figure would read zero. Negotiated reductions are handled by adjusting prices, or with Distribute Amount on the order. The switch is Settings ▸ Pricing ▸ Discounts. |
| A grid for entering variants | Variant Grid Entry — the module that lets you add many variants of one product to an order by typing quantities into a matrix of attributes — is not installed. Enabling it would add a Sales Variant Selection choice on each product's Variants tab, switch that product to a grid dialog on the order, and offer a developer-mode Print Variant Grids flag on the order. It also requires product variants to be turned on first, and they are not. It has nothing to do with the pivot table, despite both being called matrices. WindoorERP prices openings through the designer and the price engines instead, which is a better fit for made-to-measure work than a variant grid; the switch, if you ever need it, is Settings ▸ Product Catalog ▸ Variant Grid Entry. |
Troubleshooting
| What you see | Why, and what to do |
|---|---|
| Confirmed orders in a list called Quotations | The menu applies no state filter, only My Quotations. Add Filters ▸ Quotations. |
| The totals are much smaller than the team's | My Quotations is still applied. Remove the chip. |
| The pivot total does not match a Reporting figure | Different model, different filters, and this pivot's default measure includes tax. Switch to Untaxed Amount and match the filters before comparing. |
| Totals look roughly double | Variation orders are being counted next to their main contracts. Add Main Orders Only. |
| The graph shows no trend | It is grouped by customer, not by date. Change the grouping to Order Date and switch to the line chart. |
| The calendar is nearly empty | It plots activity deadlines, so only orders with a scheduled activity appear. |
| There is no Margin or Discount in Measures | Neither is enabled on this fleet. See the table above. |
| Grouping by status is not offered | The Group By list on this menu has four entries and status is not one of them. Add Status as a column and sort, or use the Quotations and Sales Orders filters in turn. |
Common mistakes
- Quoting the pivot's default Total as revenue. It includes tax.
- Reading a number off this screen with My Quotations still applied and presenting it as the team's.
- Totalling without Main Orders Only, so every variation is counted twice.
- Treating the bar chart as a monthly trend.
- Comparing this pivot with a Sales Analysis figure without matching the filters — different model, different rows, different defaults.
- Calculating a win rate from two readings taken weeks apart. Take both in the same sitting, with the same chips, or the difference measures your filters rather than your team.
See also
The line-level report and its two pre-applied filters are covered in Sales Analysis: measures, groupings and the two filters that are already on; the same views on the confirmed-orders menu are covered in Track order deadlines and fulfilment status — and what the calendar actually plots; the Expiration date and how to chase offers running out are covered in Quotation expiry: where the Expiration date comes from and what it actually blocks.
Was this article helpful?
Thanks — your feedback helps.
Running a window or door factory?
Ask for a demo