Analyse survey workload and area differences
What this does
Three saved analyses over your site surveys: how much area was surveyed and how it differed from what was ordered, how each surveyor's workload compares, and how survey volume moves month by month.
Before you start
- The Reporting menu is for survey managers — if you cannot see it, you do not have that role.
- All three reports open pre-filtered to Not Cancelled surveys. Everything else — draft, in progress, completed, approved — is included, so these are workload reports, not "finished work" reports.
Steps
-
01
Open Technical Tasks › Site Surveys › Reporting.
-
02
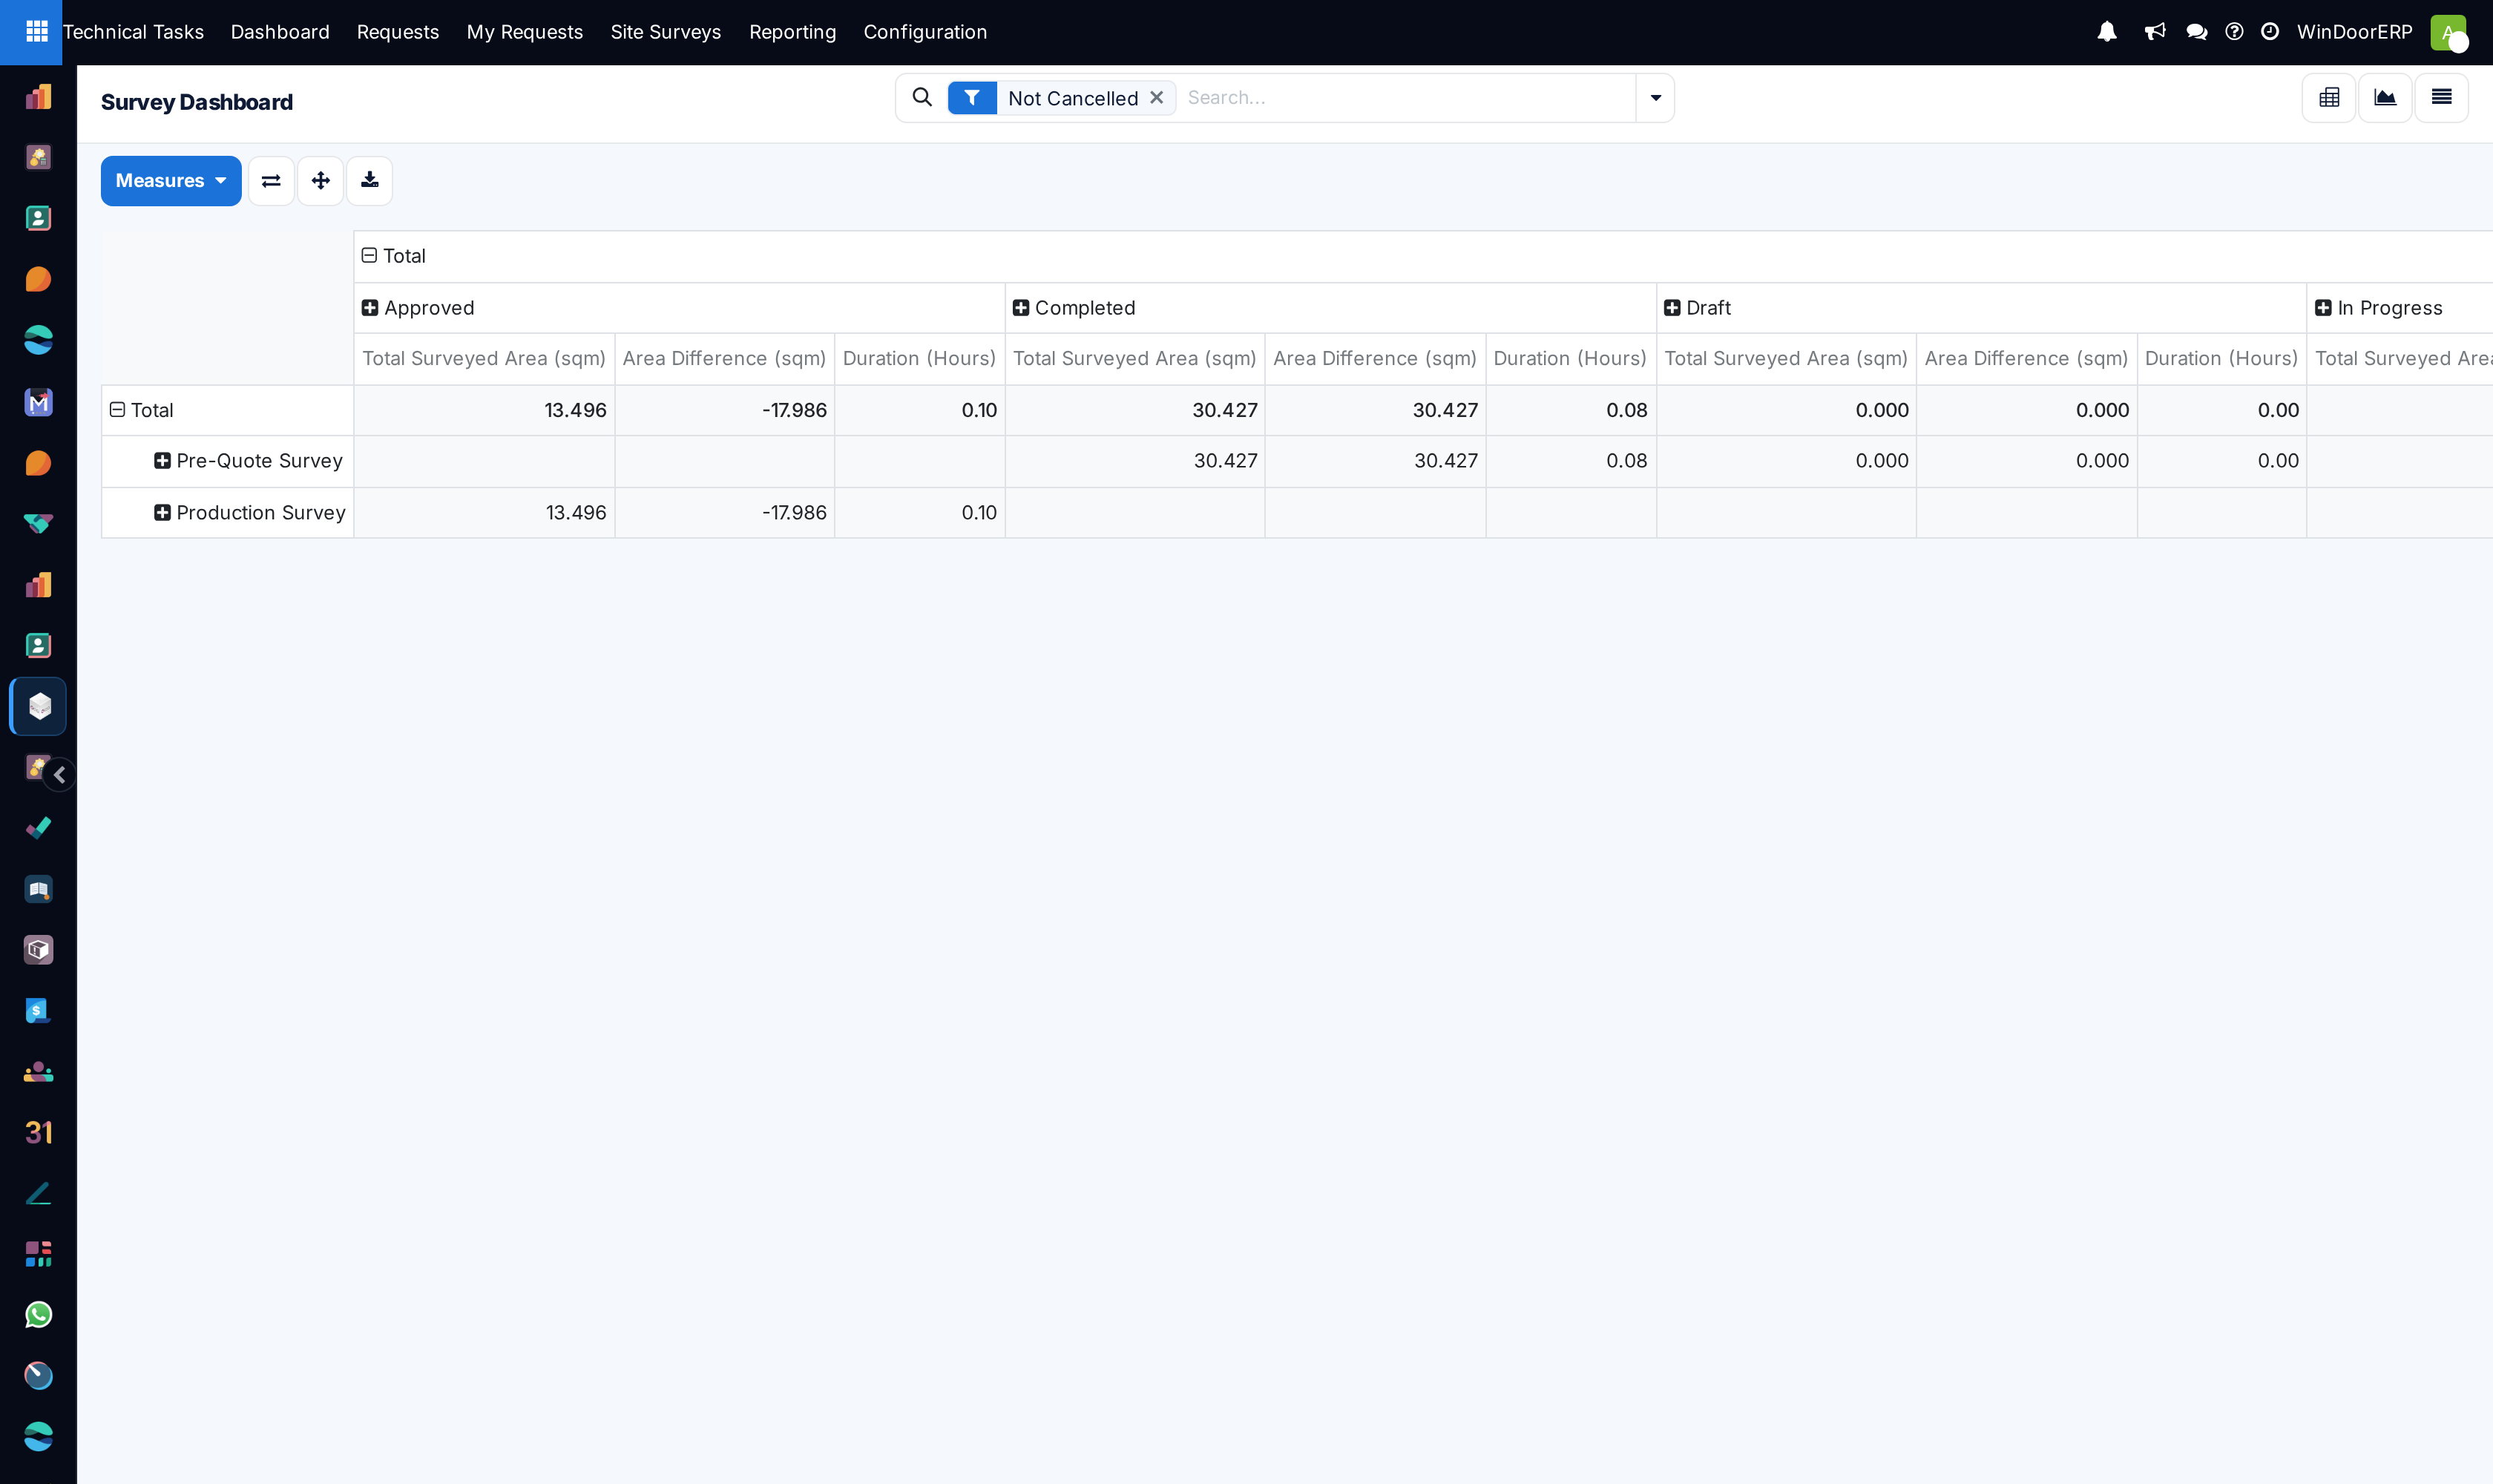
Open Survey Dashboard to see surveyed area and its difference from ordered, by survey type and state.
-
03
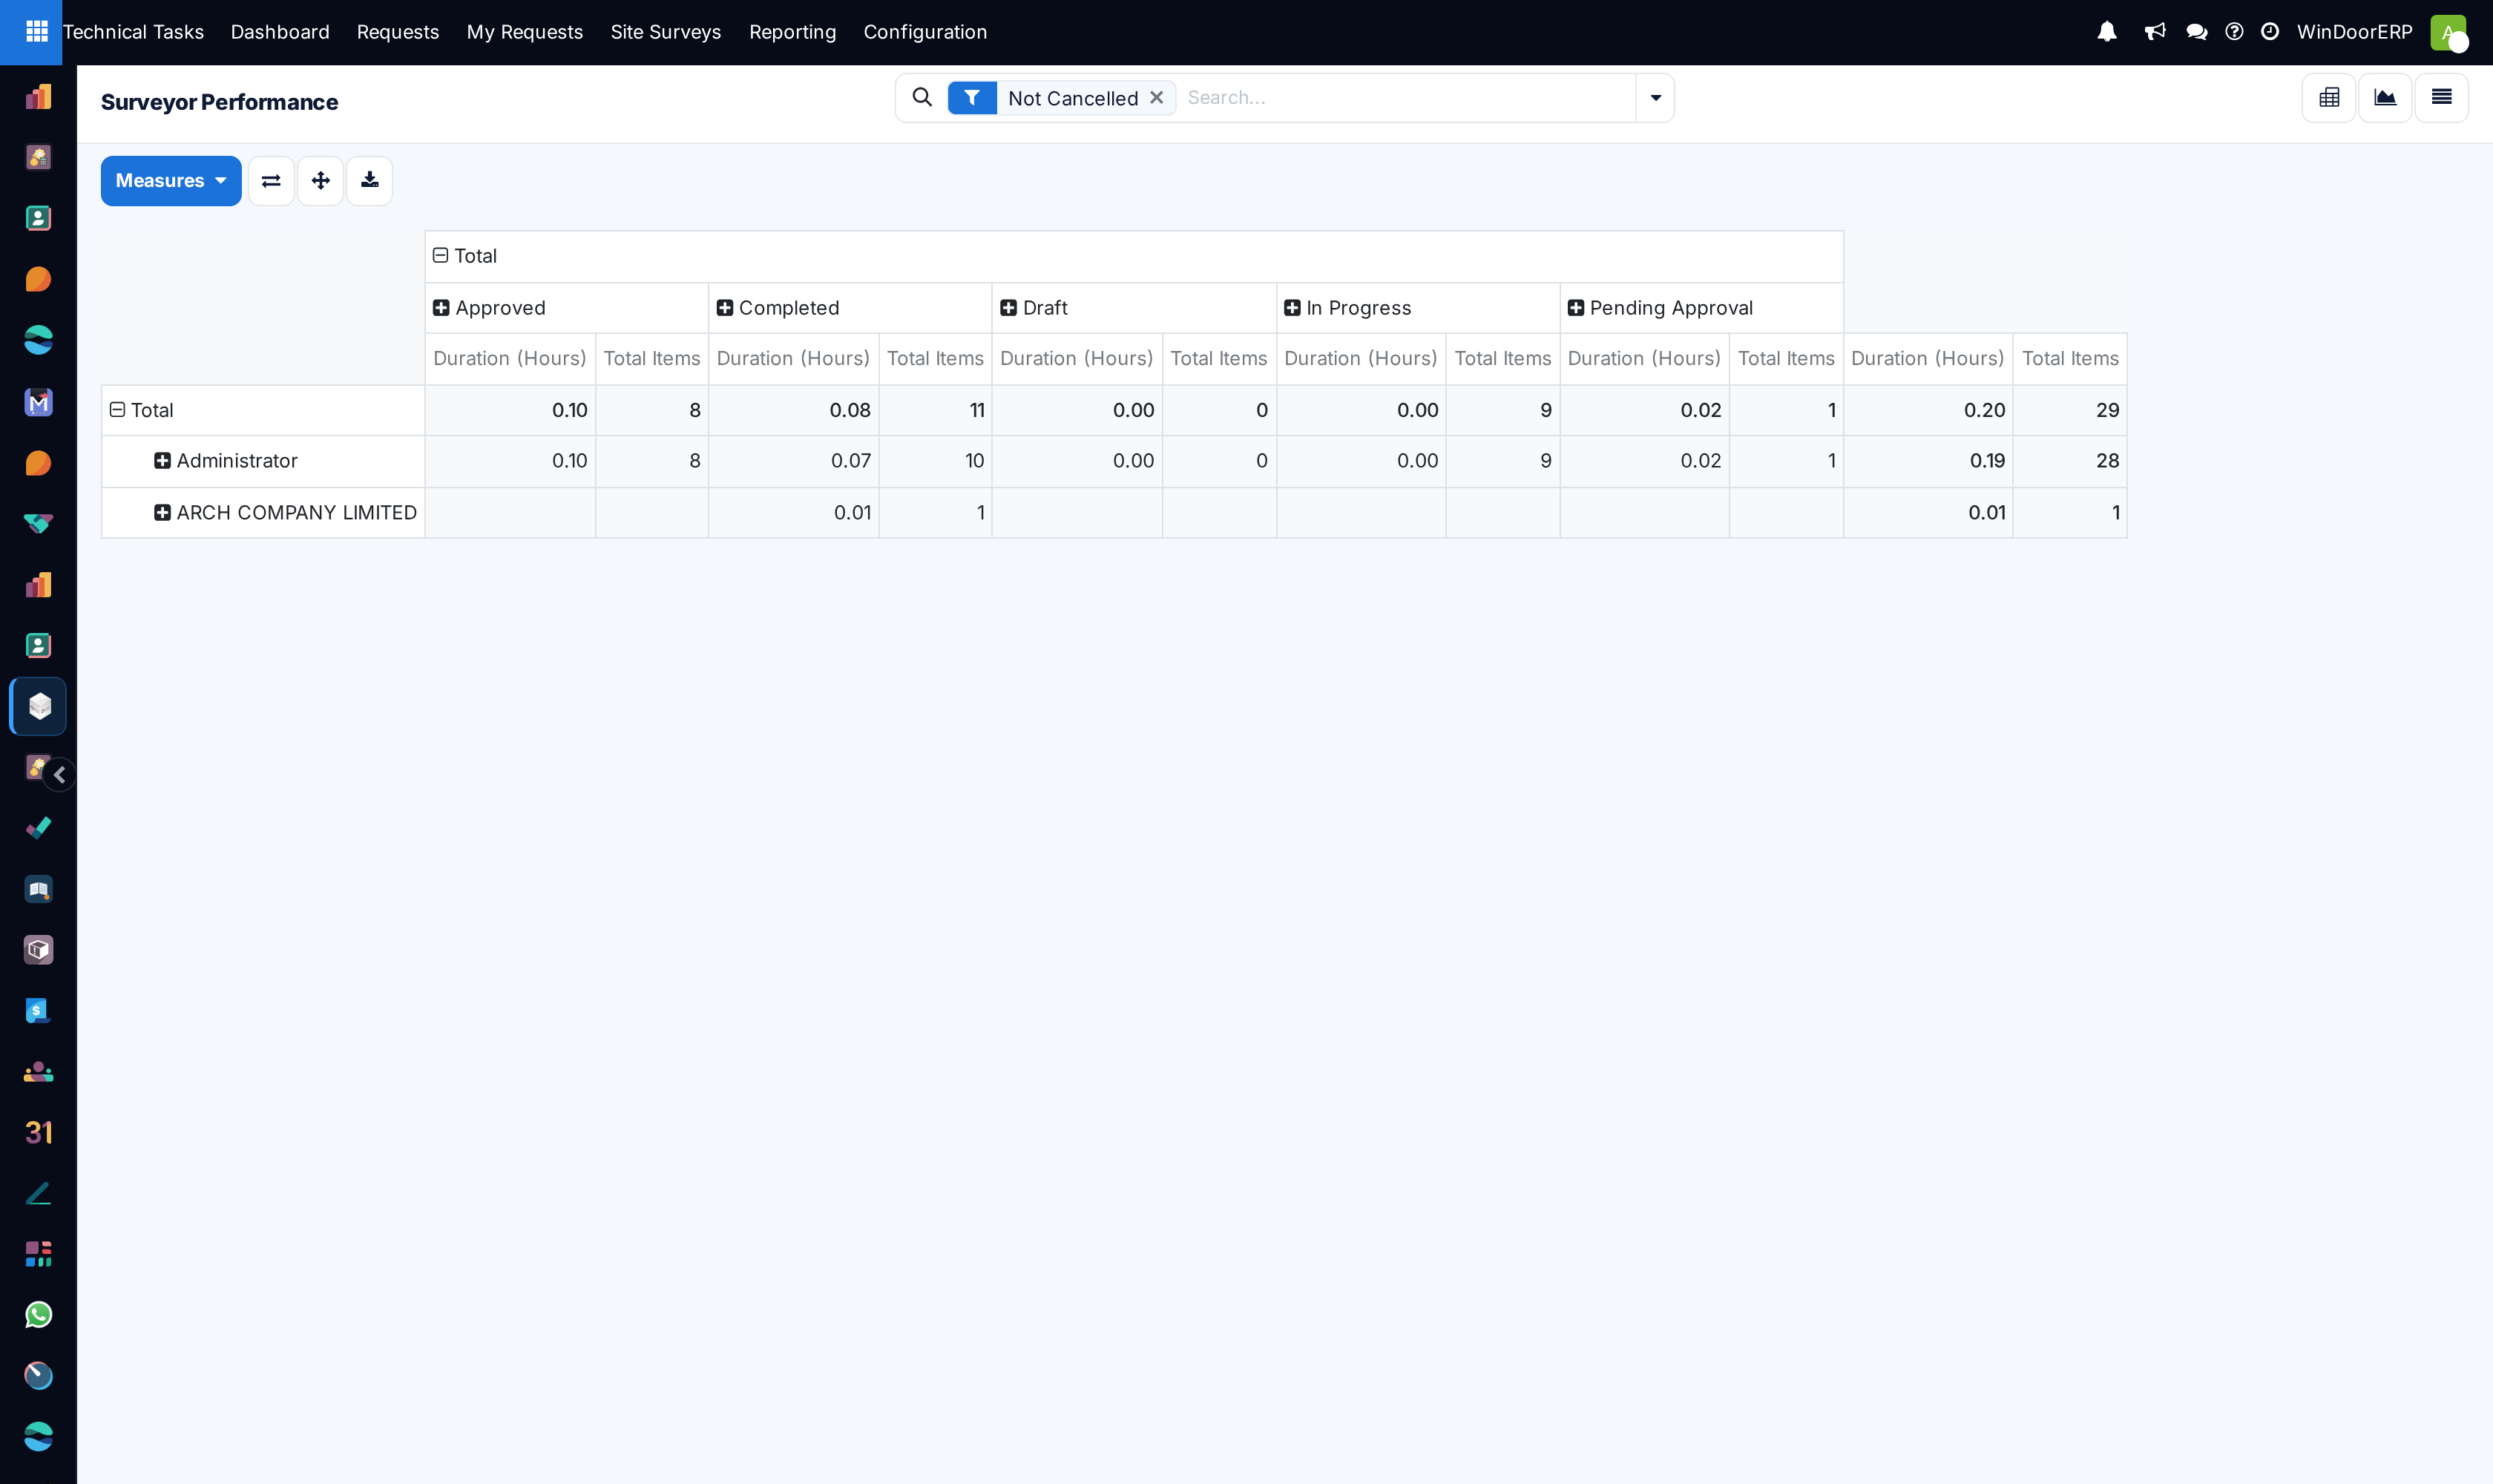
Open Surveyor Performance to compare duration and item counts per surveyor.
-
04
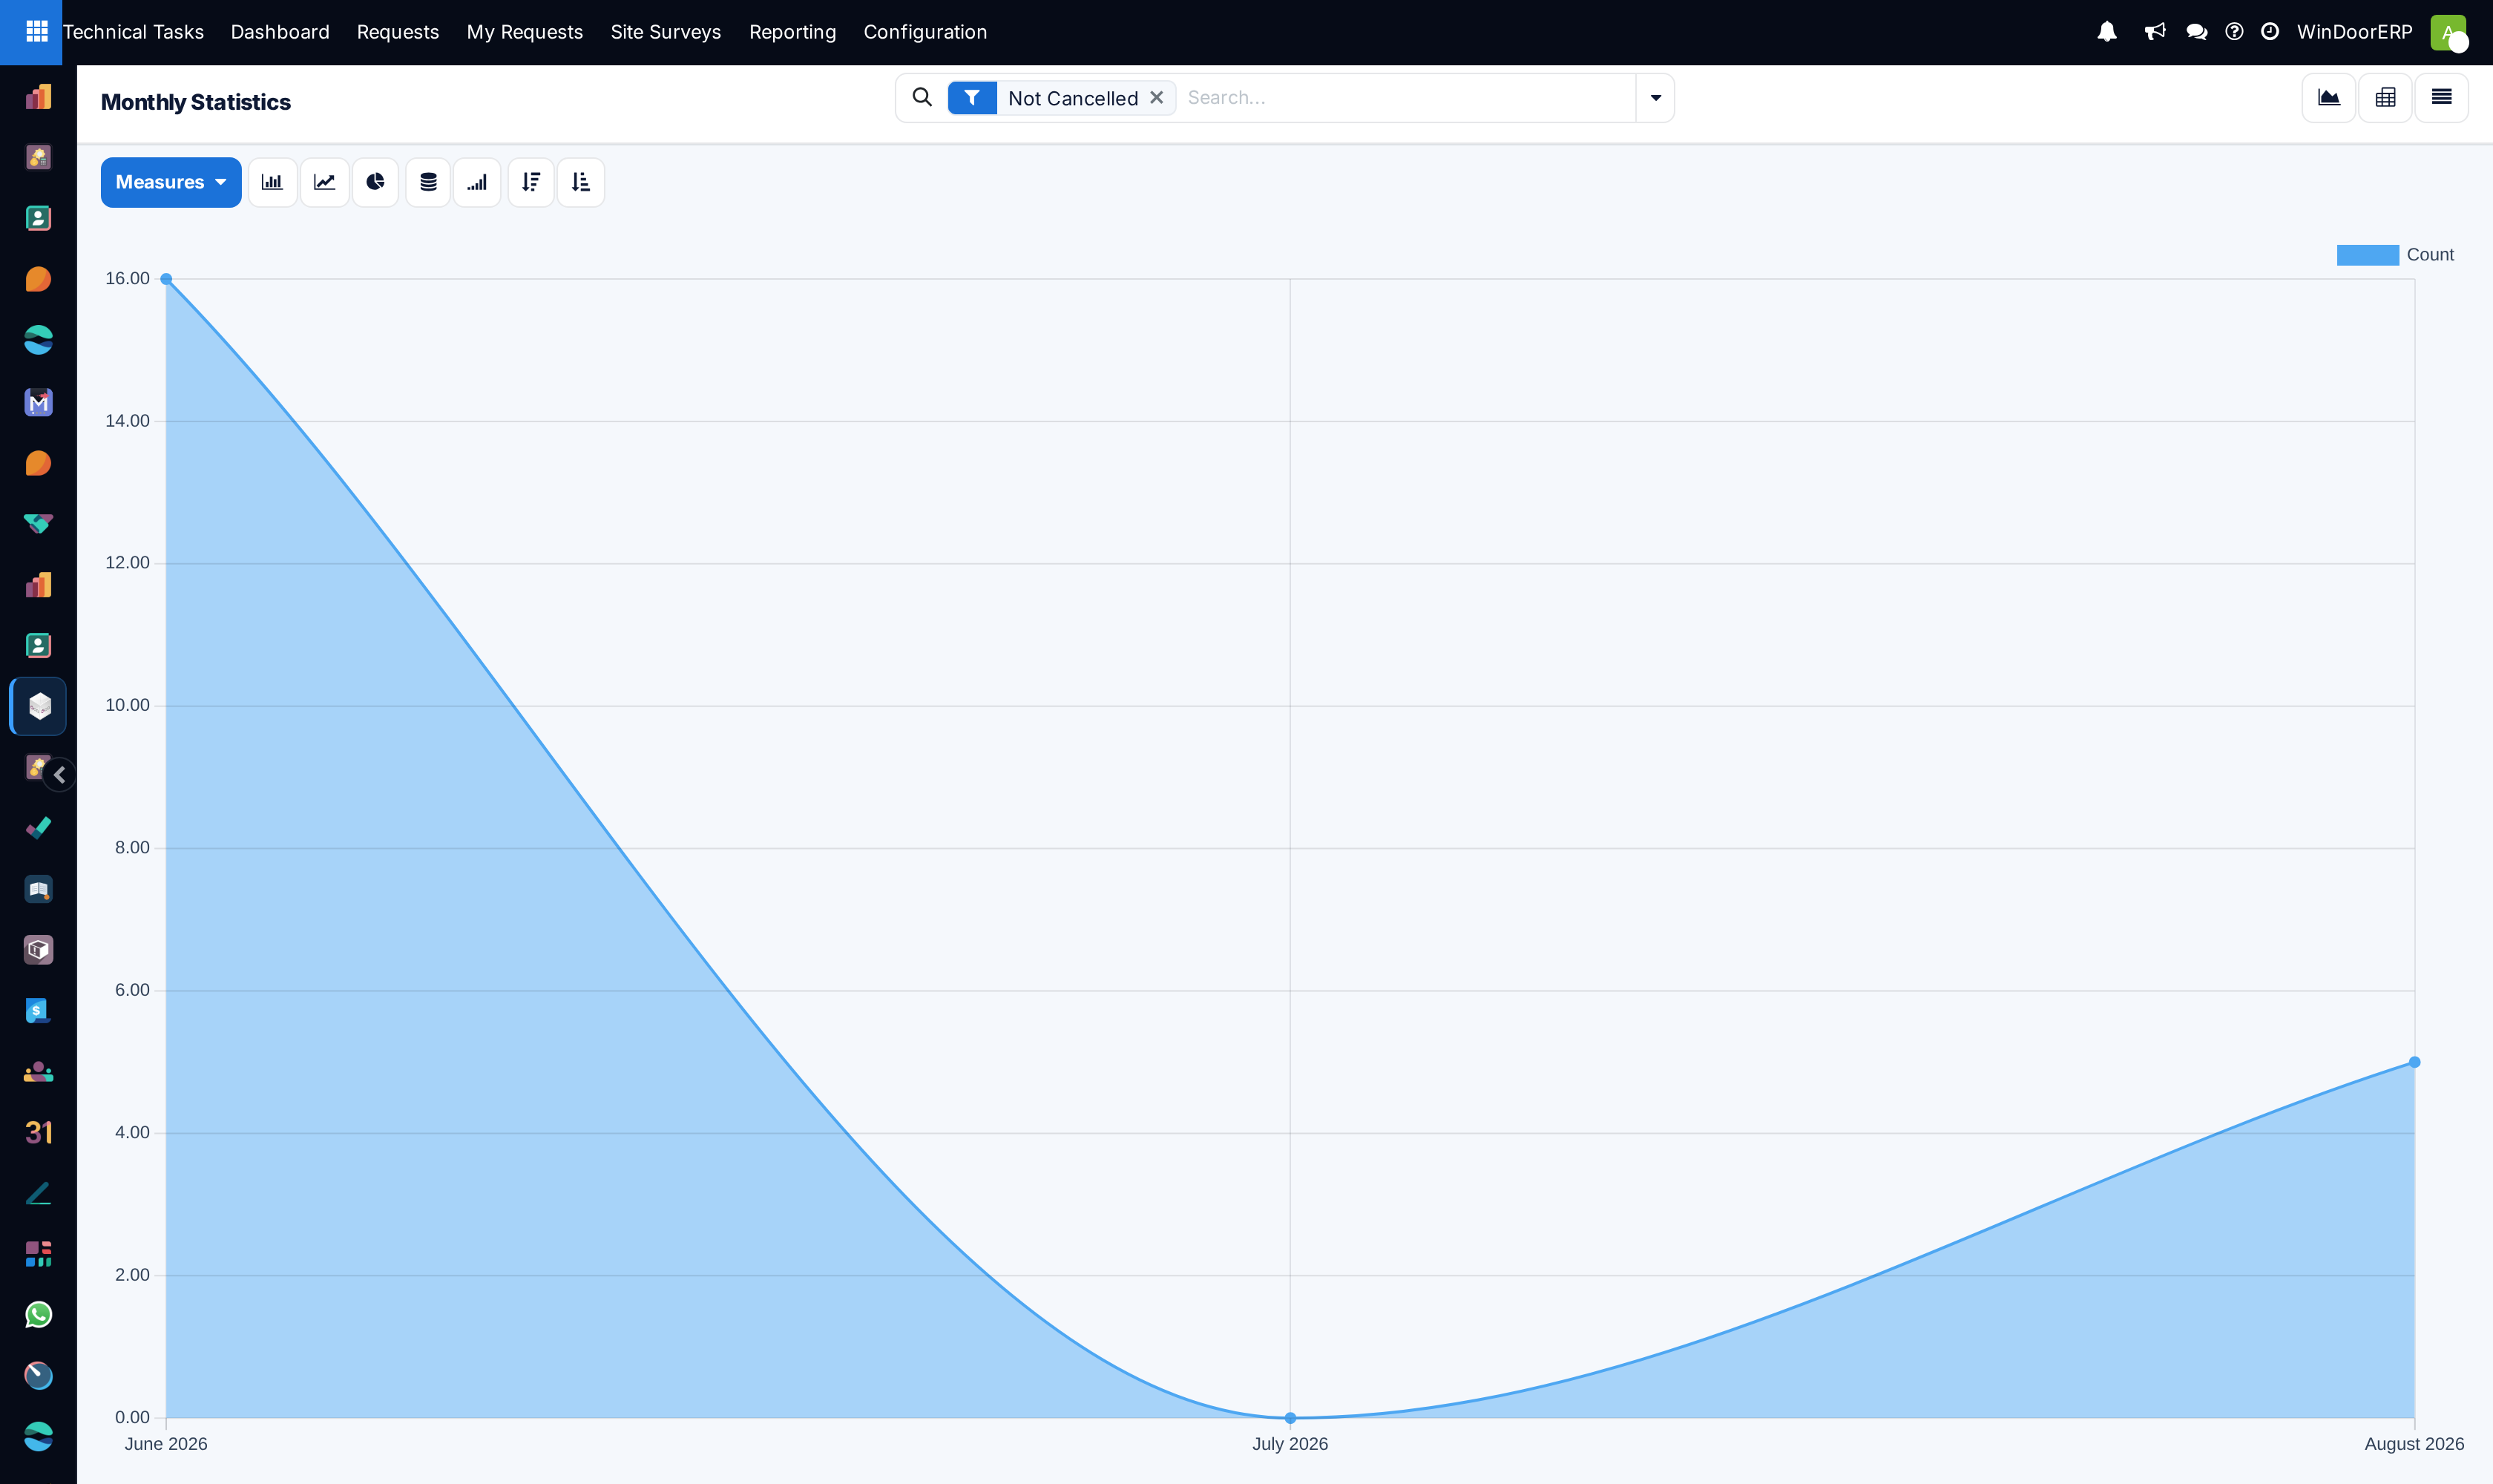
Open Monthly Statistics for the survey count by scheduled month.
-
05
In any of them, switch between pivot, graph and list from the view switcher, and change measures or grouping to answer your own question.
The three reports
| Report | What it opens on |
|---|---|
| Survey Dashboard | A pivot of survey type against state, measuring Surveyed Area, the area difference against what was ordered, and duration. Its graph view is a bar chart by month and type. |
| Surveyor Performance | A pivot of surveyor against state, measuring duration and the number of items measured. |
| Monthly Statistics | A line graph of survey count by scheduled month. |
The number that matters most
The area difference on the Survey Dashboard is the difference between what was ordered and what the surveyor actually measured on site. It is the early warning for a job whose quantities are about to move: a consistent positive or negative difference on one project means the quotation and the site disagree, and it is far cheaper to find that in this pivot than in production.
Note
These are pivot and graph presets over the survey records themselves — there are no separate KPI records behind them. Anything you can group or measure here comes straight from the surveys, so a figure that looks wrong is a survey to open, not a report to fix.
Troubleshooting
| Symptom | Cause and fix |
|---|---|
| The Reporting menu is not there | It is manager-only. Ask an administrator for the survey-manager role. |
| Totals look higher than the work finished | The reports include every non-cancelled survey, including drafts and in-progress ones. Add a state filter if you want completed work only. |
| A surveyor shows no duration | Duration comes from the recorded start and end times on the survey. A survey completed without those recorded contributes counts but no time. |
| Monthly Statistics disagrees with when work happened | It groups by scheduled month, not by completion. A survey scheduled in March and done in April counts in March. |
Common mistakes
- Comparing surveyors on survey count alone — one villa and one tower are not one unit each. Use area and duration.
- Reading these as completion reports when they include drafts and in-progress surveys.
- Ignoring a persistent area difference on a project because each individual survey looked close enough.
Was this article helpful?
Thanks — your feedback helps.
Running a window or door factory?
Ask for a demo