Read the technical office dashboard
What this does
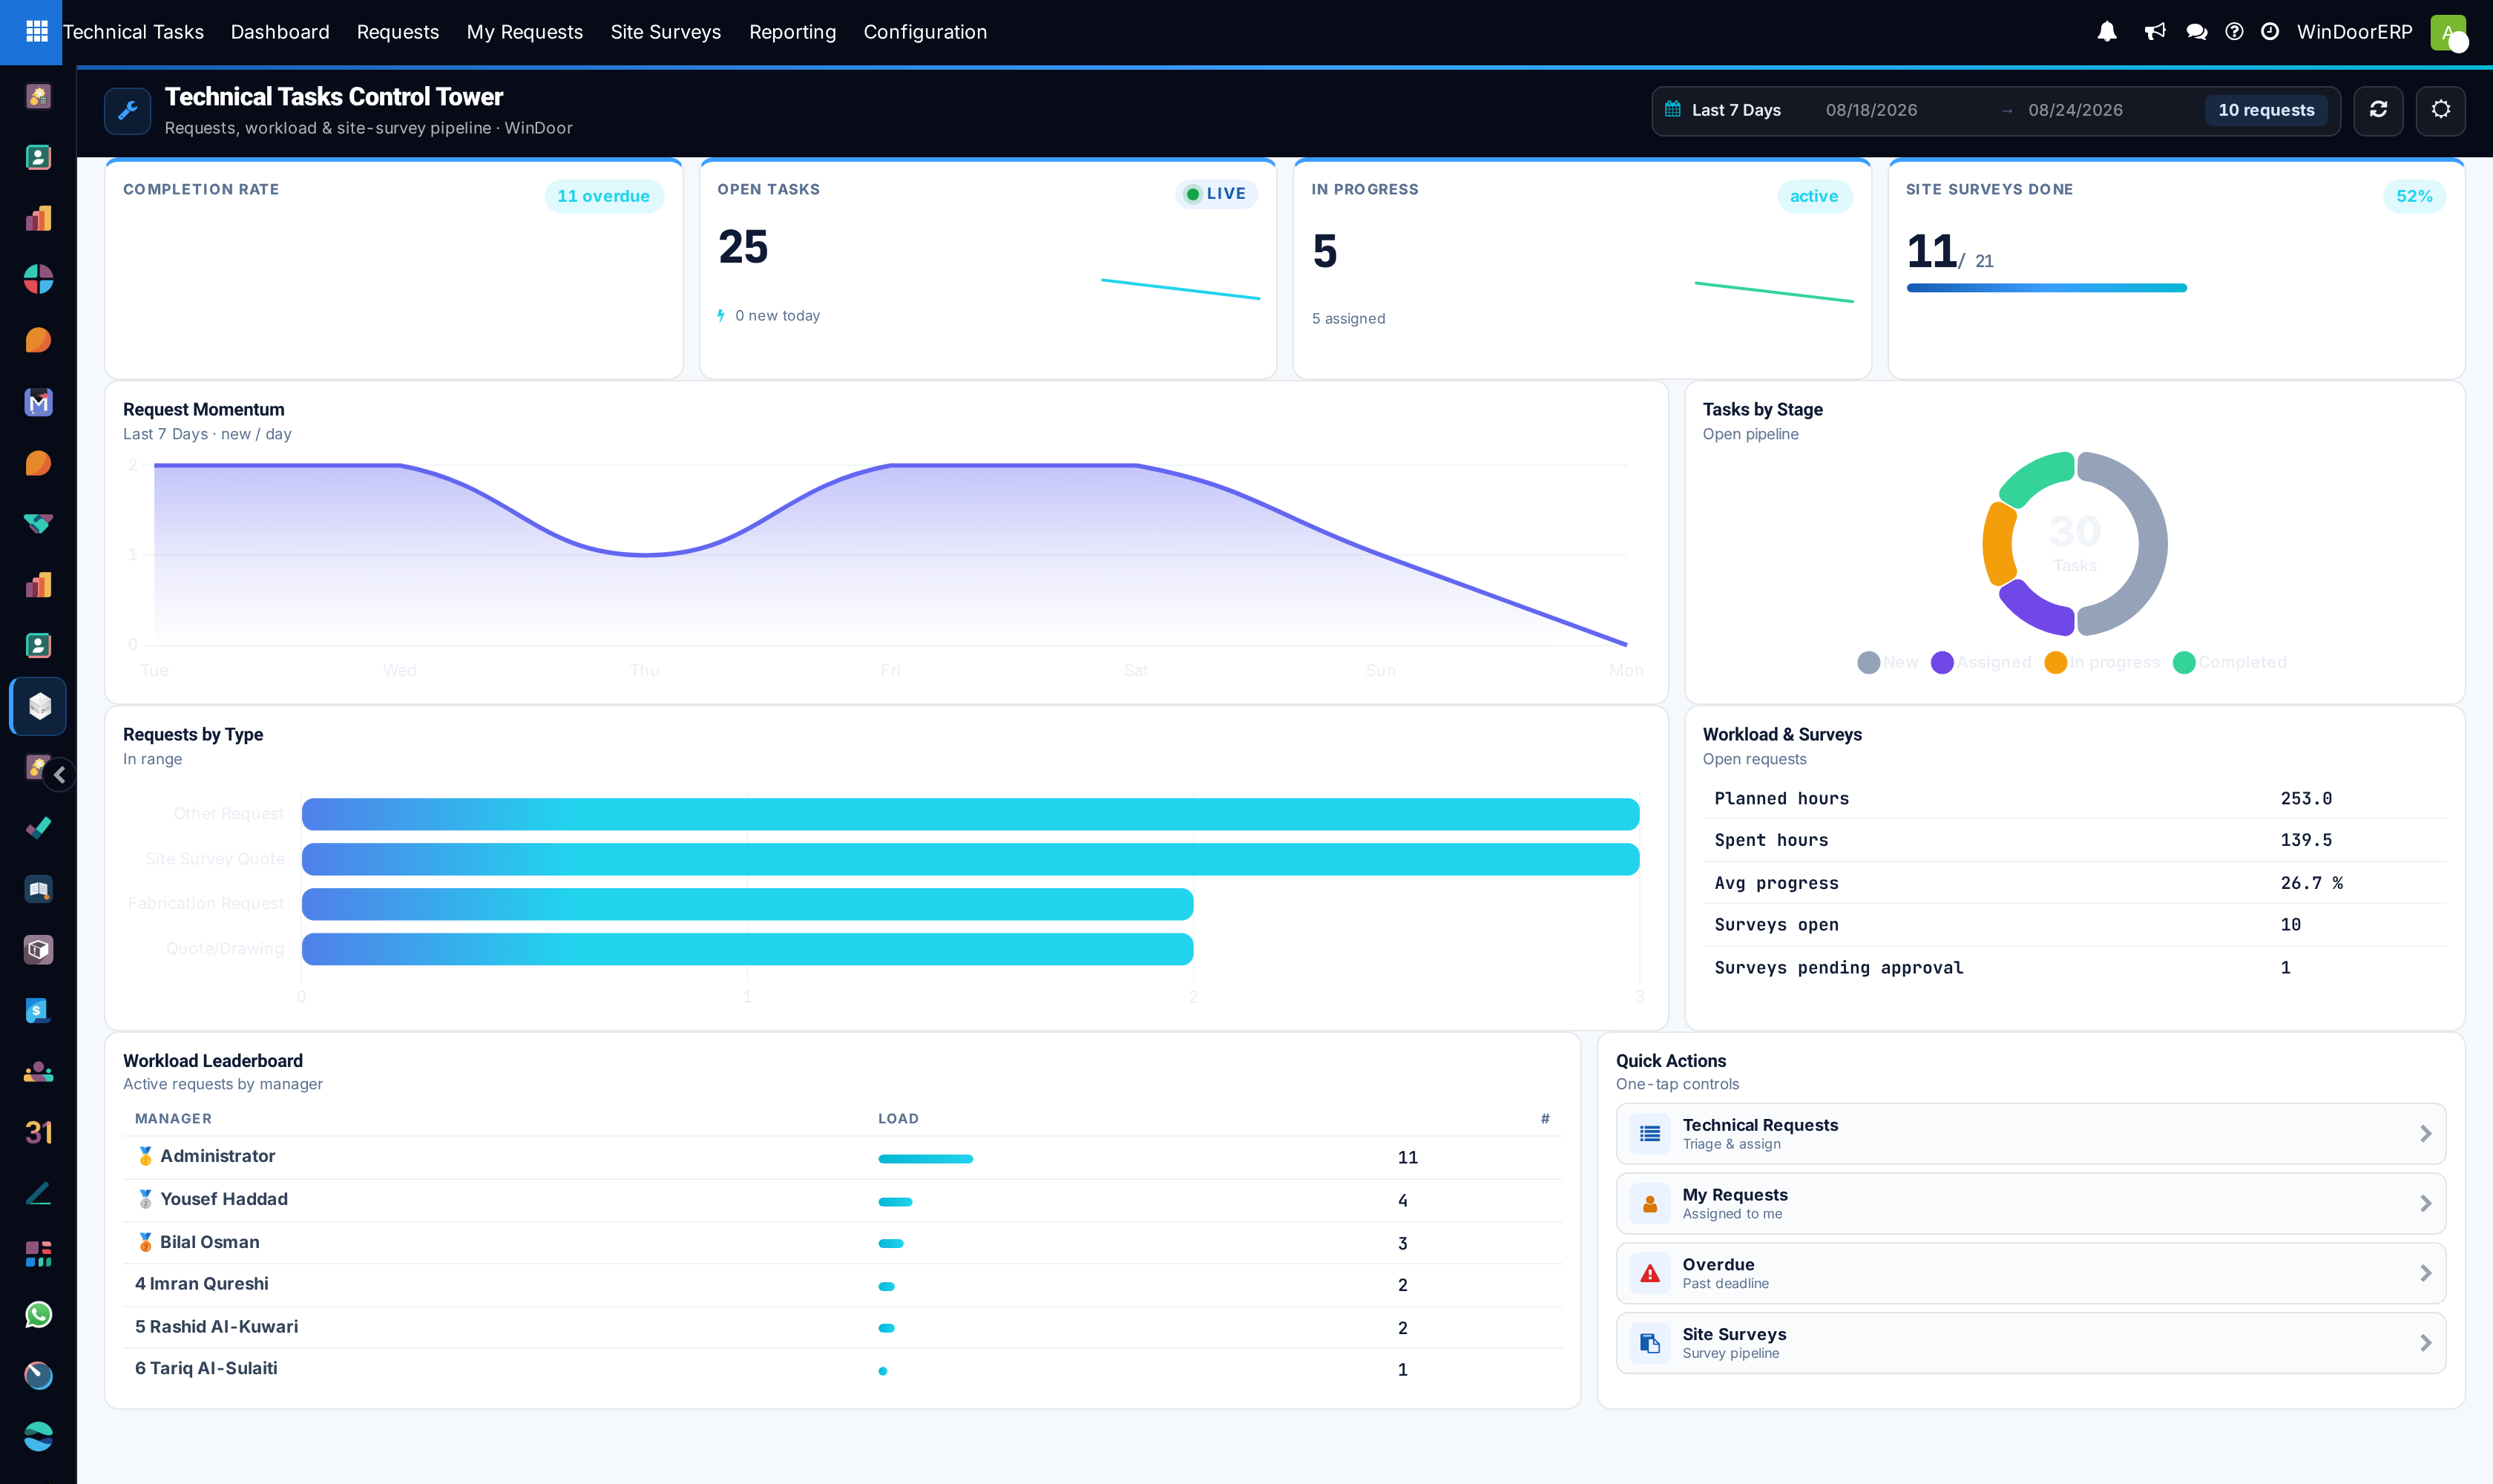
The Technical Tasks Control Tower is the one screen that answers "what is the technical office actually carrying right now" — how many requests are open, which stage they sit in, who is loaded, and how the site-survey pipeline behind them is moving.
Before you start
- You need access to the Technical Tasks app. The dashboard is read-only: everything on it is a view of requests and surveys other people created.
- The numbers follow the date range in the top-right, not the whole database. Change the range before reading anything as a trend.
Steps
-
01
Open Technical Tasks › Dashboard.
-
02
Set the date range — Last 7 Days, this month, this year, or all time — from the picker at the top right.
-
03
Read the four cards along the top: Completion Rate with its overdue count, Open Tasks, In Progress, and Site Surveys Done.
-
04
Work down to Tasks by Stage and Workload Leaderboard to see where the queue is stuck and who is carrying it.
-
05
Use the Quick Actions panel to jump straight into the list you need to act on.
What each panel is telling you
| Panel | What it means |
|---|---|
| Completion Rate | How much of the load in range is finished, with the count of overdue requests called out beside it. The overdue number is the one that needs a decision today. |
| Open Tasks / In Progress | The live queue, and how much of it someone has actually started. A large gap between the two means work is queued but not picked up. |
| Site Surveys Done | Completed surveys against the total in range — the technical office's other half of the workload. |
| Request Momentum | New requests per day across the range. Read it for arrival rate, not for completion. |
| Tasks by Stage | The open pipeline split across New, Assigned, In progress and Completed. A fat New slice is a triage problem, not a capacity problem. |
| Requests by Type | The mix in range across the request types this fleet uses — Quote/Drawing, Fabrication Request, Site Survey Quote and Other Request. |
| Workload & Surveys | Planned hours against spent hours with average progress, plus surveys open and surveys pending approval. This is where "we are busy" becomes a number. |
| Workload Leaderboard | Active requests per manager. Use it to rebalance, not to rank people. |
| Quick Actions | One-tap routes into Technical Requests, My Requests, Overdue and Site Surveys. |
Troubleshooting
| Symptom | Cause and fix |
|---|---|
| The dashboard looks empty | The date range excludes your data. Widen it — a narrow range on a quiet week legitimately shows almost nothing. |
| Numbers disagree with the Requests list | The list keeps its own filters and the dashboard follows only its date range. Clear the list's filters before comparing. |
| Surveys pending approval never falls | Approval is a survey-manager action, and it is a different queue from the requests. Open Site Surveys and approve from there. |
| A colleague sees different figures | Some panels are scoped to what the viewer may see. Compare like for like before assuming the dashboard is wrong. |
Common mistakes
- Reading the cards without checking the date range, then reporting a "collapse in throughput" that is a narrower window.
- Leaving high-priority requests unassigned in New — the donut shows it immediately and it is the cheapest problem to fix.
- Using the leaderboard as a productivity score instead of a load-balancing tool.
- Treating the dashboard as the record. It is a lens; the request and the survey are the records.
Was this article helpful?
Thanks — your feedback helps.
Running a window or door factory?
Ask for a demo