Measure work centers with the work order analysis
What this does
Production › Reporting › Work Orders measures the operations themselves: planned versus actual minutes, good and scrap quantities, and OEE per work center, split by state. It is where you find the bottleneck station, the operations that always overrun their plan, and the backlog waiting at each stage.
Before you start
- A production role — the Reporting menu requires it. The Work Orders & Routing feature governs whether work orders exist at all, not whether this entry appears: with routing off the screen is present but empty.
- Labour recorded at the terminal: actual minutes, quantities and OEE all come from labour logs.
Steps

-
01
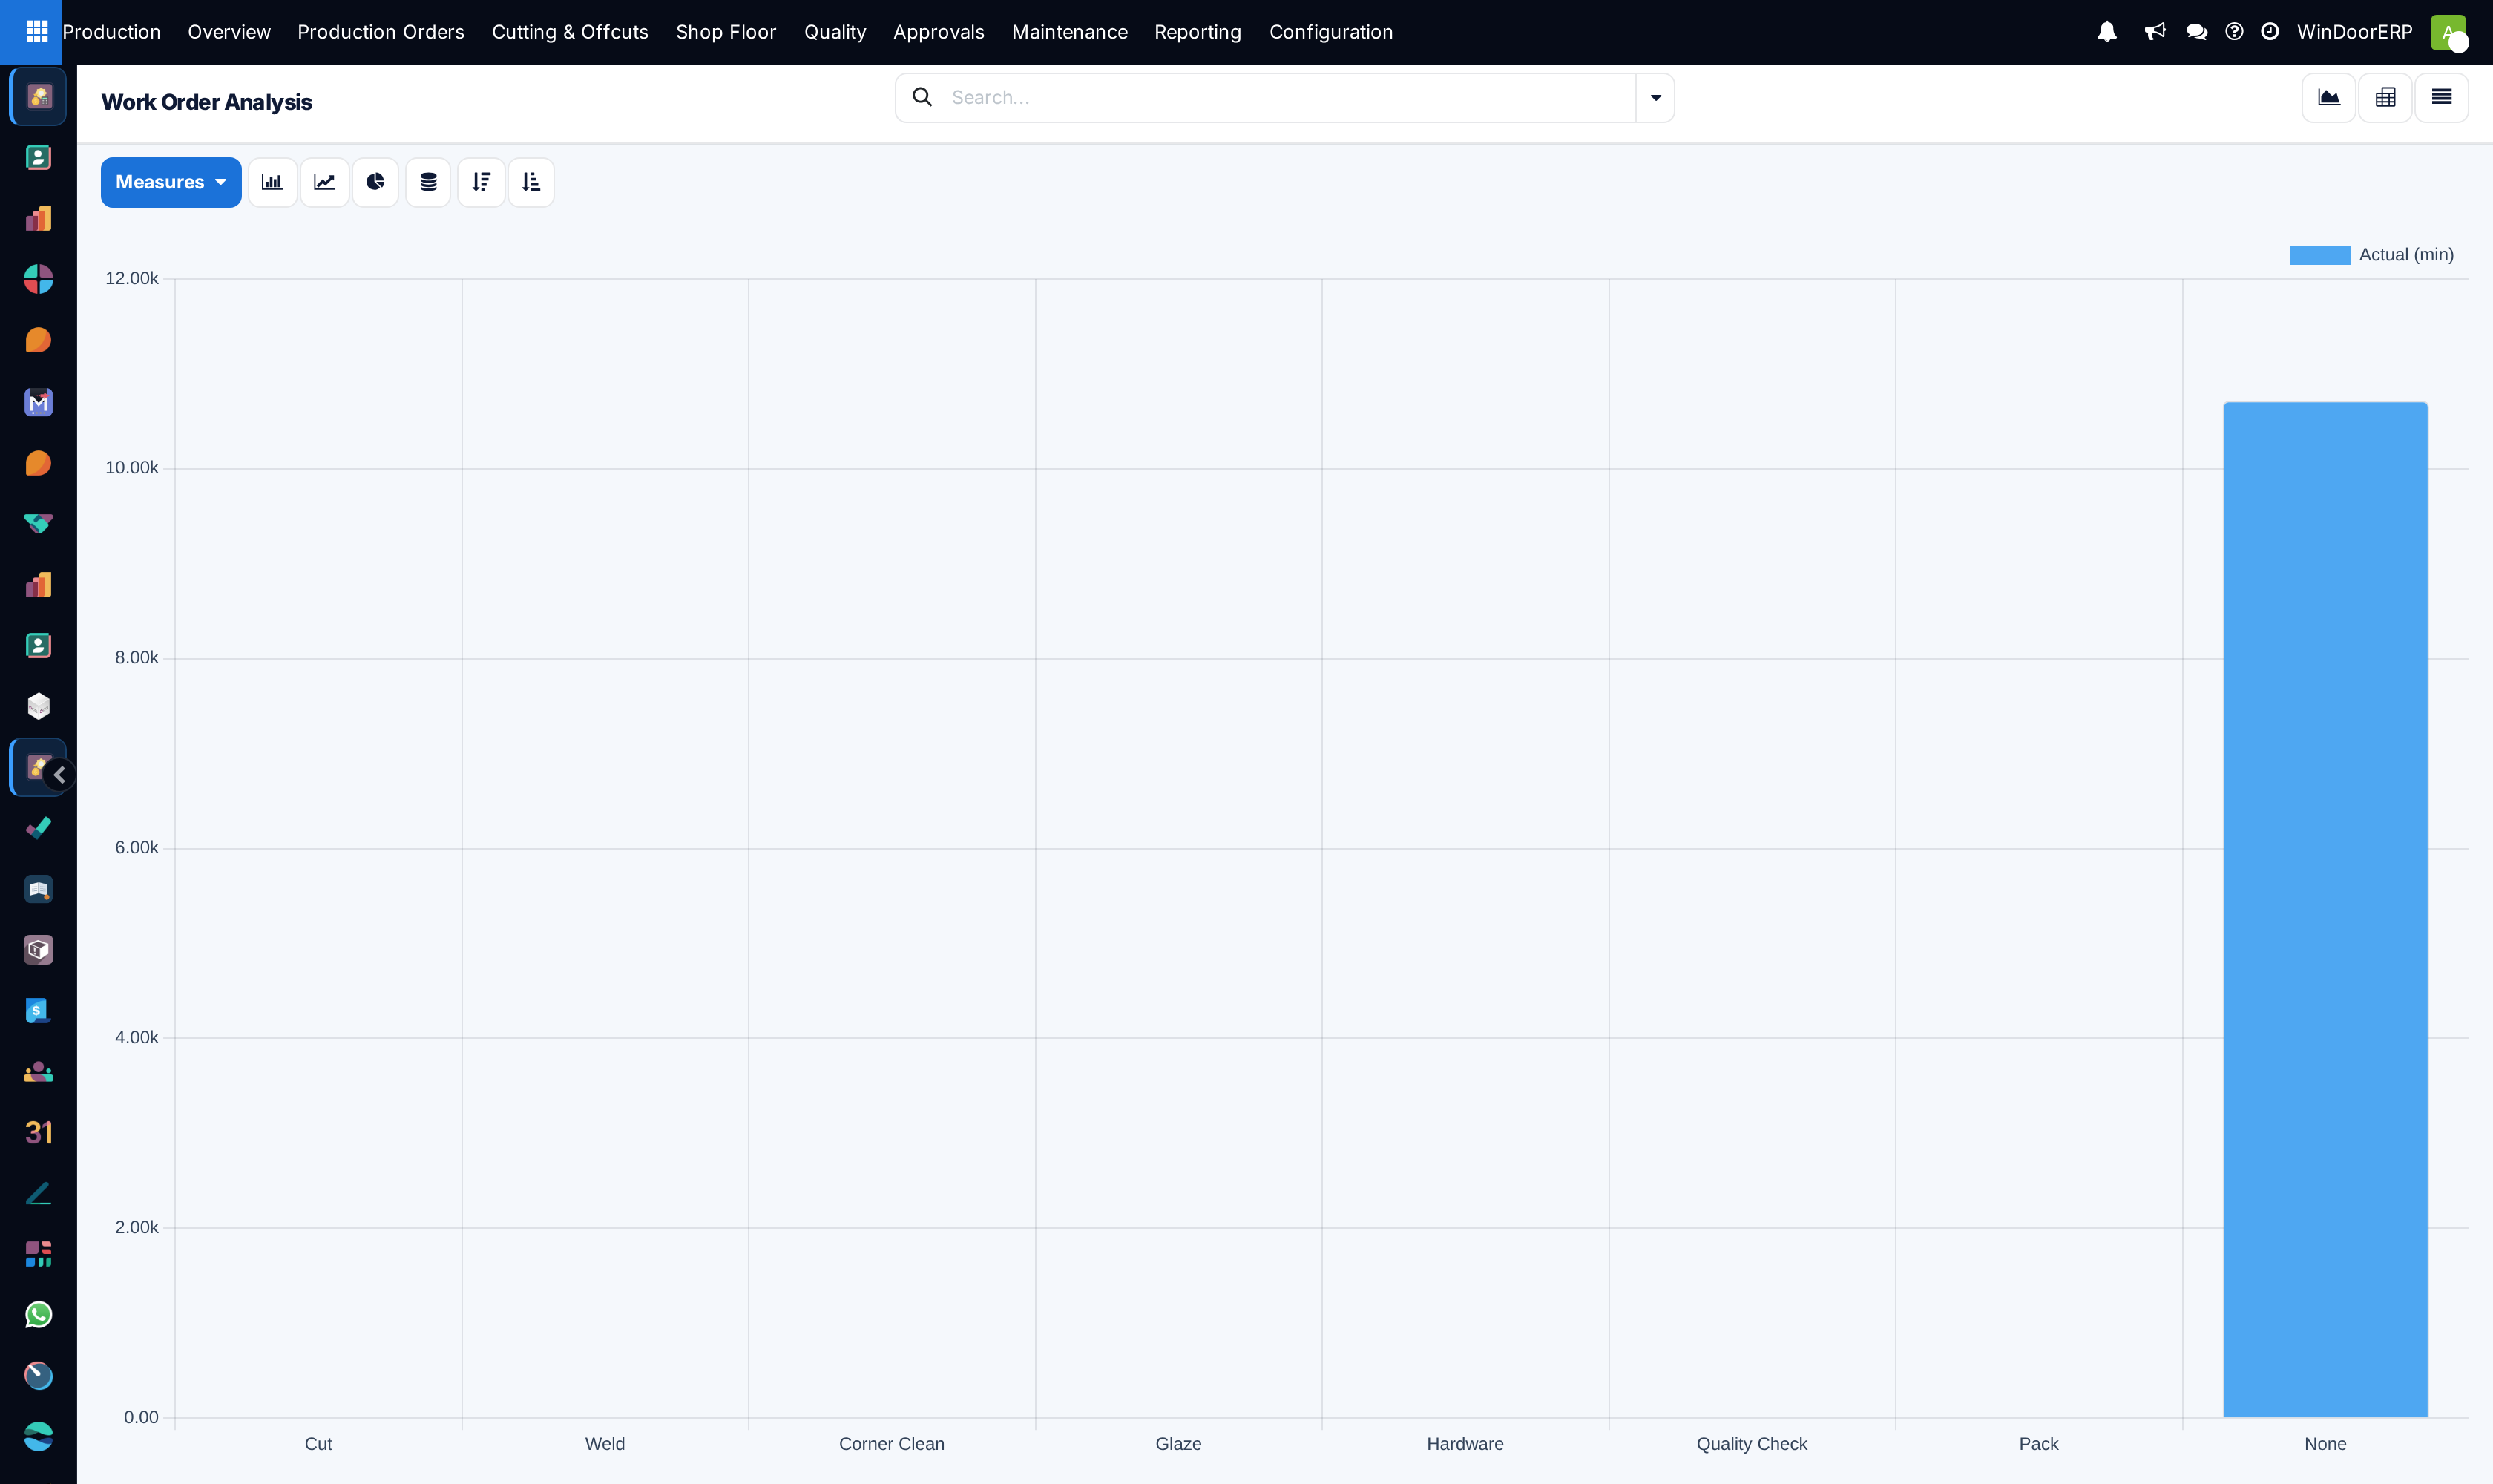
Open Production › Reporting › Work Orders. The bar chart opens on OEE and actual minutes per work center.
-
02
Add a period — the analysis opens over all work orders ever, with no default date filter.
-
03
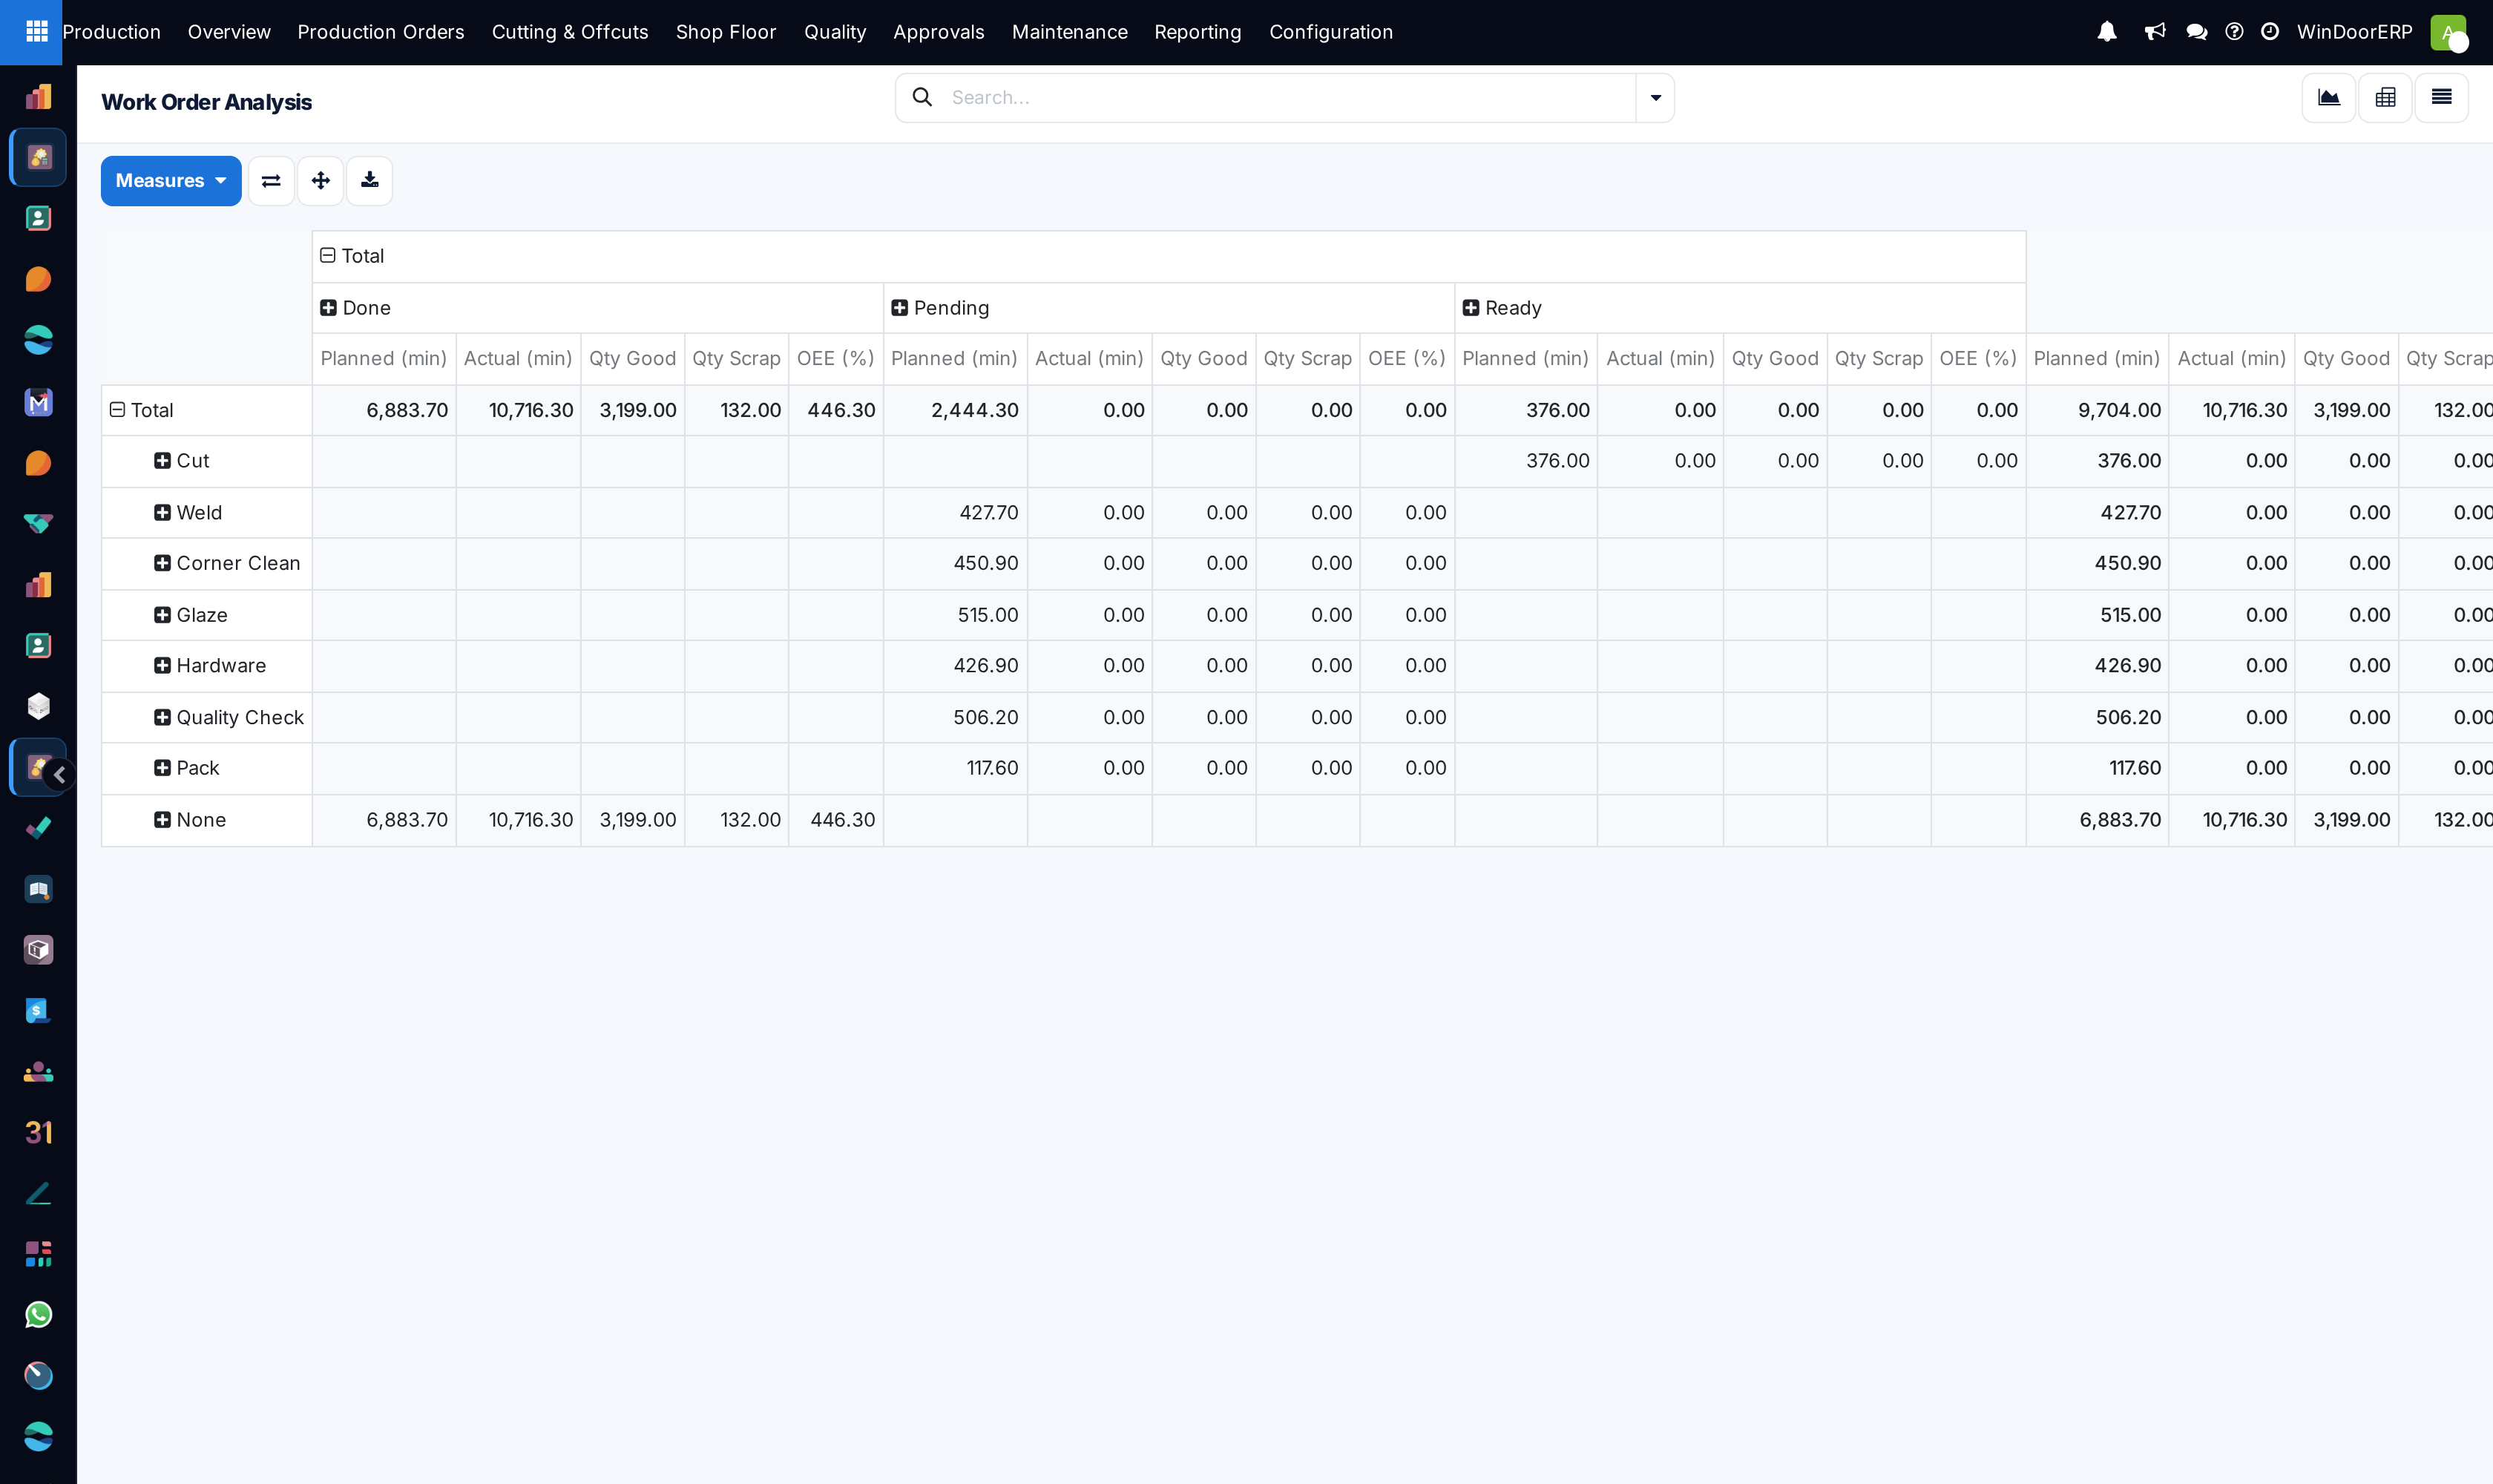
Switch to the Pivot for the full table: work centers down the side, states across the top, measuring planned and actual minutes, good and scrap quantities and OEE.
-
04
Find the bottleneck by reading the Pending and Ready columns — work queued at a station is backlog, whatever its OEE says.
-
05
Compare planned against actual minutes per work center to see where the routing's standard times are wrong, then fix the standards rather than the people.
-
06
Click any cell to open the work orders behind it.
The measures
| Measure | Meaning |
|---|---|
| Planned (min) | The scheduled time for the operation — as good as the standards someone set on the work centers. |
| Actual (min) | The total of the labour logs recorded against it. |
| Qty Good / Qty Scrap | What the operators reported at Finish. |
| OEE (%) | Availability × performance × quality, computed per work order. Its three components are separately available from the Measures menu. |
| Also available | Downtime minutes, energy cost, piece-rate and labour cost — every stored figure on the work order. |
Important
Never read a summed OEE. The pivot adds percentages, so a total row can happily show 446% — a meaningless number. Read OEE one row at a time; the minutes and quantities beside it are true sums. The same caution applies to the availability, performance and quality components.
Troubleshooting
| OEE totals above 100% | Summed percentages — read per row. |
|---|---|
| OEE is high on a station that clearly struggled | Availability only counts downtime that was logged with a loss reason; unlogged stoppages are invisible to the calculation. |
| Planned minutes are zero | The work orders were never scheduled, or the work centers carry no standard times. Variance analysis is meaningless until they do. |
| Numbers are enormous | All-time totals — add a date filter. |
| The menu is missing | You lack the production role — the whole Reporting menu requires it. |
| Done and cancelled operations are included | This analysis applies no default filter, unlike Shop Floor › Work Orders which opens on Open. Add a state filter when you want live work only. |
| Scrap is always zero | Operators finish operations without entering scrap. Note that finishing with both counts blank books the whole quantity as good. |
Common mistakes
- Judging operators on planned-versus-actual variance when the plan was a guess — calibrate standard times first.
- Chasing OEE as a single number. It hides three different problems; split it into availability, performance and quality before acting.
- Reading a station's low OEE as a bottleneck. Backlog lives in the Pending and Ready columns, not in efficiency.
- Comparing work centers with different shift patterns without normalising by hours.
Was this article helpful?
Thanks — your feedback helps.
Running a window or door factory?
Ask for a demo