Monitor installation from the dashboard and analysis views
What this does
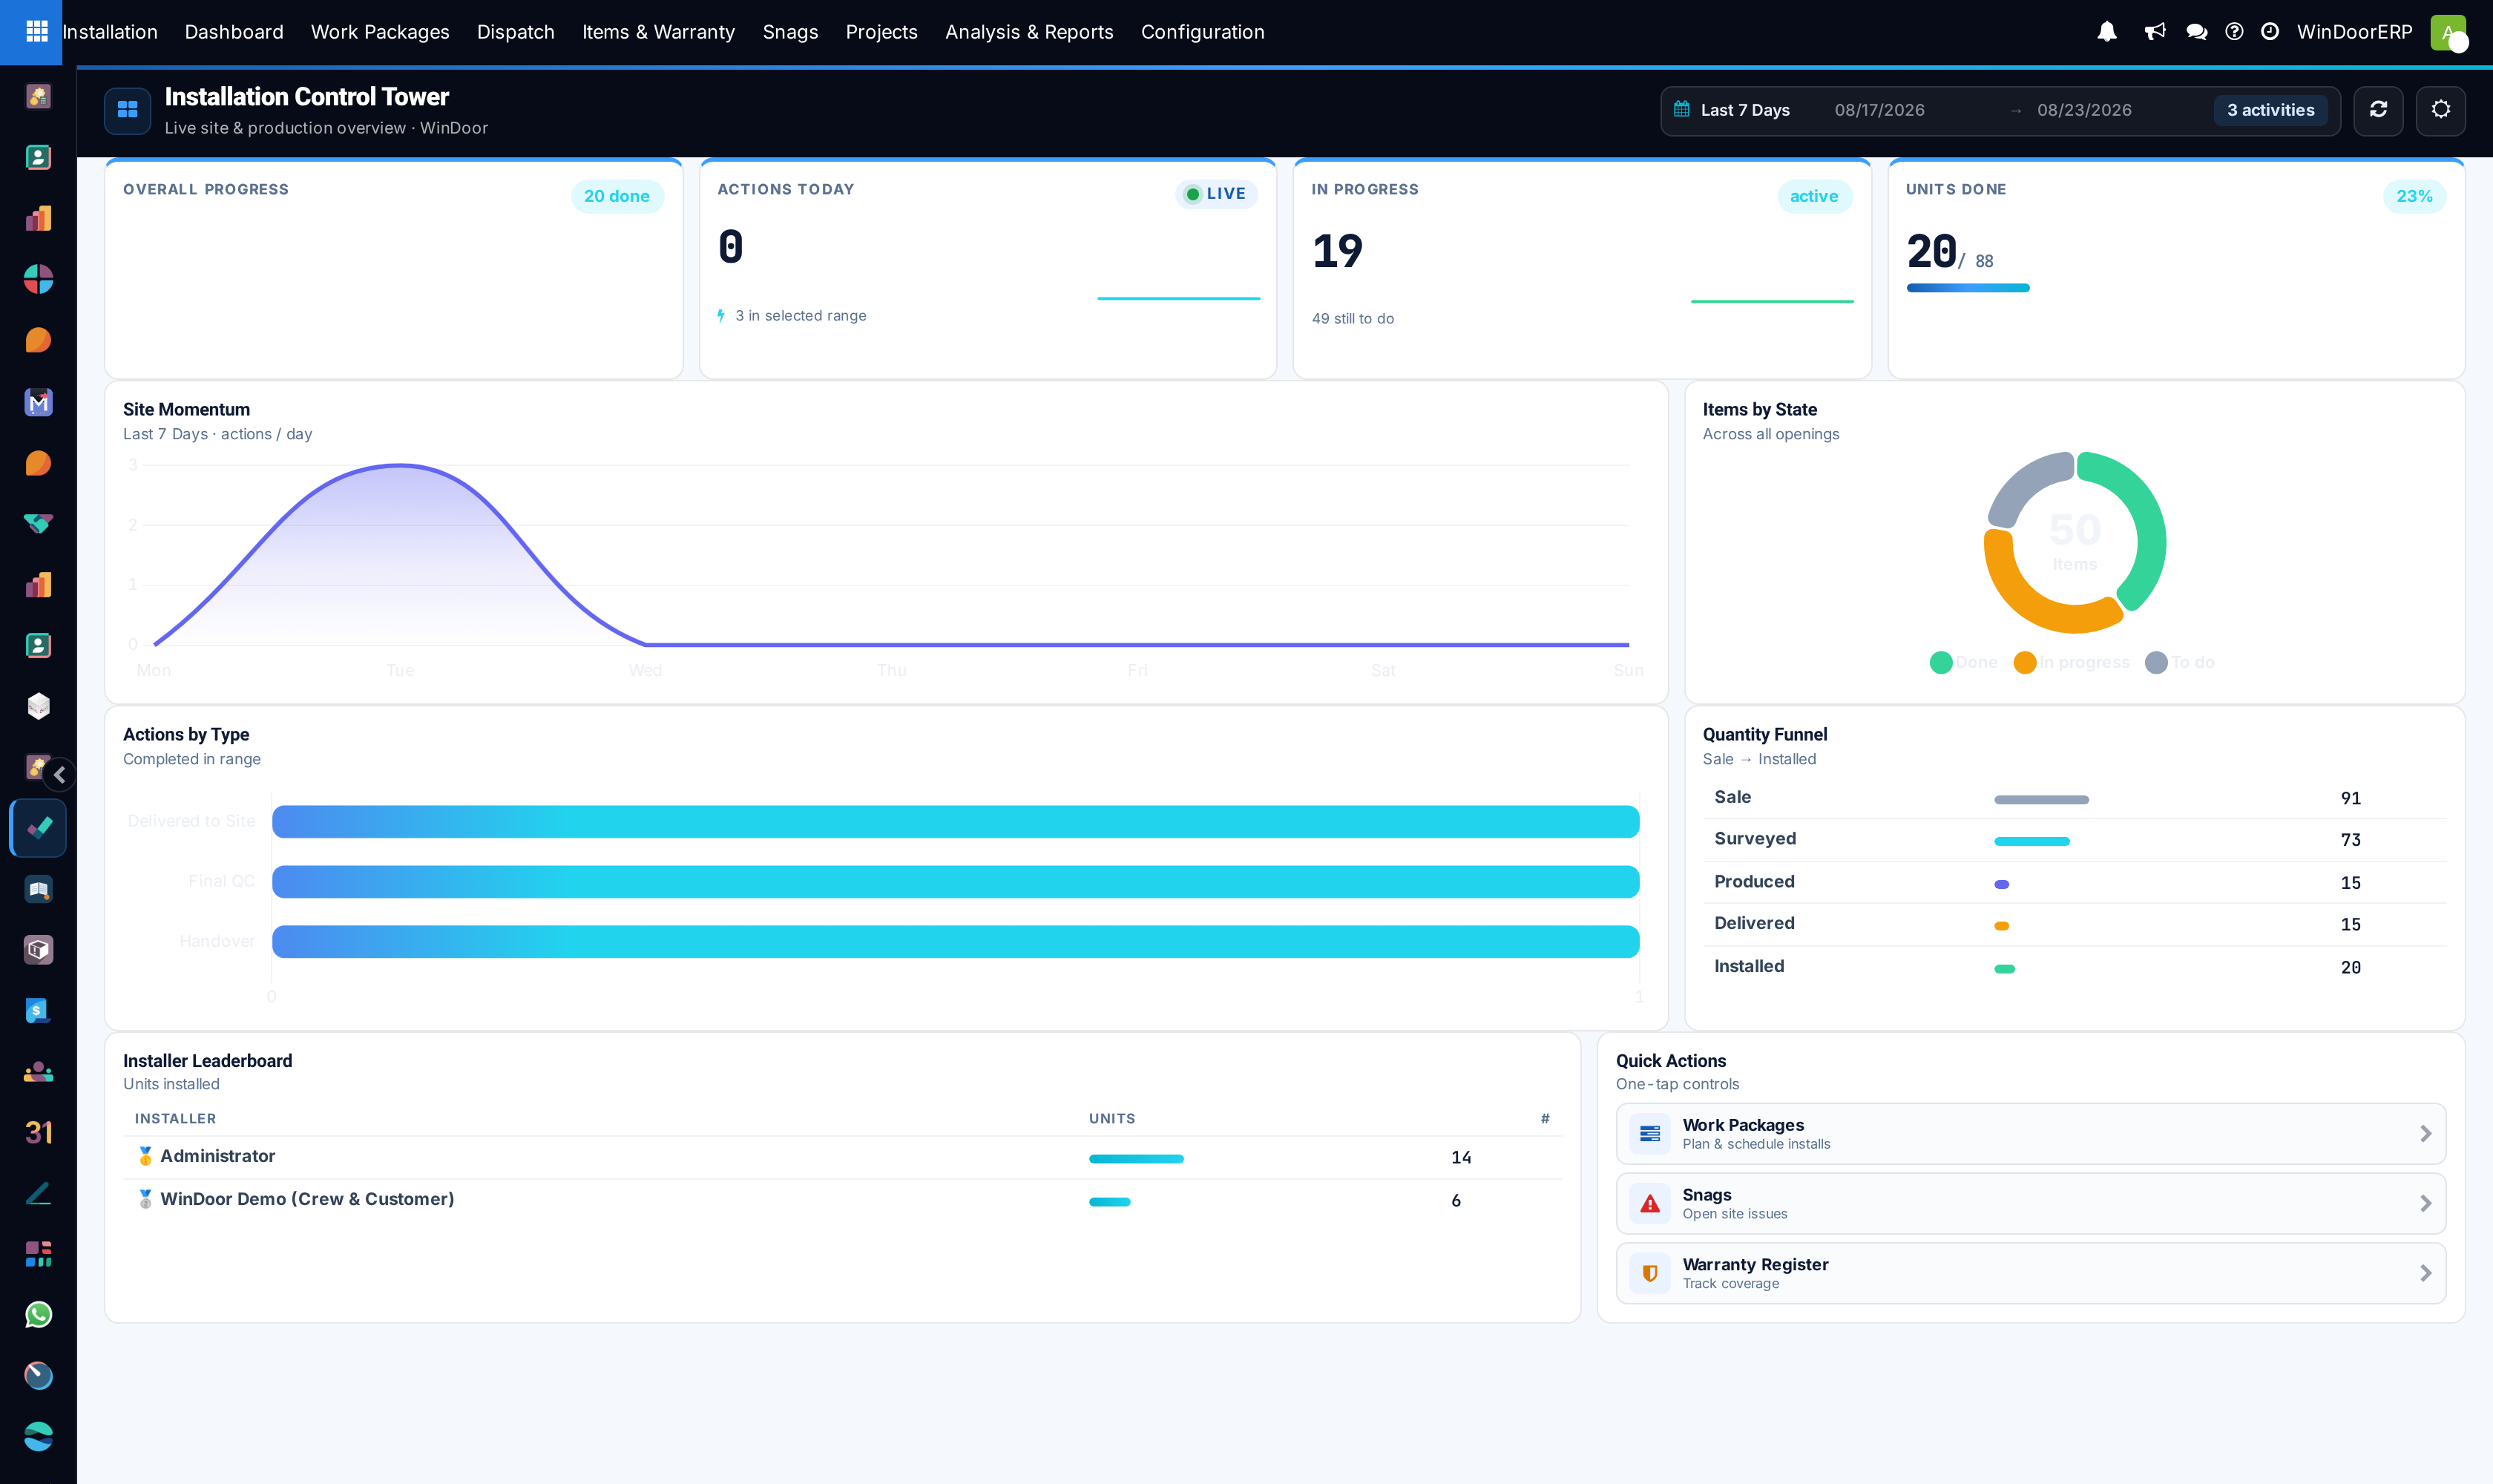
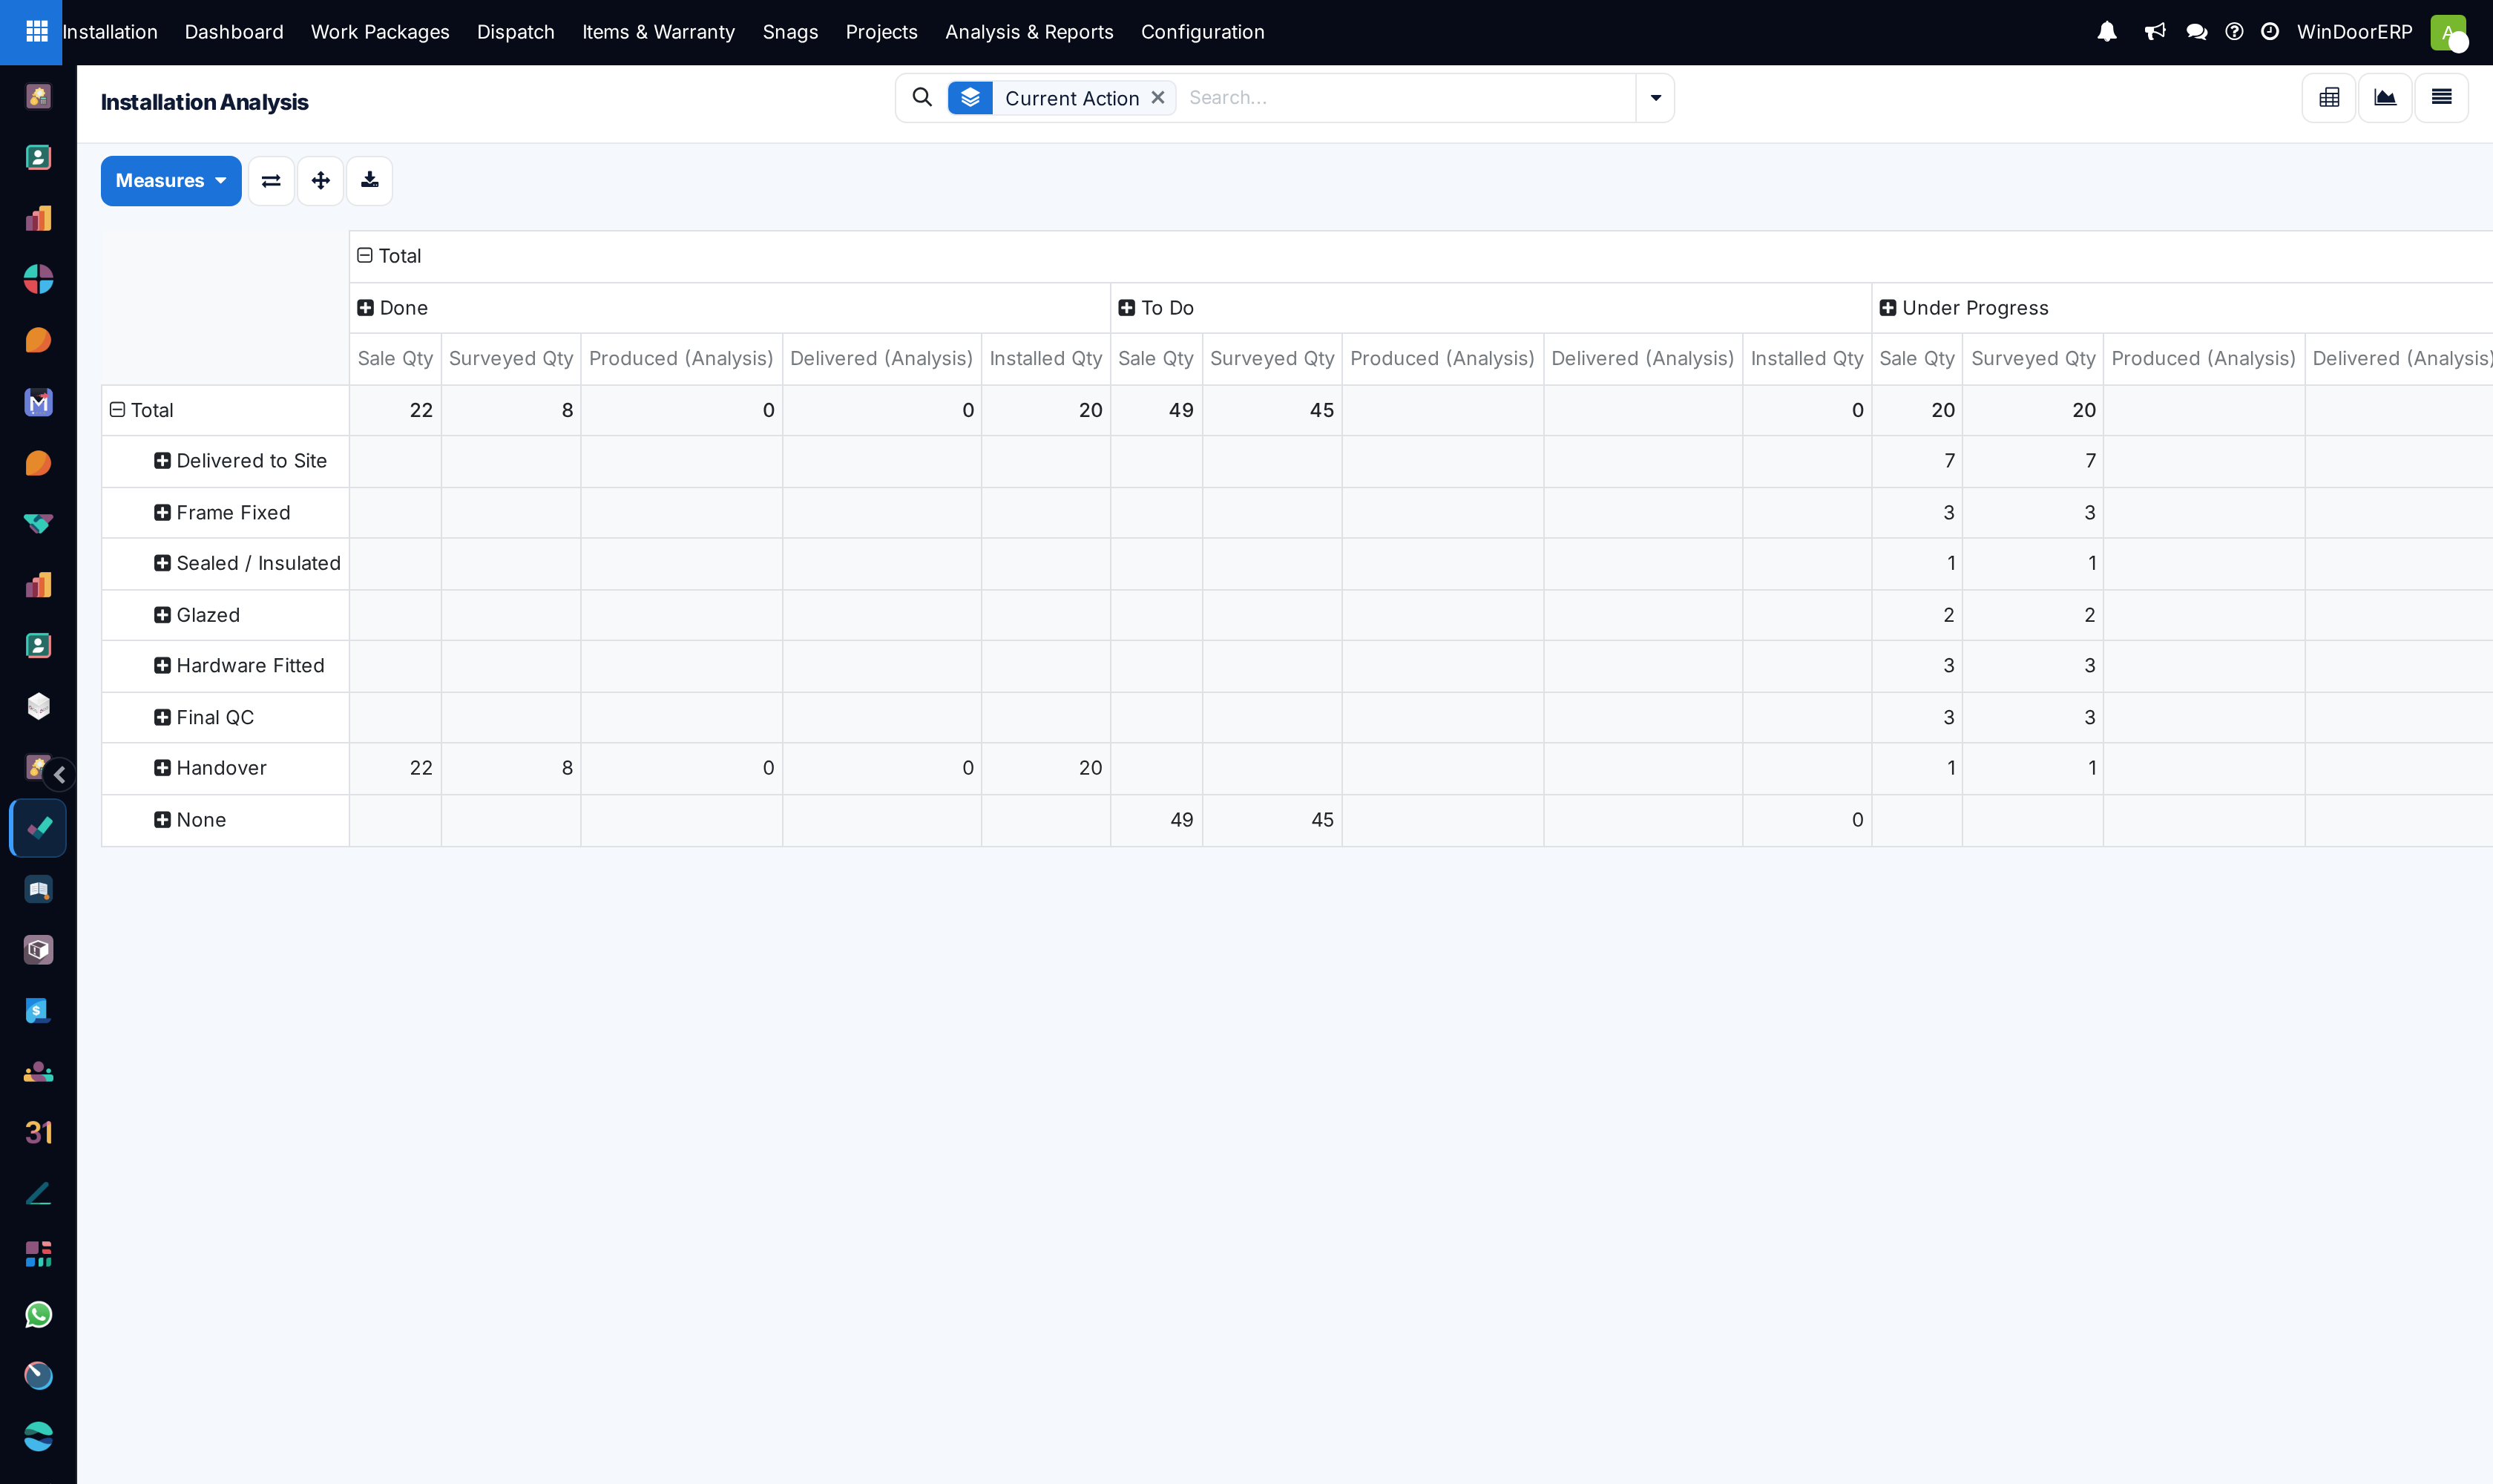
Installation › Dashboard opens the Installation Control Tower — the live overview of site work: overall progress, today's actions, work in progress and units done, a site-momentum chart of actions per day, the items-by-state ring, the Quantity Funnel from sale to installed, and the installer leaderboard. Its companion, Analysis & Reports › Analysis, is the pivot behind the funnel: sale, surveyed, produced, delivered and installed quantities per project, item and installation action.
The progress numbers — momentum, actions, items done, the leaderboard — move when installers record actions (from the portal or the backend), not when windows physically move. The funnel's earlier stages follow their own records: sale lines, approved surveys and live production counts.
Before you start
- The Installation app enabled (its feature toggle) and an installation role — plain users see their own work packages on the dashboard; managers see the company.
- Progress being recorded: an unticked site shows zeros — and note the caveat below about what an empty database shows instead.
Steps
-
01
Open Installation › Dashboard and pick the activity range (default: last 7 days).
-
02
Read the cards: Overall Progress, Actions Today (with the range count beneath), In Progress, Units Done — three of them click through to the matching item list; Actions Today is display-only.
-
03
Read Site Momentum (actions per day), Items by State, Actions by Type, and the Quantity Funnel — sale → surveyed → produced → delivered → installed, the leak points between stages being exactly where openings are stuck.
-
04
Check the Installer Leaderboard (units installed per installer) and jump from Quick Actions to Work Packages, Snags or the Warranty Register.
-
05
For the numbers behind the funnel, open Analysis & Reports › Analysis: a pivot of root items grouped by Current Action, split by state, measuring the five funnel quantities.
-
06
Before reading the Produced (Analysis) and Delivered (Analysis) columns, refresh the snapshots: open each installation item and press Refresh Lineage in its header (it also stamps the snapshot time) — the columns are stored values and stay stale until refreshed, record by record.
Reading the funnel
| Stage | What counts |
|---|---|
| Sale | Quantities from the sale lines behind the installation items. |
| Surveyed | Quantities confirmed by approved production surveys. |
| Produced / Delivered | Quantities read from production. On the dashboard these are live; in the Analysis pivot they are the manually refreshed snapshots. |
| Installed | Quantities of items whose installation is fully done. |
Reading the gaps between adjacent funnel bars — surveyed-but-not-produced, produced-but-not-dispatched, delivered-but-not-installed — is the fastest way to see where a project's openings are waiting. (The developer-mode Classic dashboard spells those three leak figures out as named fields.)
Warning
An empty database shows convincing fake numbers. When there are no installation items at all (or the data call fails), the dashboard silently renders a demonstration dataset — plausible progress, invented installer names. There is no "demo" badge. If the names on the leaderboard are nobody you employ, you are looking at the mock. The Analysis pivot never does this; it shows the usual greyed sample rows instead.
Timing quirks worth knowing
- "Today" rolls over at UTC midnight — 03:00 in Qatar. Work ticked in the small hours (midnight to 03:00 local) is attributed to the previous day, and during those hours the Today counter reads zero for the new day.
- Schedule health is refreshed nightly (a scheduled job re-derives each task's overdue/due-soon state around 00:05 Doha), so overdue states are only as fresh as the last nightly run.
- A dev-mode-only Dashboard (Classic) menu exists with the same numbers in form layout — plus extras the main dashboard lacks: the three named funnel-leak figures, an Overdue Work Packages count (which in this release over-counts by including non-installation tasks), and a By Installer throughput pivot. Normal users never see it.
Troubleshooting
| The leaderboard shows installers who don't exist | The mock dataset — there are no installation items in your view: an empty database, a failed data call, or you are a non-manager with no openings assigned to you (non-managers see only their own work). Create or assign real items, then reopen. |
|---|---|
| Produced/Delivered columns in Analysis read zero despite production being done | They are per-record snapshots. Open the items and press Refresh Lineage in the form header, then reopen the pivot. |
| A plain installer sees tiny numbers | By design — non-managers are scoped to work packages assigned to them. Managers see everything. |
| Small-hours work shows under yesterday | The UTC-midnight rollover: anything ticked between midnight and 03:00 local is permanently attributed to the previous day. Evening work before midnight counts normally. |
Common mistakes
- Screenshotting the dashboard for a report without checking the leaderboard names — the mock has fooled people before.
- Reading the Analysis snapshots as live production truth. They are as fresh as the last Refresh Lineage click.
- Expecting a milestones or velocity view — neither exists; momentum (actions/day) and the leaderboard are what the app measures.
- Reading the leaderboard as a range figure — it is current-state units installed, and the range picker does not filter it (only momentum, actions-by-type and the range count follow the range).
- Chasing the Classic dashboard's Overdue number as an exact backlog — in this release it over-counts; the Work Packages list is where the real jobs are.
Was this article helpful?
Thanks — your feedback helps.
Running a window or door factory?
Ask for a demo