Monitor after-sales service from the dashboard
What this does
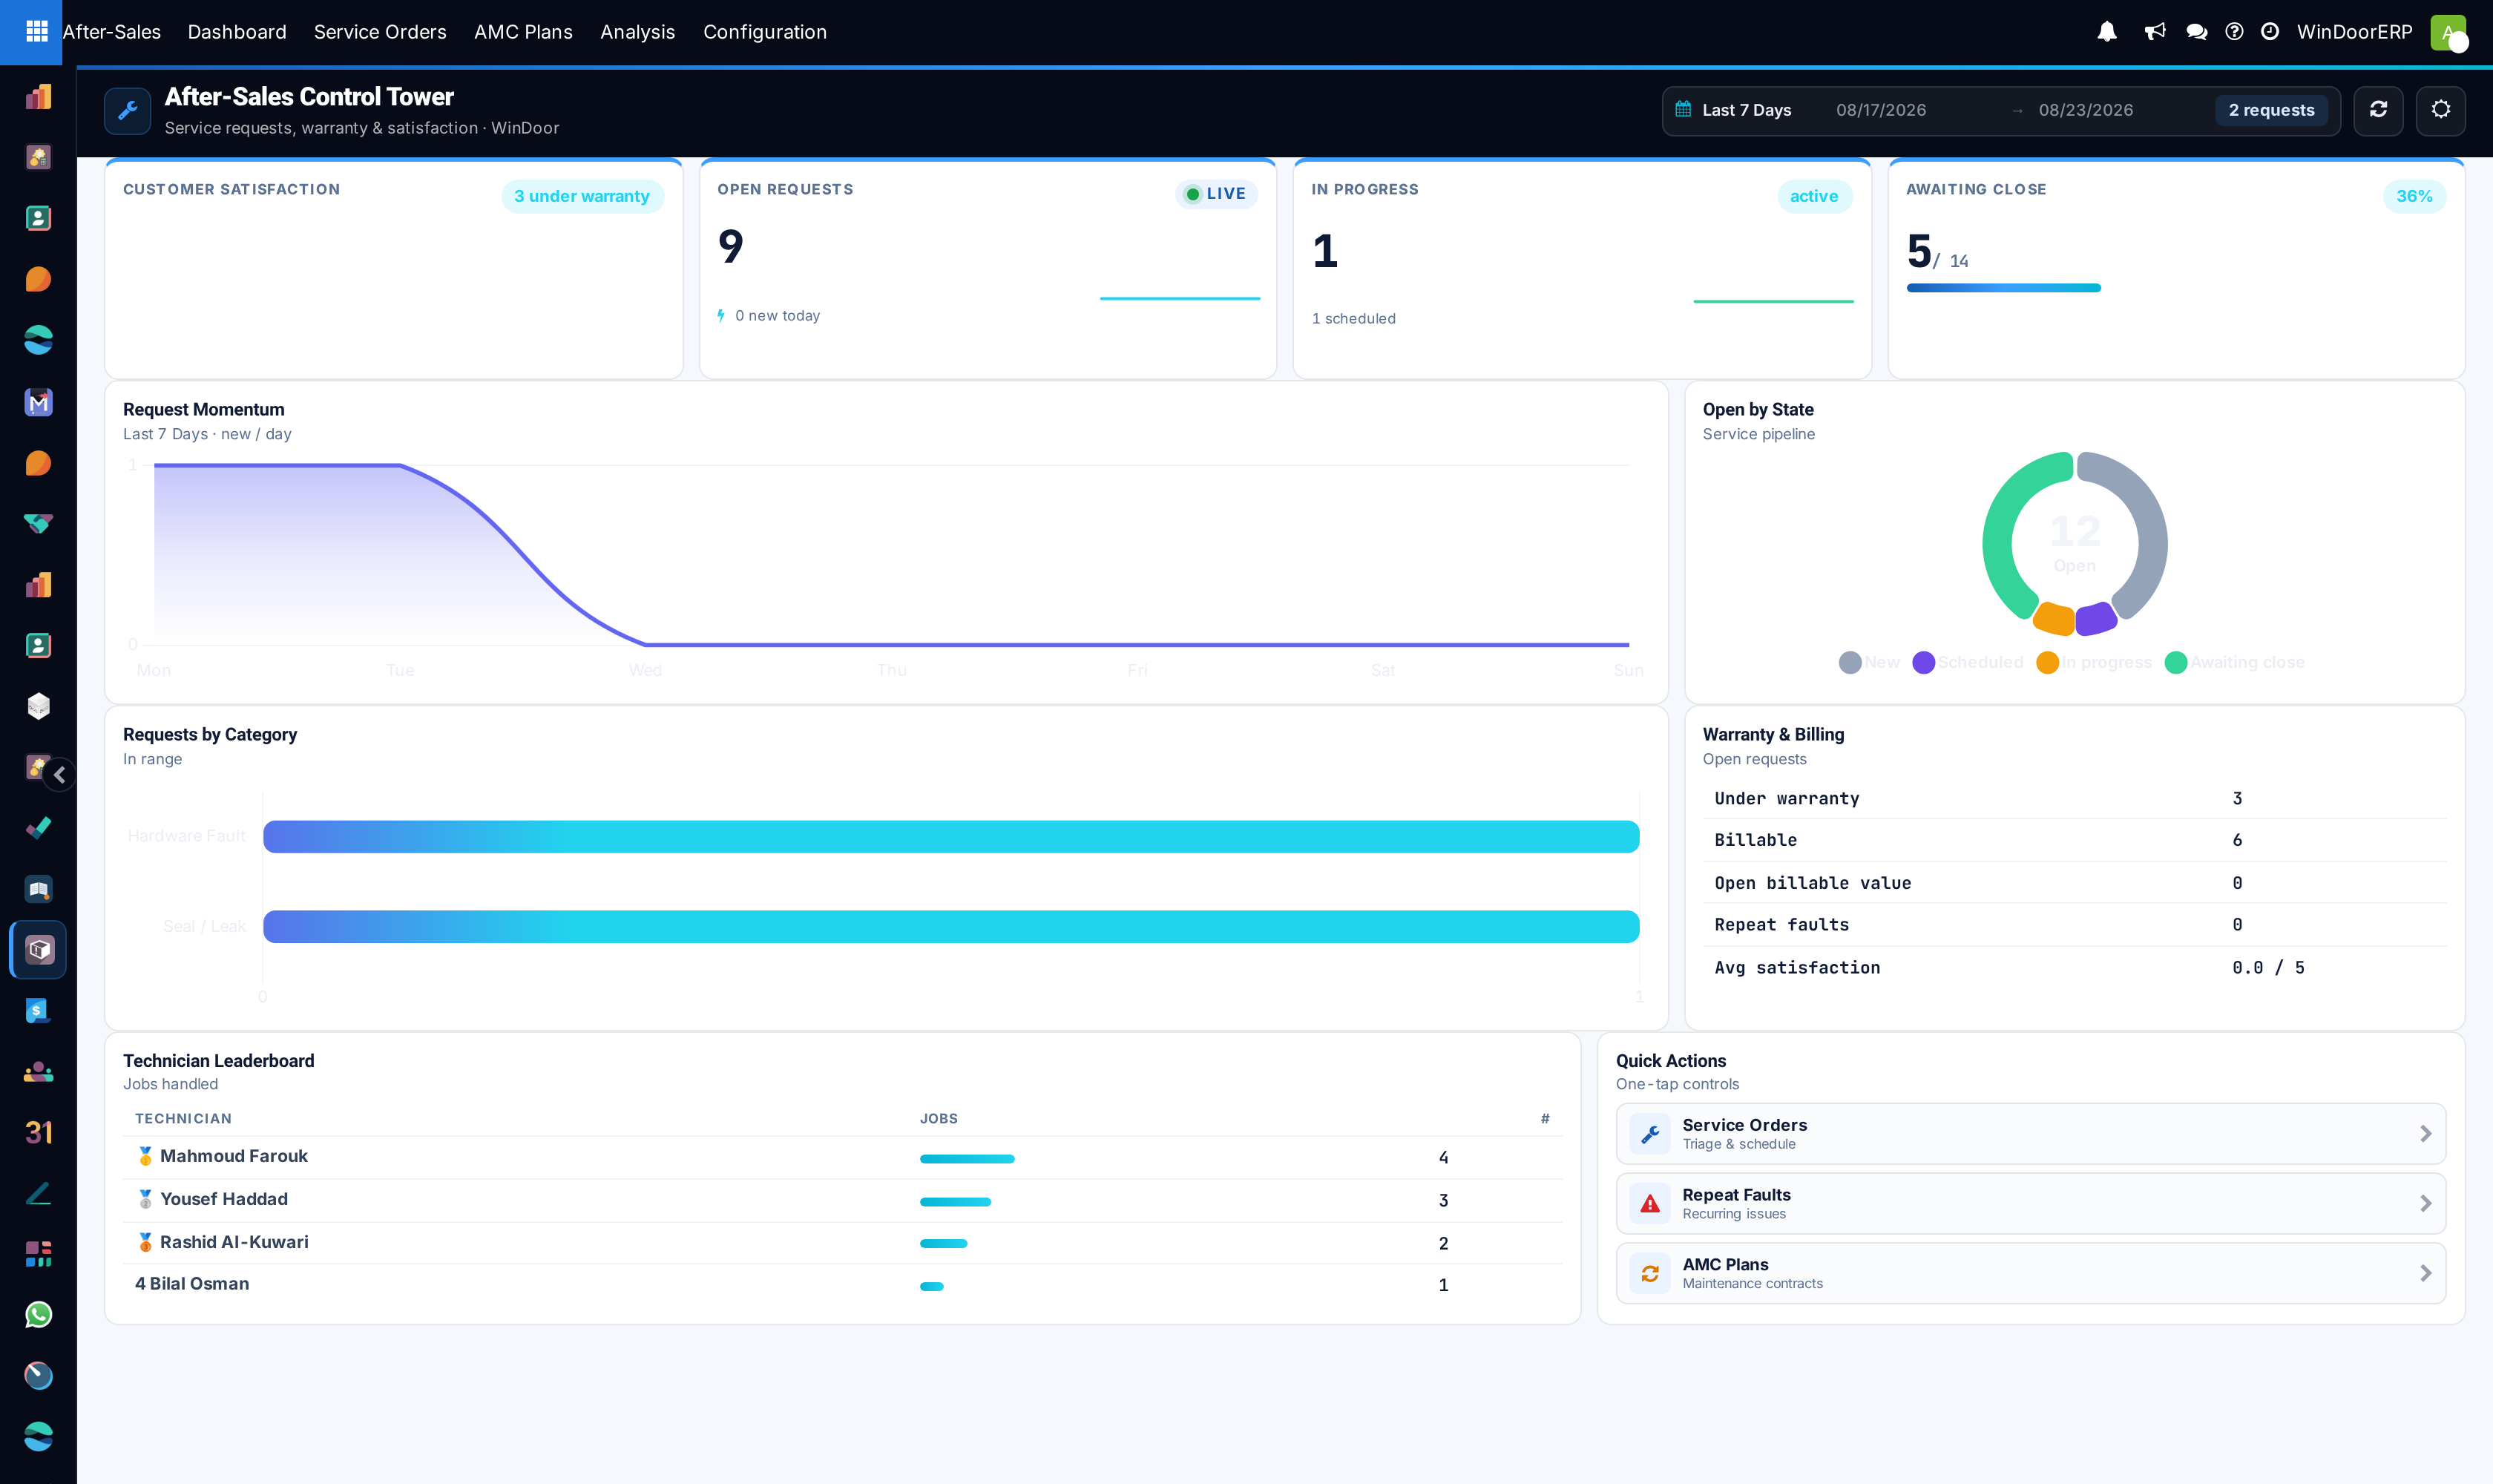
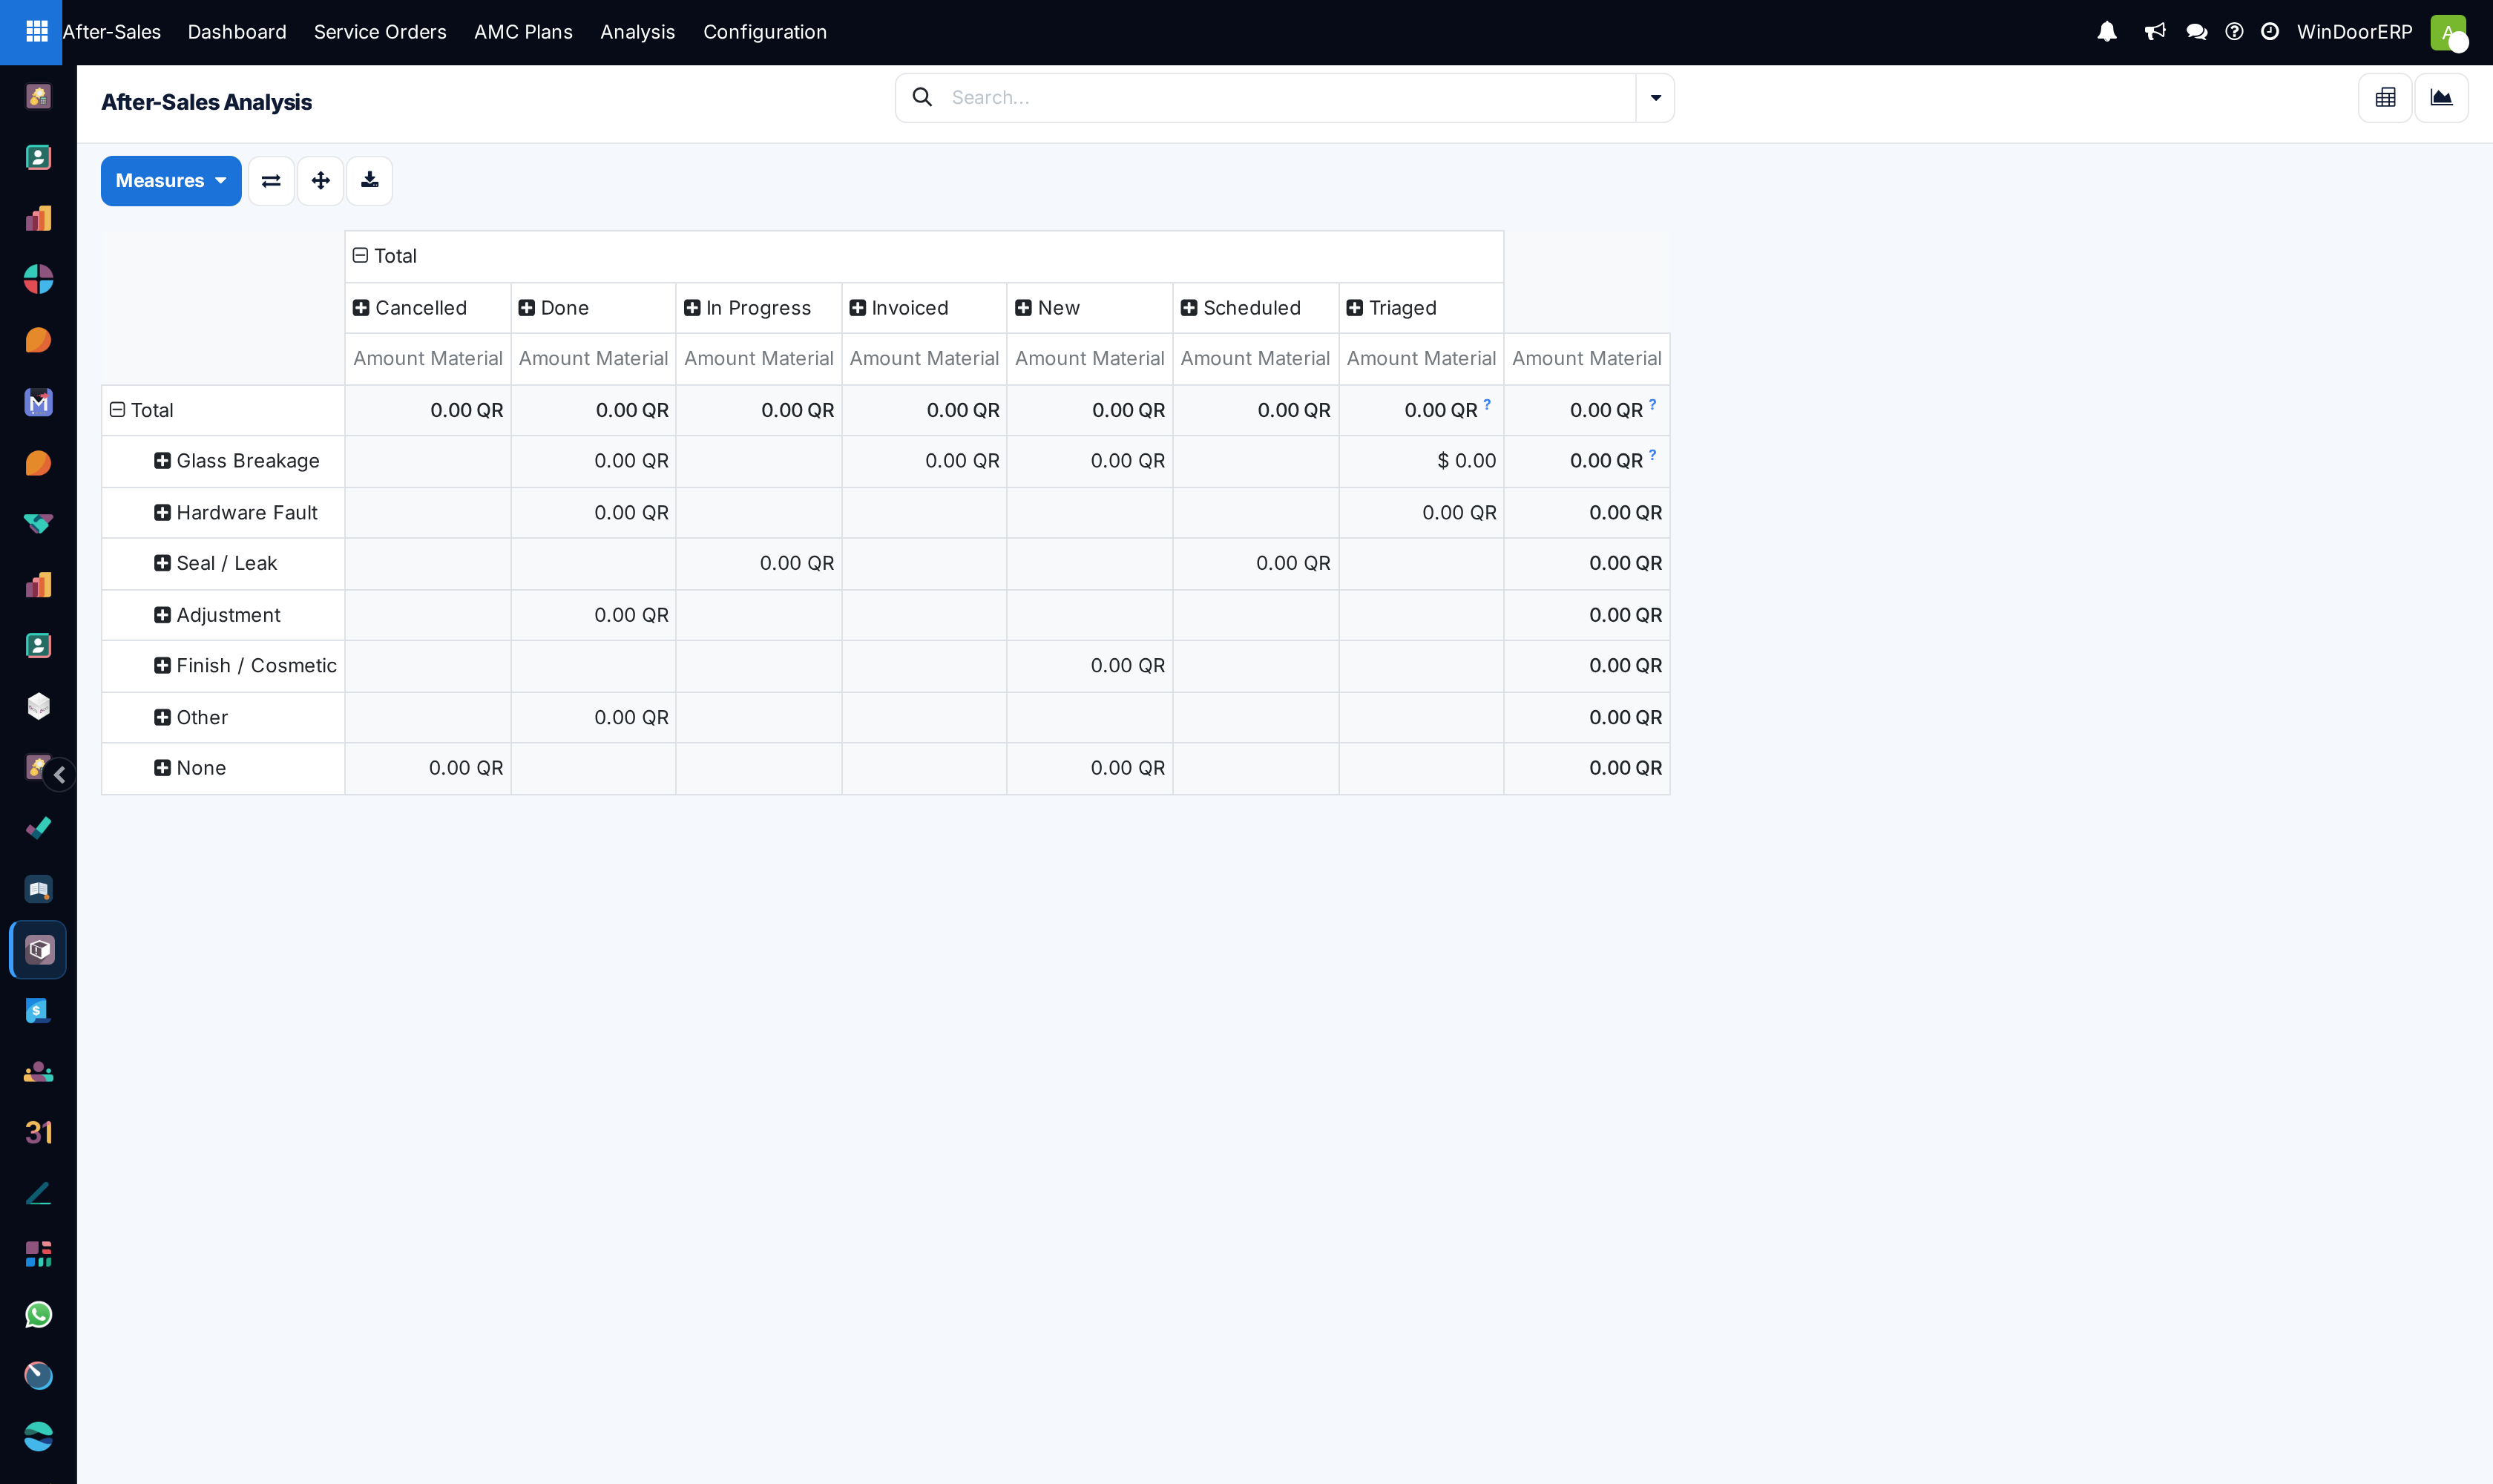
After-Sales › Dashboard opens the After-Sales Control Tower: the live picture of service work — open requests, jobs in progress and awaiting close, request momentum, the open-by-state ring, requests by category, the warranty-versus-billable split, repeat faults and average customer satisfaction, plus the technician leaderboard. After-Sales › Analysis is the pivot behind it: service orders crossed by category and status, measuring material cost.
Every figure comes from the Service Orders themselves. There is no survey machinery and no response-time clock in this app: satisfaction is the 1–5 rating captured at customer sign-off, and time is measured only by the order dates the team maintains.
Before you start
- The After-Sales service role — plain users see their own assigned orders on the dashboard; service managers see the company.
- Service orders being worked honestly: states advanced, sign-offs collected — the dashboard measures the pipeline discipline as much as the service itself.
Steps
-
01
Open After-Sales › Dashboard and pick the range (default last 7 days). The range scopes only the momentum chart, the category bars and the header's request counter — every KPI card is a live snapshot.
-
02
Read the cards: Customer Satisfaction (average of sign-off ratings), Open Requests with today's new count, In Progress, and Awaiting Close — done jobs not yet closed out.
-
03
Read Request Momentum (new requests per day) and Requests by Category for the range, and the live Open by State ring — its segments are New / Scheduled / In Progress / Done, so it draws Awaiting-Close jobs but not Triaged ones, and its total will differ from the Open Requests card.
-
04
Check the Warranty & Billing block: open orders under warranty versus billable, the open billable value, and repeat faults. (Satisfaction has its own card, first in the row.)
-
05
Use the Technician Leaderboard (jobs handled) and the quick actions — Service Orders, Repeat Faults, AMC Plans — to jump into the work.
-
06
For cross-tables, open After-Sales › Analysis: categories against statuses, measuring Amount Material — add Count from Measures when you want volumes rather than money.
What the numbers mean
| Figure | Definition |
|---|---|
| Open Requests | Orders in New, Triaged, Scheduled or In Progress. |
| Awaiting Close | Work finished, order not yet closed — the admin backlog. |
| Customer Satisfaction | The mean of the 1–5 rating customers give at sign-off (backend or portal), over up to the most recent 2,000 rated orders. No surveys are sent; unsigned jobs contribute nothing. |
| Under warranty / Billable | An open order is covered only when it has affected items and every one is in warranty; an order with none recorded counts as billable. Open billable value sums those orders' material totals. |
| Repeat faults | Orders flagged because the same product already had two earlier services — since completed — raised within the last 12 months; the third raises the flag (and a quality non-conformance where that module is present). |
| Today's new / completed | Created today, and orders in Done, Invoiced or Closed written today — a later edit to an old completed order re-counts it, so read "completed today" as approximate. Both roll over at UTC midnight (03:00 in Qatar). |
Note
A dev-mode-only Dashboard (Classic) exists with the same figures in form layout; normal users never see it. Unlike the Installation dashboard, this one shows real zeros on an empty database — its demonstration fallback appears only if the data call itself fails. The Analysis screen behaves the other way around: its chart and pivot render greyed sample data while no service orders exist.
Troubleshooting
| Satisfaction reads 0.0 despite happy customers | No sign-off ratings recorded — the gauge averages only orders signed off with a rating. |
|---|---|
| Repeat faults stays at zero | The flag needs the same product on a third service within 12 months, and earlier services completed. Serviced-by-description orders without the product set never match. |
| "Completed today" seems too high | It counts done-state orders written today — bulk edits to old completed orders inflate it. |
| An order shows billable although the customer has warranty | Coverage requires every affected item in warranty; one out-of-warranty item makes the order billable. Both flags are editable on the order when judgment says otherwise. |
| The Analysis totals are money, not counts | The default measure is material cost. Add Count in Measures for volumes. |
| A technician is missing from the leaderboard | It ranks the top six technicians by non-cancelled orders overall — the range picker does not filter it, so assignment (not the range) is what moves it. |
Common mistakes
- Quoting a "first-response time" from this app — no such measure exists anywhere in it; the dates it has are creation, the customer's preferred date, scheduling and sign-off.
- Reading satisfaction as a survey programme. It is the sign-off rating; if technicians skip sign-off, the gauge starves.
- Treating Awaiting Close as work remaining — the work is done; what remains is closing the paperwork.
- Comparing technicians on job counts alone when categories differ wildly in effort.
- Reading the material total as revenue — it is material cost on the orders; labour is not priced in this app.
Was this article helpful?
Thanks — your feedback helps.
Running a window or door factory?
Ask for a demo