Read and share the built-in dashboards
What this does
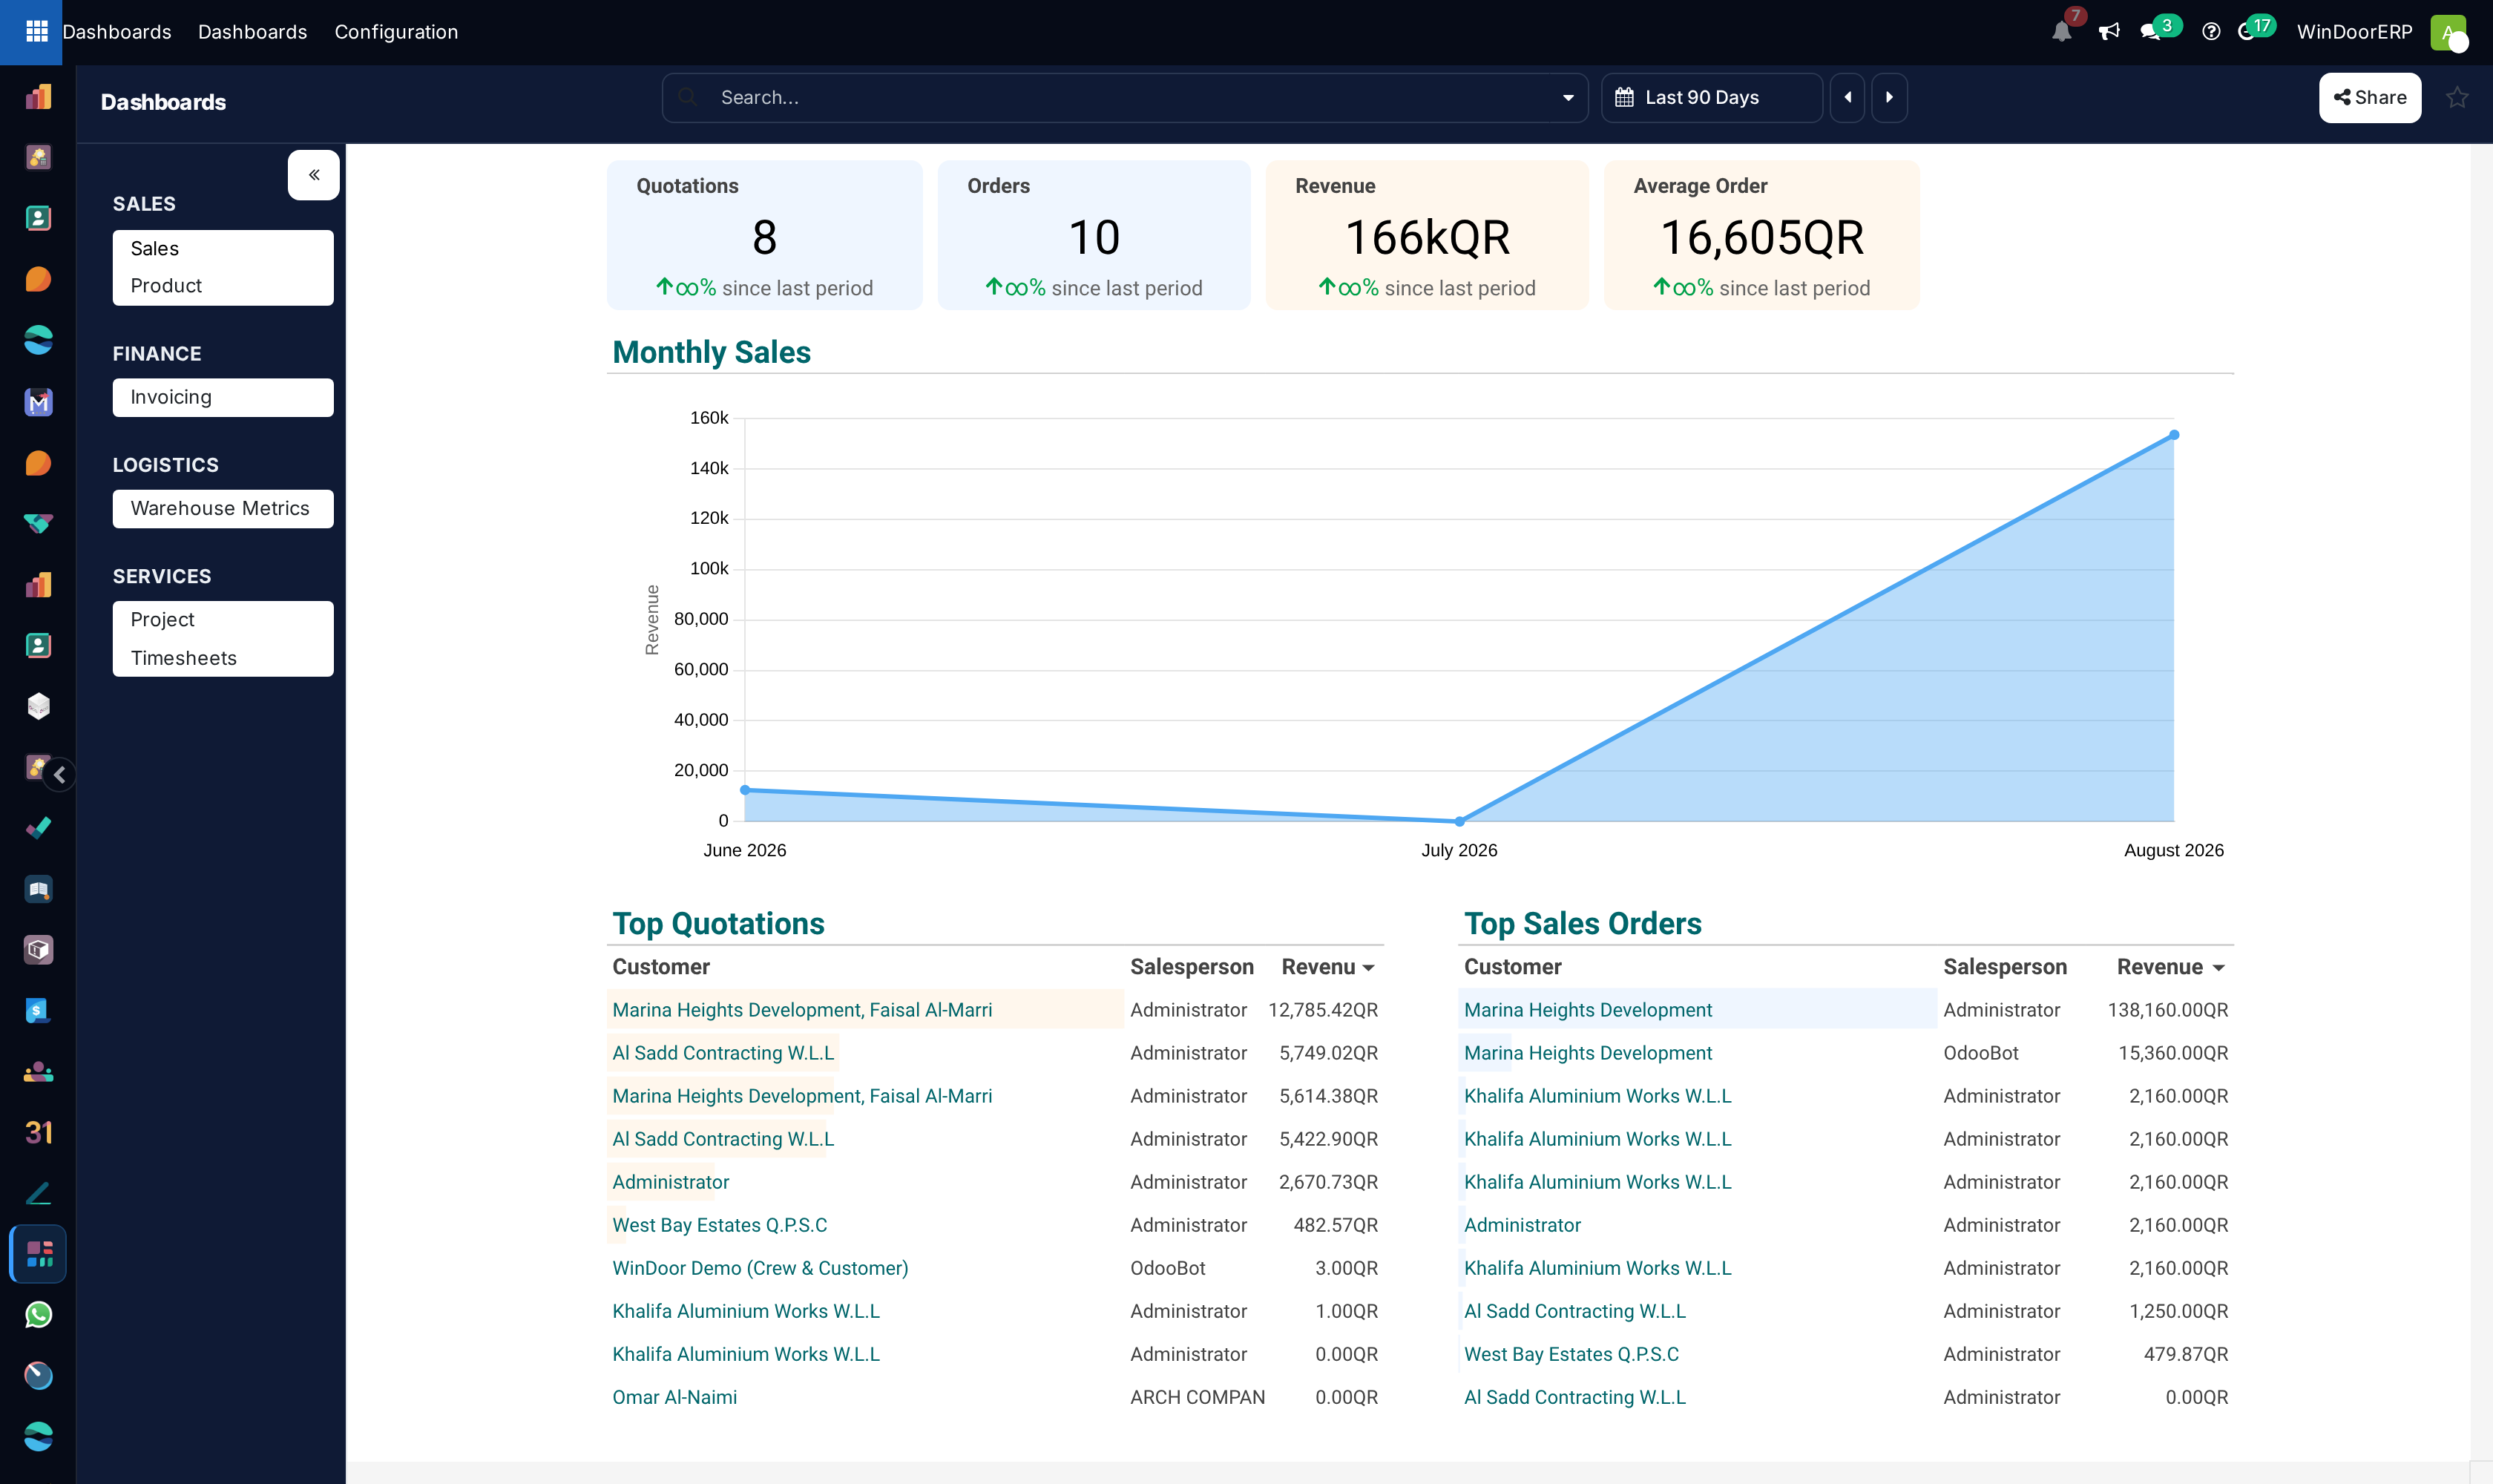
The Dashboards app is a viewer for ready-made, spreadsheet-based dashboards whose charts, KPI cards and tables pull live data from the database. Six boards ship on this platform — Sales and Product (Sales section), Invoicing (Finance), Warehouse Metrics (Logistics), Project and Timesheets (Services) — each visible only to users holding its app's manager- or supervisor-level role.
Be clear about what it is not: in this edition the boards are read-only. You can filter, drill, favourite, share and export them — you cannot edit their figures, add KPI cards, or build new dashboards from the interface. The Configuration menu manages sections, access and publication of the existing boards, nothing more.
Before you start
- The role matching the board: Sales/Product need sales management rights, Invoicing accounting access, Warehouse Metrics stock management, Project and Timesheets the timesheet-approver role. A user with none of these opens an empty app.
- Data in the underlying app — most boards show a built-in sample version of themselves while their source records are empty (the Project board is the exception: it simply shows empty figures).
Steps
-
01
Open Dashboards and pick a board from the sidebar sections.
-
02
Set the filters in the top bar — most boards carry a period filter (Warehouse Metrics has none), and most add relational ones (customer, product, salesperson, team…). Filters are defined inside each board; you can set their values but not add new ones.
-
03
Drill into anything clickable: table cells and chart segments open the underlying records; charts also link to their source app's menu.
-
04
Star a board to pin it — starred boards collect into a Favorites section at the top of the sidebar and open first.
-
05
Share hands out a frozen public link to the board as it looks right now — anyone with the URL can view it without logging in; downloading the XLSX requires signing in as an internal user with export rights.
-
06
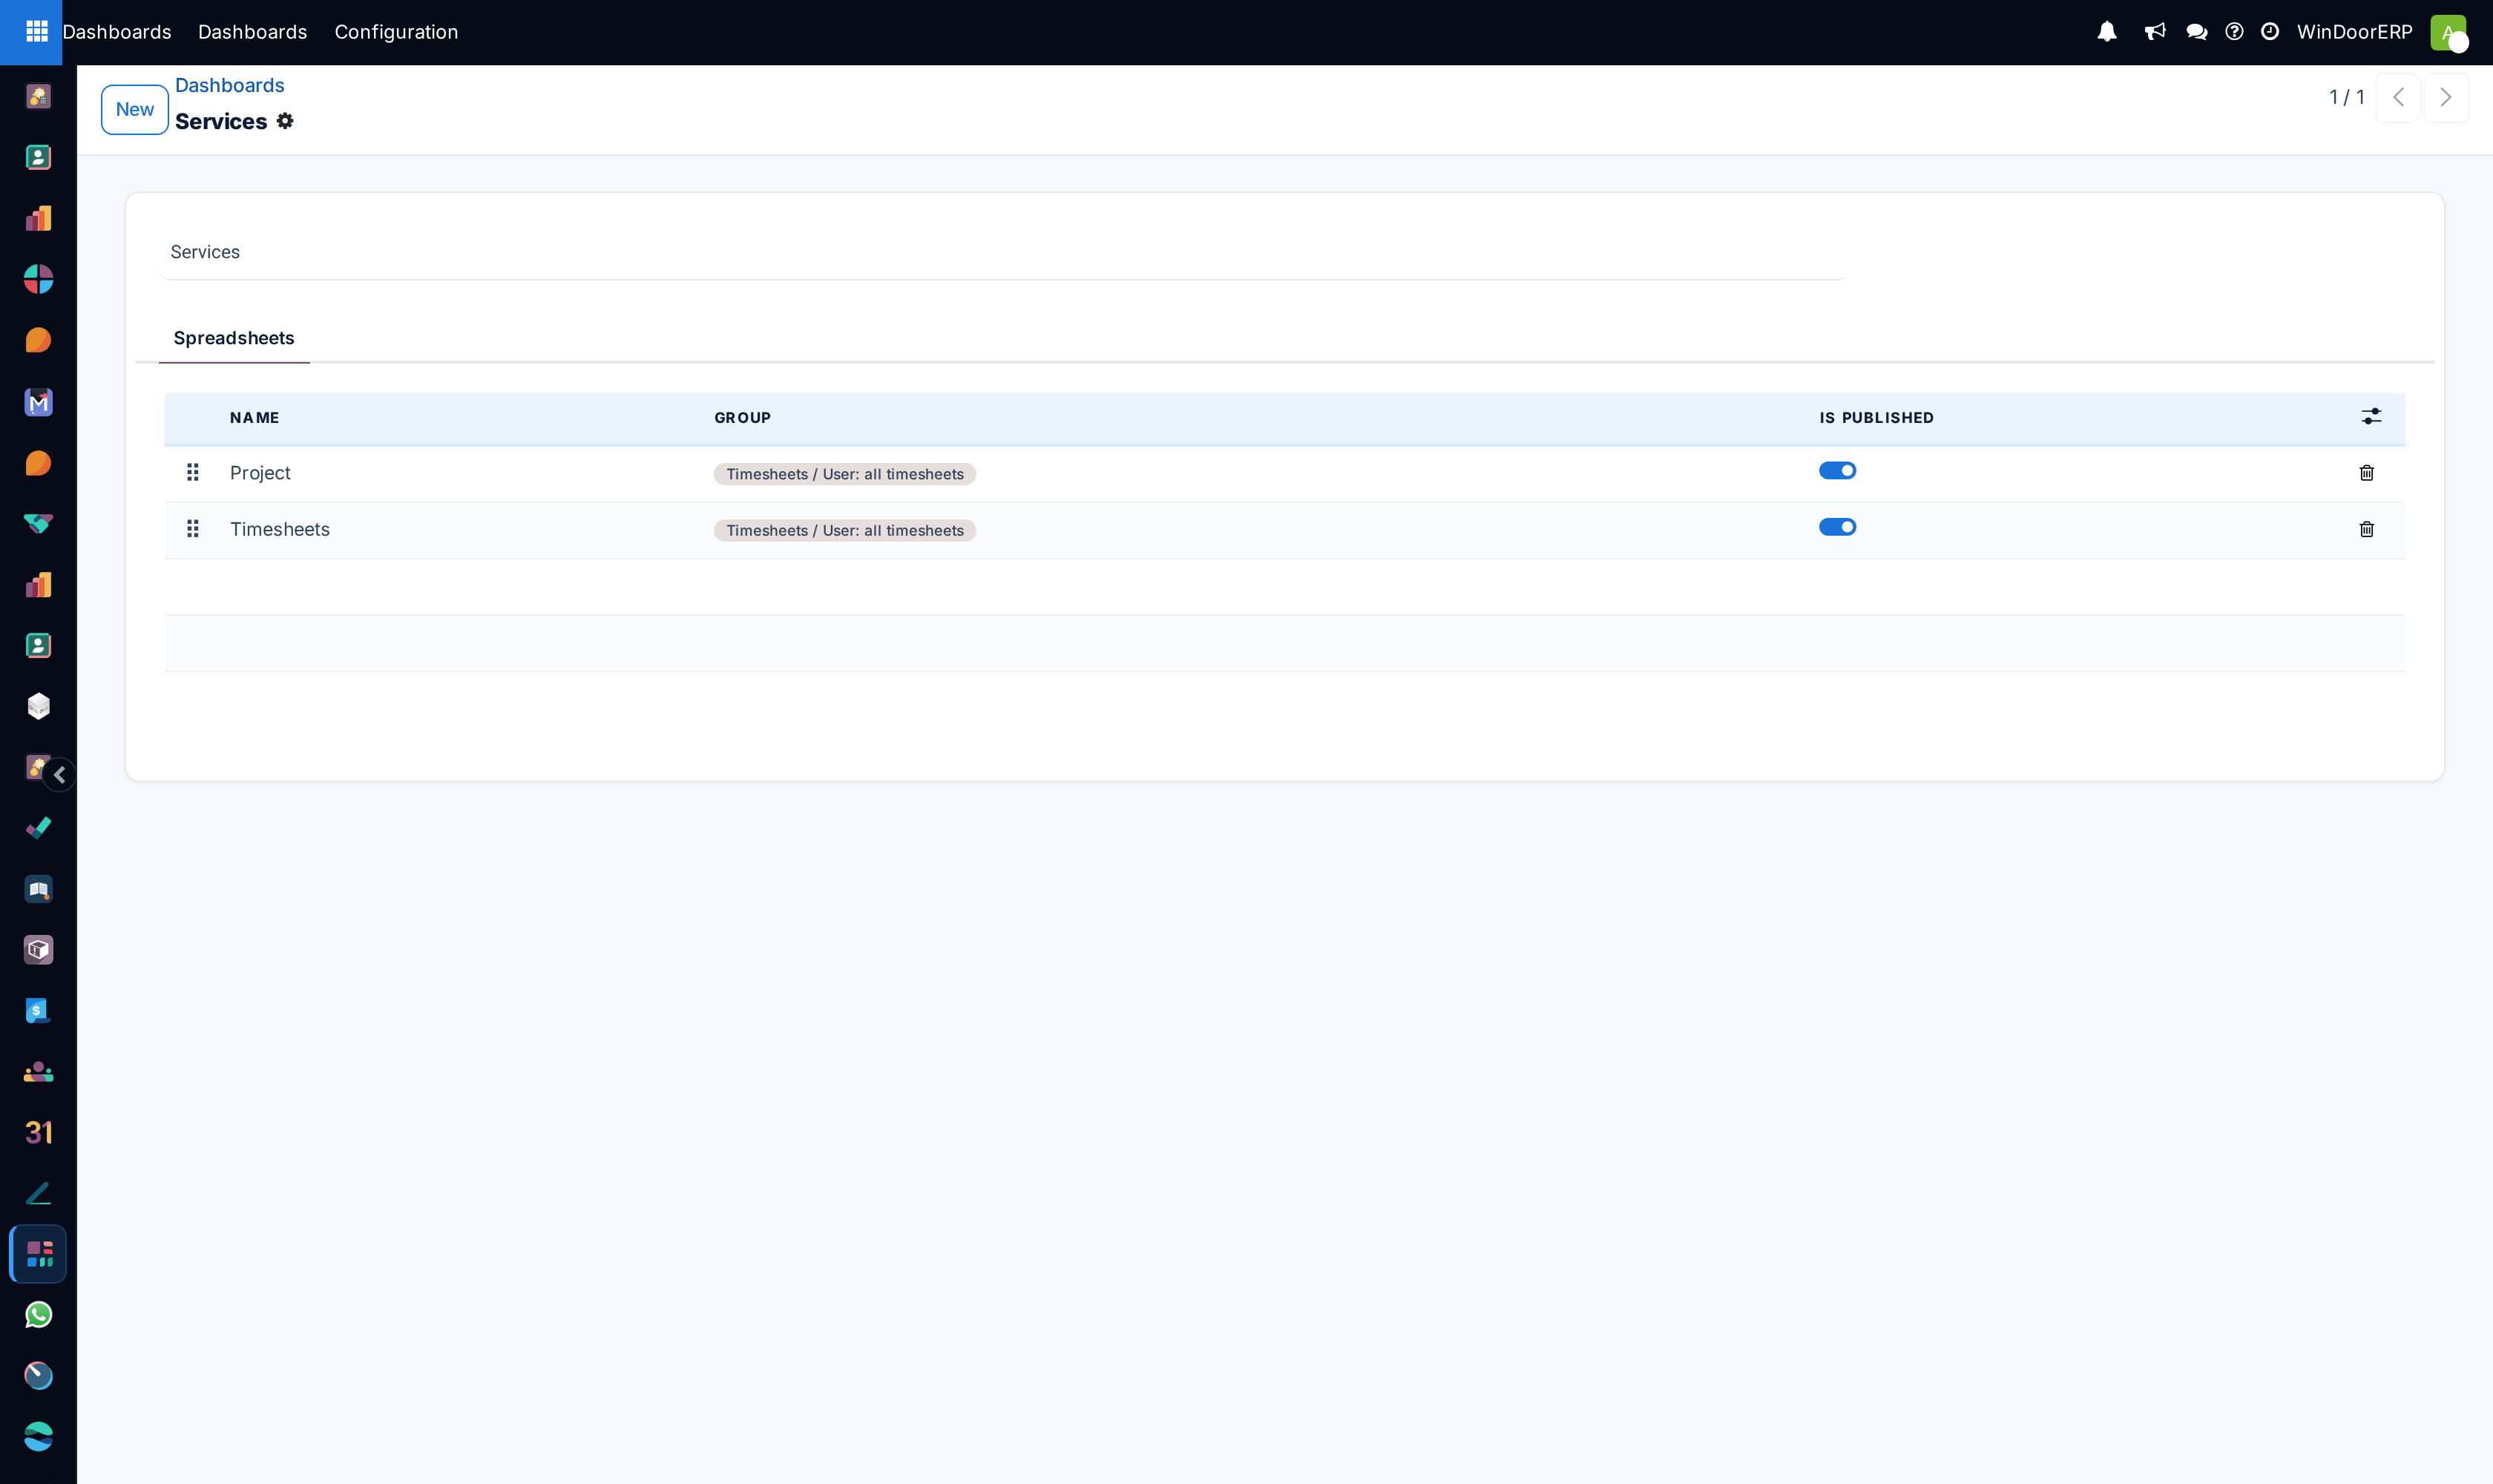
Administrators: Configuration › Dashboards lists the sections; inside one you can rename boards, set their access groups and companies, and toggle Is Published. New sections can be created; new dashboards cannot — boards arrive with modules, not from this form.
The shipped boards
| Board | Section | Who sees it |
|---|---|---|
| Sales, Product | Sales | Sales managers |
| Invoicing | Finance | Accounting read access, or Billing users |
| Warehouse Metrics | Logistics | Inventory managers |
| Project, Timesheets | Services | Timesheet approvers |
There is no CRM board — pipeline analytics live in CRM › Reporting. Empty sections (Marketing, Website, Human Resources) exist only in Configuration; the viewer's sidebar hides sections with nothing published. What each user sees is filtered per board by its access groups, so two colleagues can legitimately open different-looking apps.
Important
A shared link is a snapshot — it freezes the board at the moment of sharing and stays viewable by anyone holding the URL, login or not (it dies only if the sharer's own access is later revoked). Treat shares of financial boards accordingly; there is no expiry control in the interface.
Troubleshooting
| The app opens empty | None of the shipped boards' access groups match your roles. An administrator can widen a board's groups in Configuration. |
|---|---|
| A board shows generic-looking data that isn't yours | The sample version — its source records are empty (for example, a Timesheets board before any timesheet exists). It disappears once real data arrives. (The Project board has no sample and shows empty figures instead.) |
| No pencil / no way to edit a board | Correct for this edition — the boards are read-only; editing them is not included. |
| Configuration has no button to add a dashboard | Also correct: sections can be created, boards cannot. New boards come from installed modules. |
| The Configuration menu is visible to a normal user | It opens, but everything in it is read-only without the Dashboard admin privilege — access control here is on the records, not the menu. |
| Numbers differ from the source app's own reports | Check the board's period filter first — most default to a rolling 30- or 90-day window, not all time (and Warehouse Metrics has no period filter at all). |
Common mistakes
- Promising stakeholders "custom executive dashboards" from this app — composing new boards is not an interface feature in this edition; custom KPIs are built in the source apps' reporting views or delivered as modules.
- Sharing a link as a "live report" — it is frozen at share time; share again for fresh numbers.
- Reading a sample board as real zeros (or real numbers) — if the data looks plausible but unfamiliar, check whether the source app has any records at all.
- Granting a board to everyone by adding a broad access group and forgetting the underlying figures were management-only.
- Hunting for the boards' numbers in Excel exports while the drill-through would have opened the exact records in one click.
Was this article helpful?
Thanks — your feedback helps.
Running a window or door factory?
Ask for a demo