Find defect patterns in the quality analysis
What this does
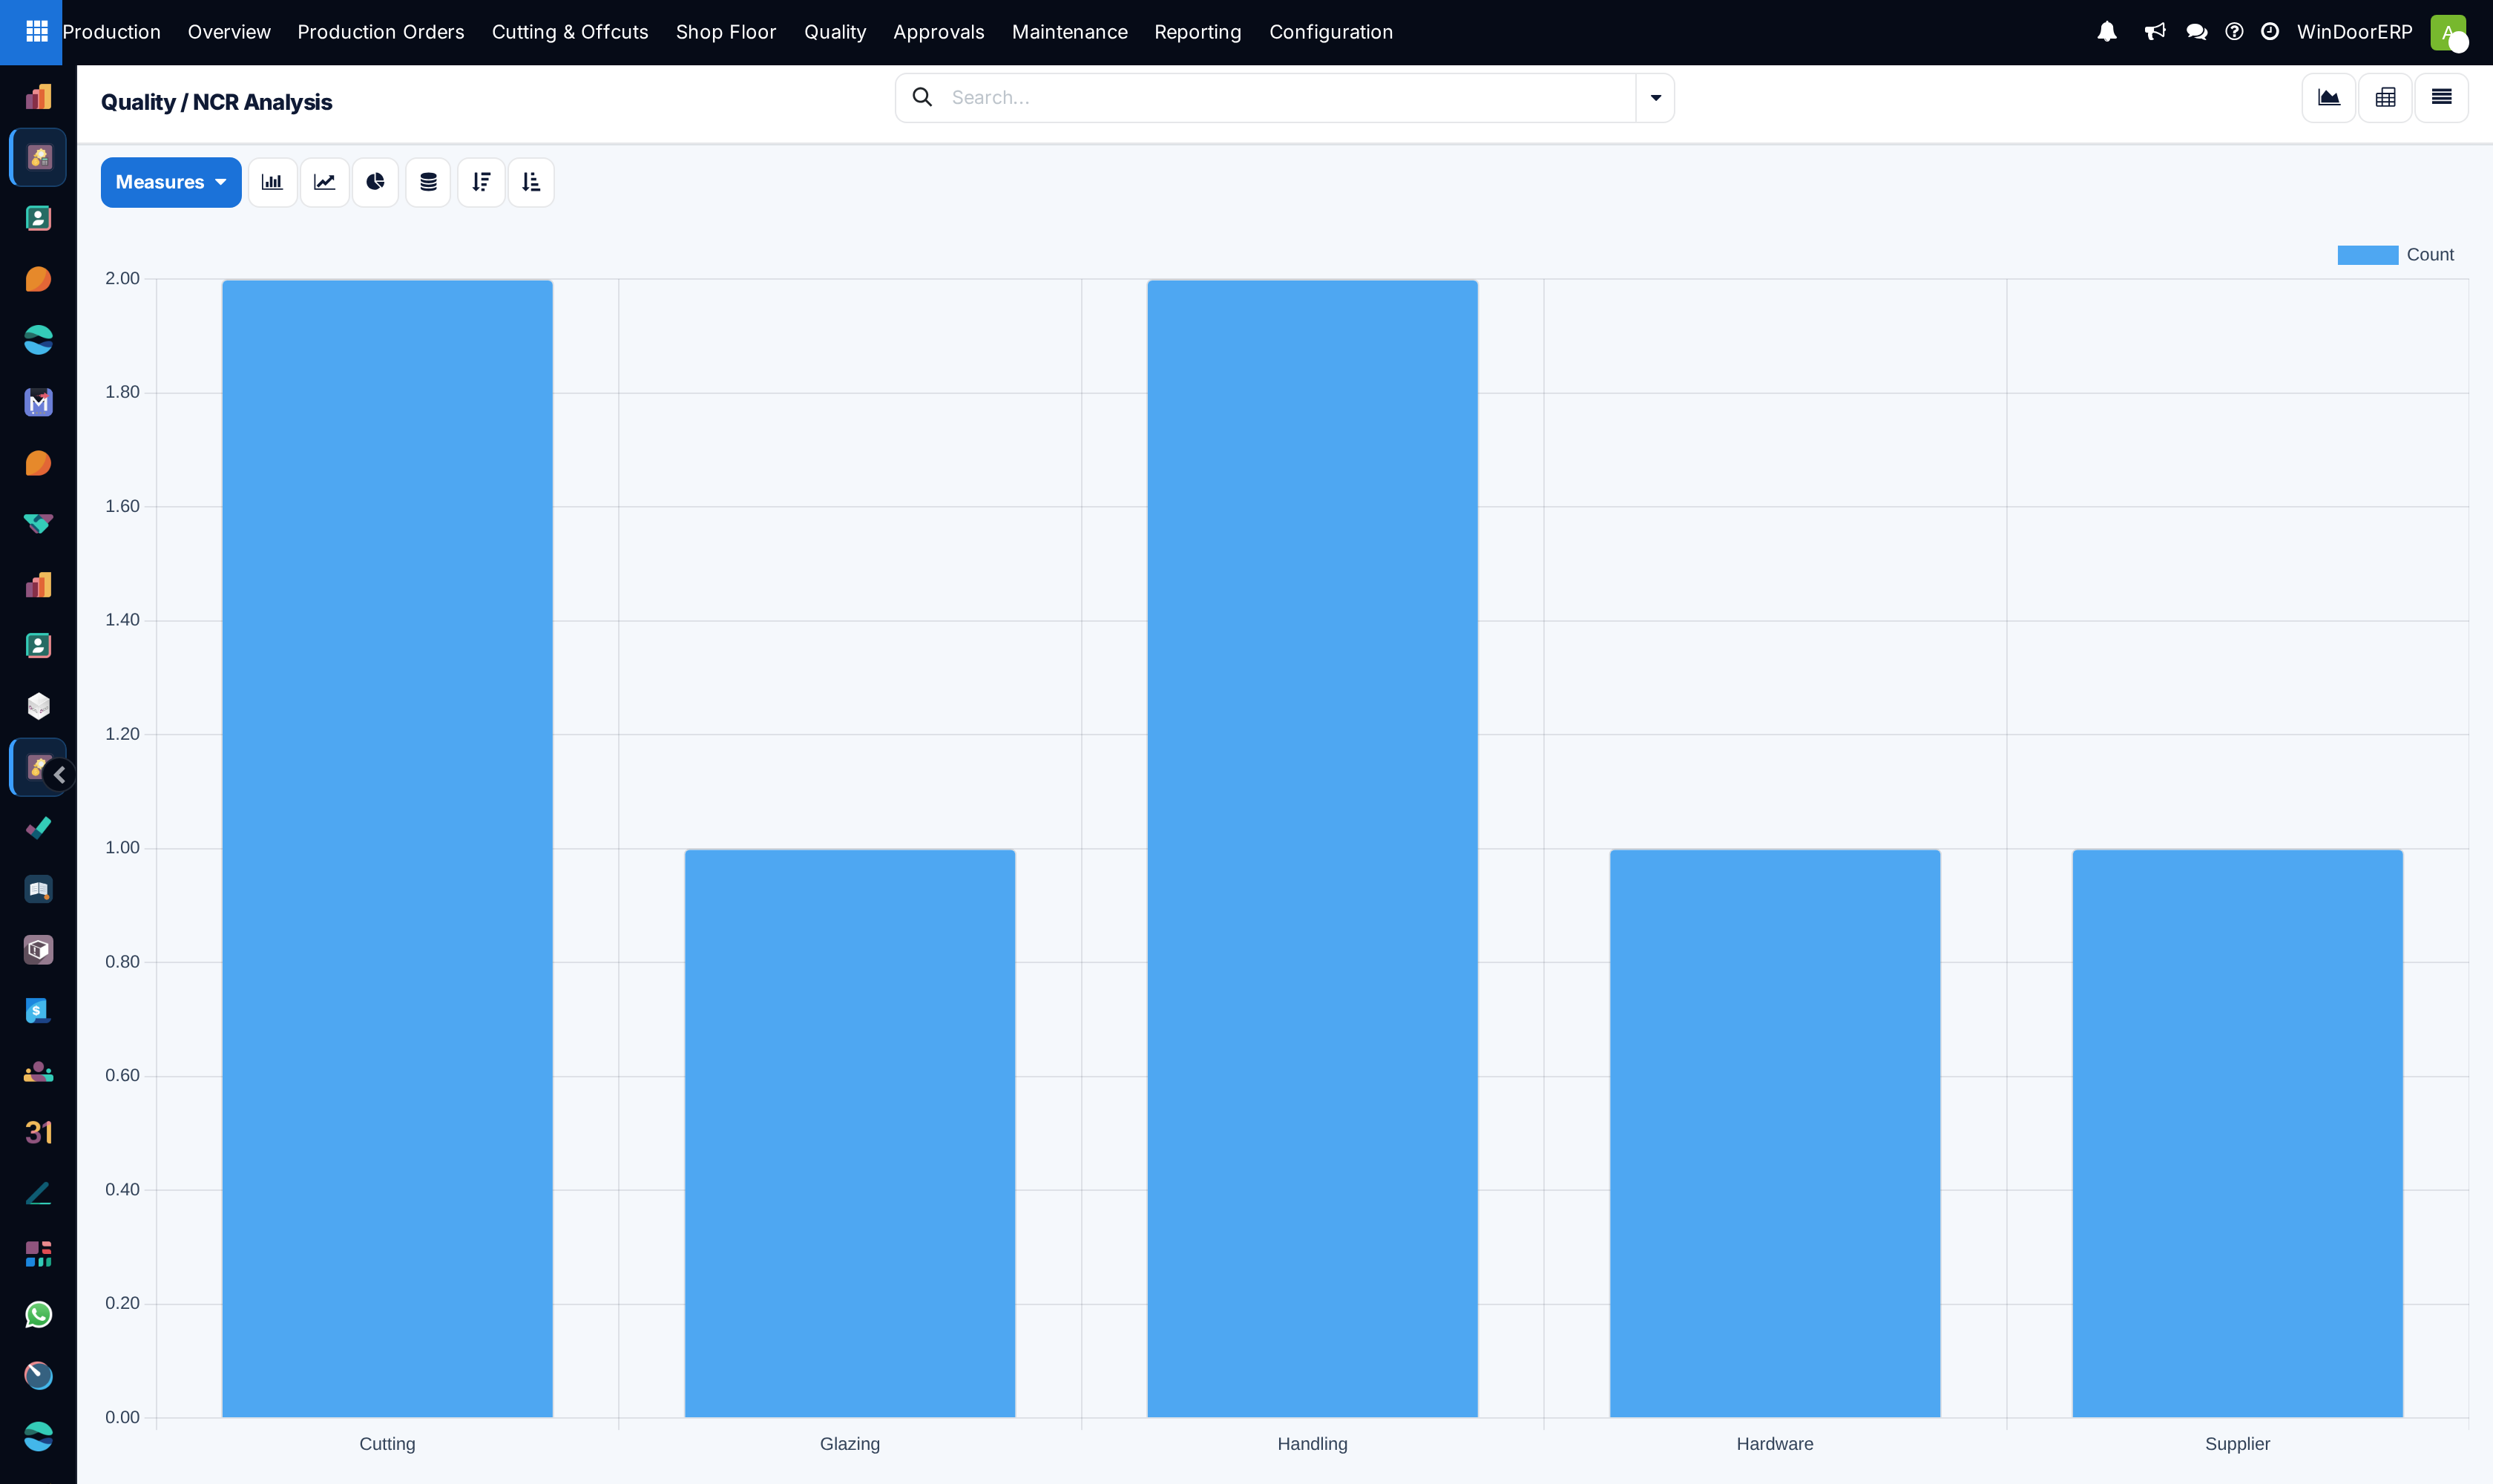
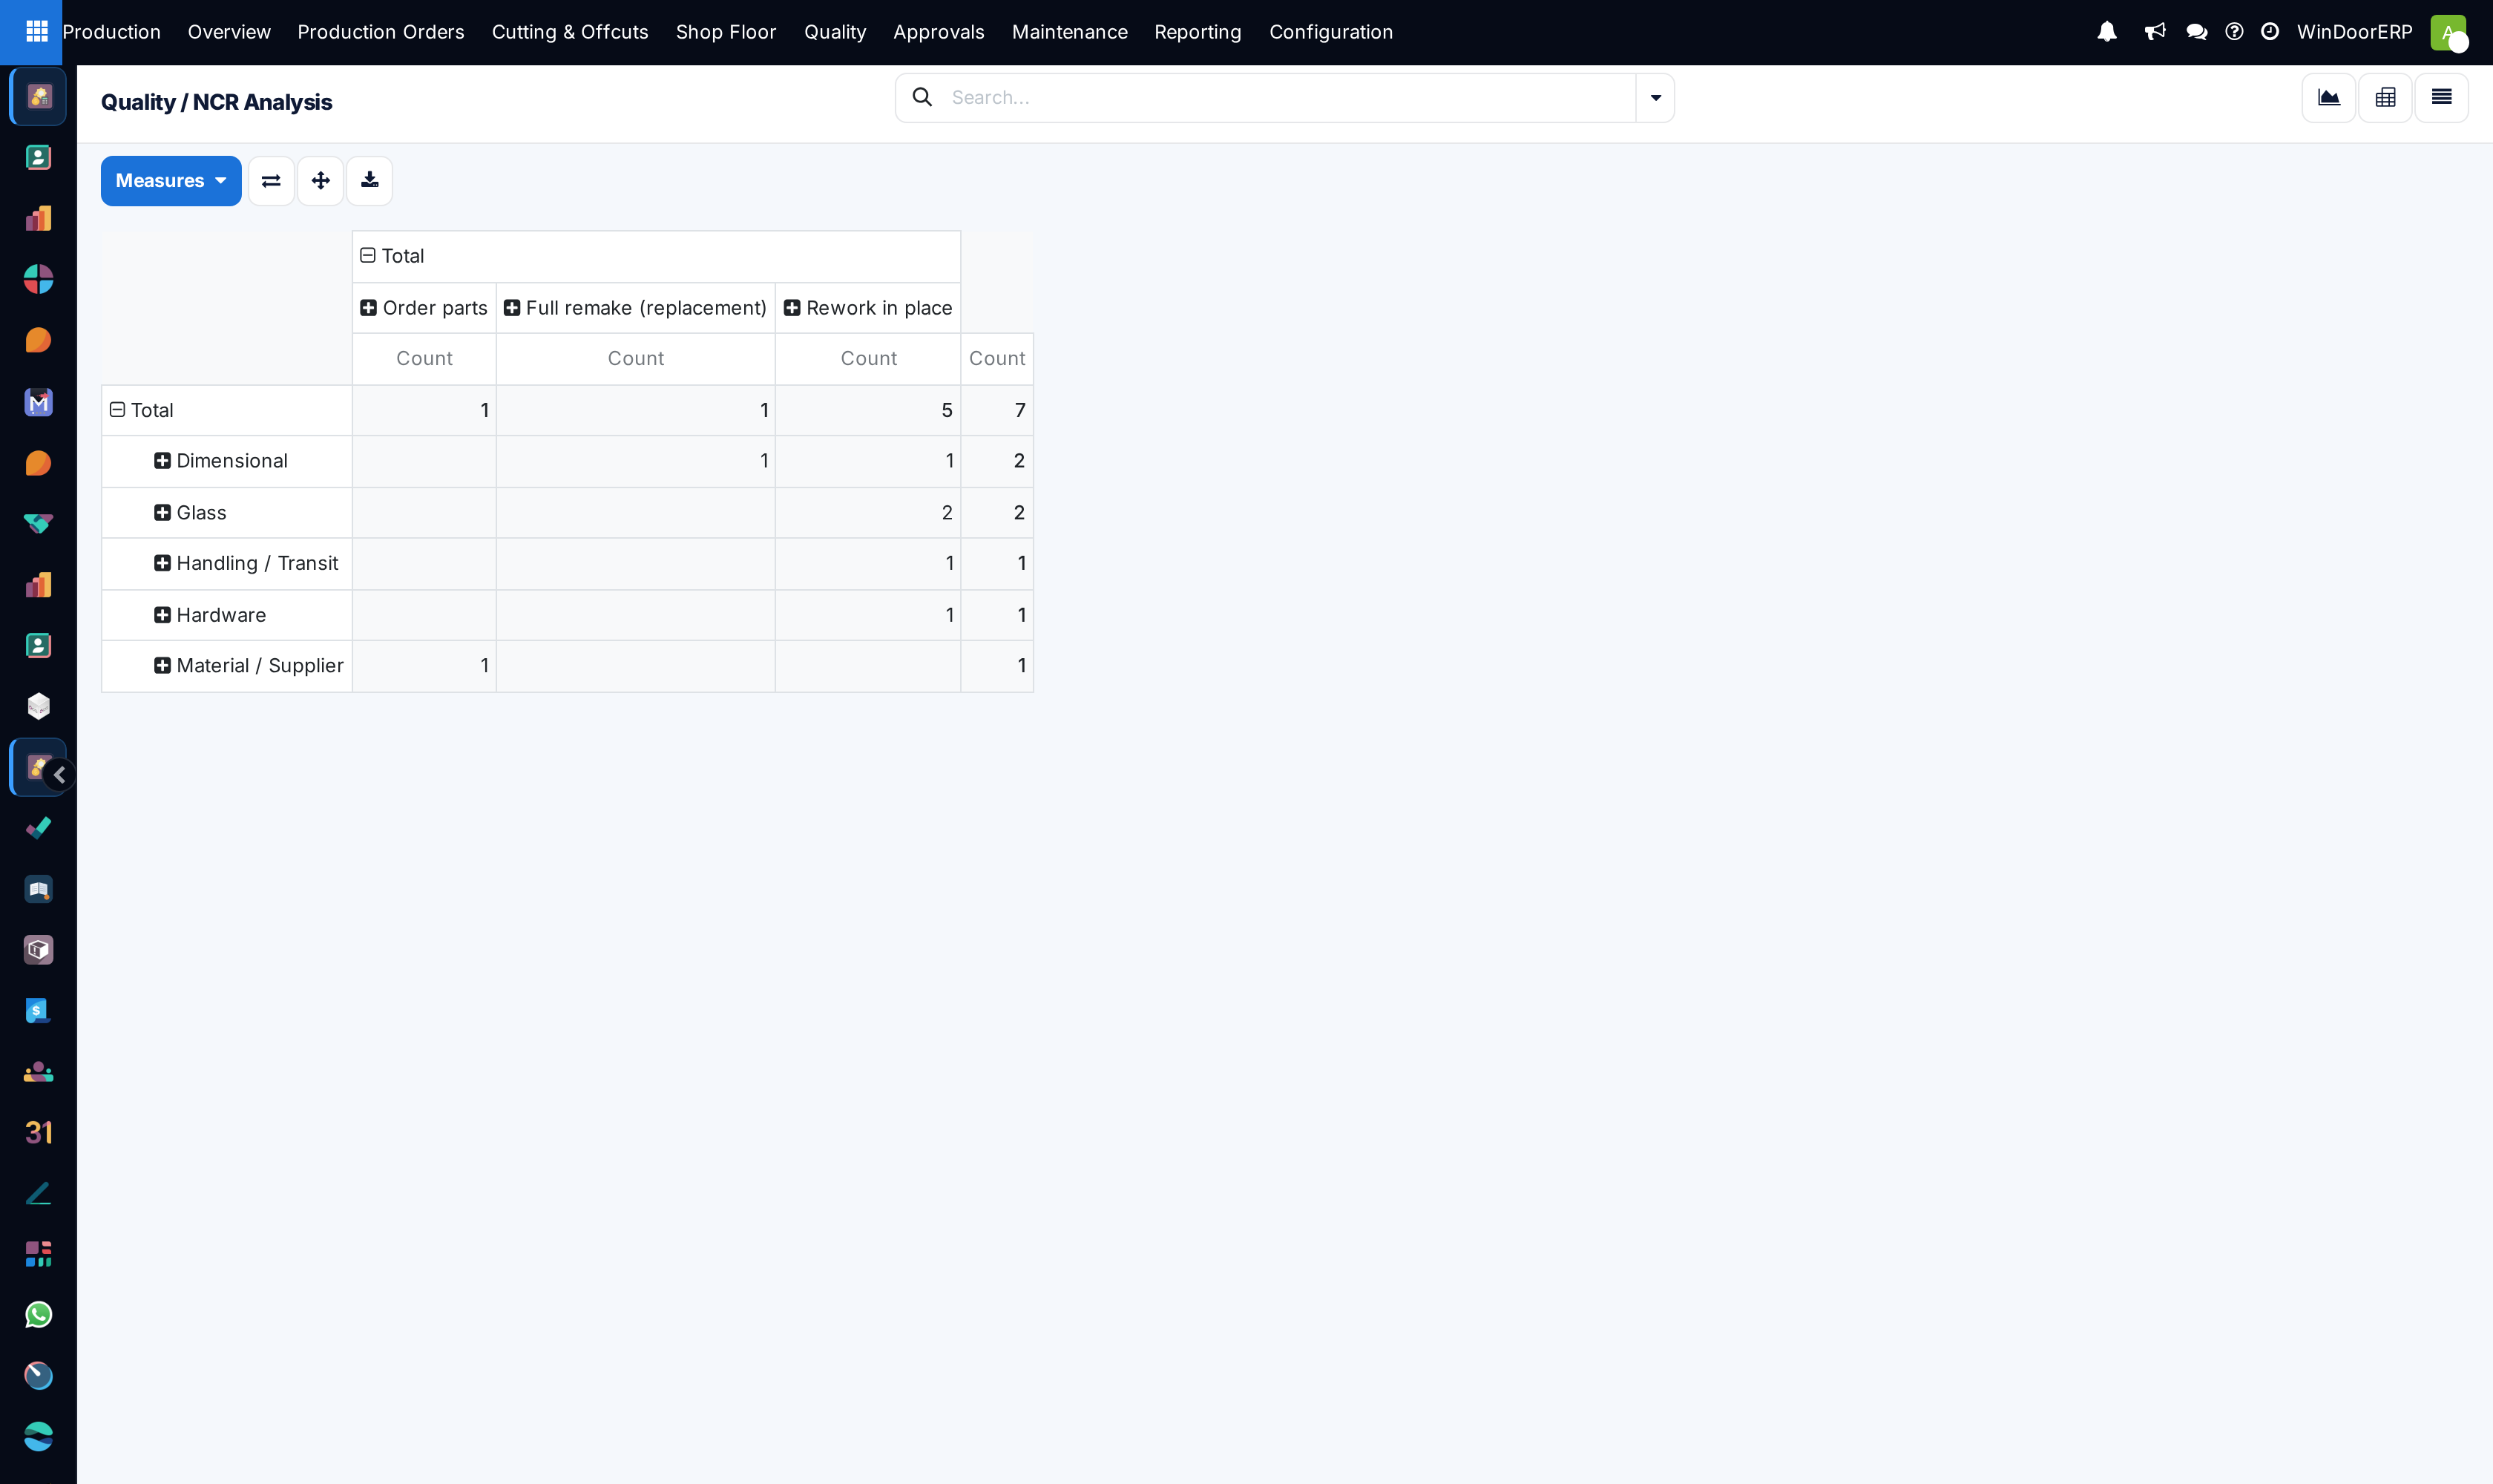
Production › Reporting › Quality / NCRs is the defect Pareto: every non-conformance the factory raised, counted by root cause stage in the chart and crossed by defect category against disposition in the pivot. It answers which part of the process breaks things, what kind of damage it does, and what the factory then decided to do about it.
Before you start
- A production role plus the Production Quality Inspector role — this entry carries the extra gate that the other three Reporting screens do not.
- NCRs classified as they are handled: an unclassified report contributes a blank bar and teaches nothing.
Steps
-
01
Open Production › Reporting › Quality / NCRs. The bar chart opens counting reports by root-cause stage.
-
02
Build your own filters before reading anything. Non-conformances have no search view at all, so this analysis offers no ready-made filters and no ready-made groupings — not even a period. Every restriction, starting with the date, is made with Add Custom Filter and Add Custom Group.
-
03
Read the Pareto: the tallest bar is the stage that produces most defects — design, cutting, welding, glazing, hardware, supplier or handling.
-
04
Switch to the Pivot for the decision view: defect categories down the side, dispositions across the top. That cross-table shows not just what breaks, but what it costs you in rework, reroutes, remakes and scrap.
-
05
Group further — by severity, responsible person or production order, each one added through Add Custom Group — to find whether a spike is one bad job or a systemic problem.
-
06
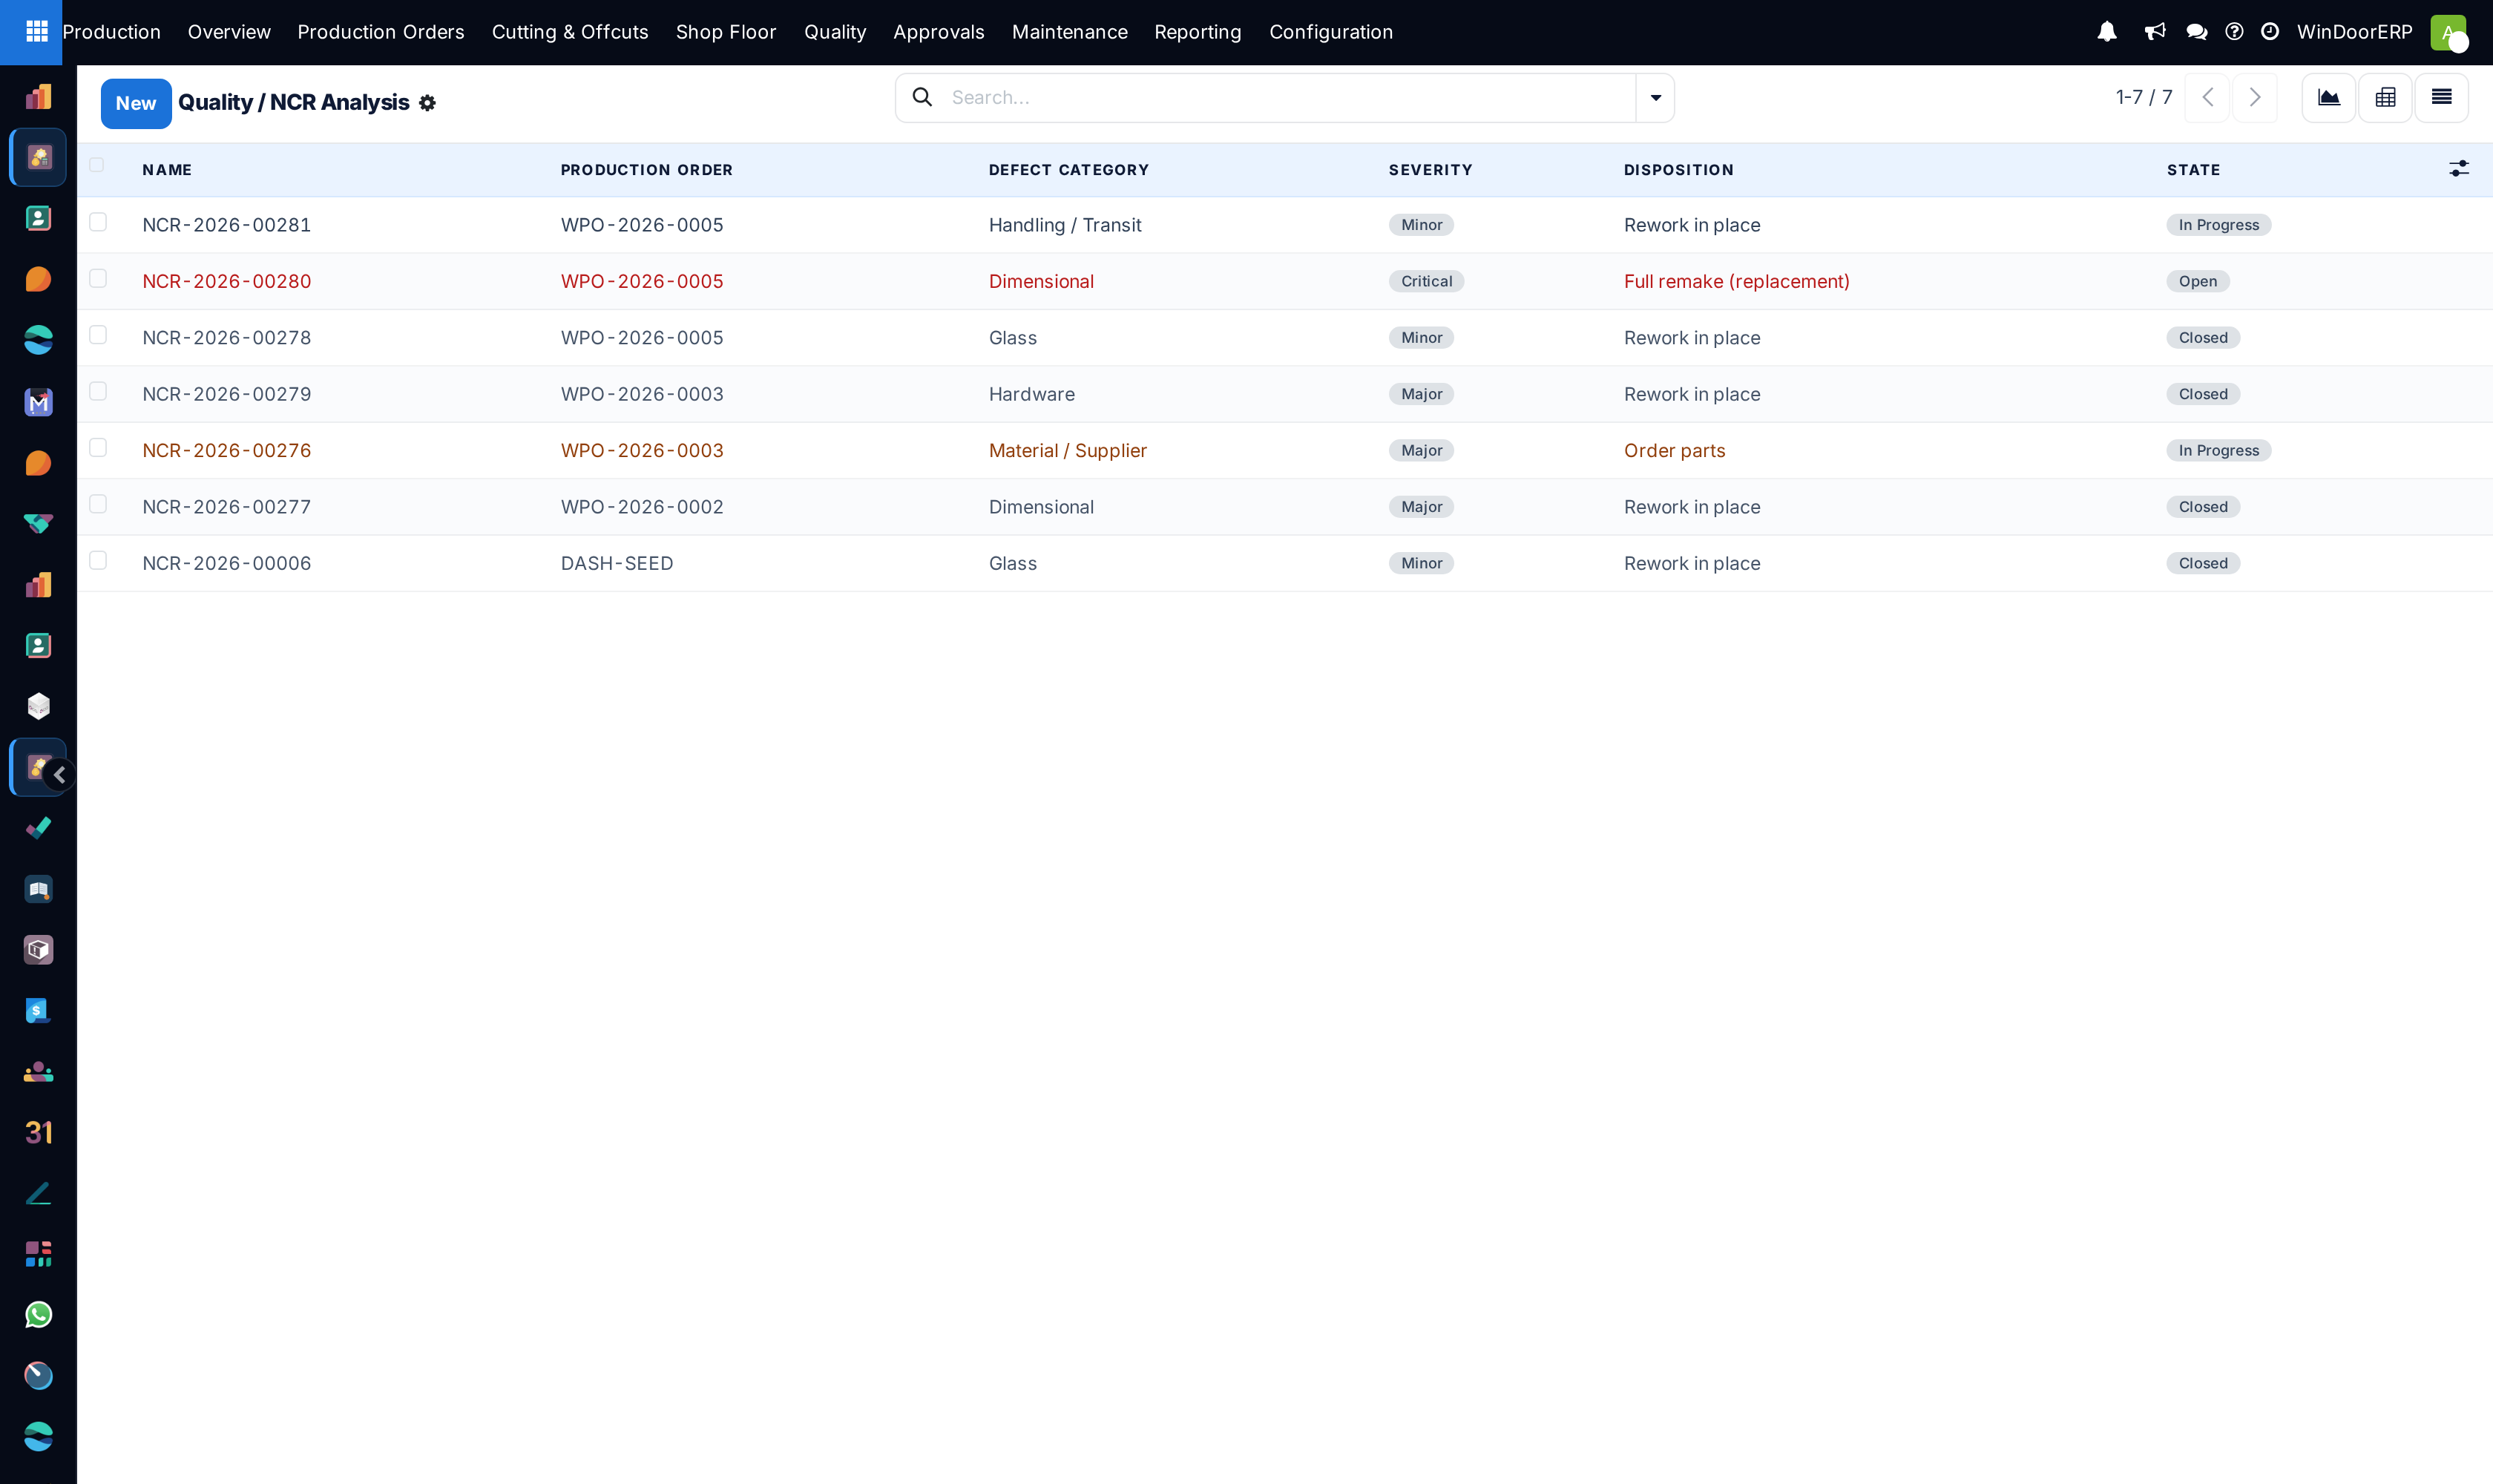
Click through any cell to open the underlying reports and read their descriptions and resolutions.
Reading it well
| Axis | What it tells you |
|---|---|
| Root Cause Stage | Where the fault was introduced — not where it was found. A defect caught at final inspection but caused at cutting belongs to cutting. |
| Defect Category | What kind of fault: dimensional, weld, glass, hardware, finish, material/supplier, handling/transit, other. |
| Disposition | The decision taken — rework in place, return to previous operation, reroute, order parts, full remake, scrap, use as is, or hold for feedback. Remakes and scrap are the expensive columns. |
| Severity | Minor, major or critical — worth grouping by when a large count hides a small number of serious failures. |
| Count | The only measure that means anything here: NCRs carry no monetary field. Cost the consequences from the dispositions. |
Note
This analysis counts reports, not defective pieces: one report can concern an item of several units, and a single unit scrapped on the floor raises its own report. Read it as a pattern-finder, and use the produced-unit and labour analyses when you need quantities and money.
Troubleshooting
| The Quality / NCRs entry is missing | It needs the Production Quality Inspector role on top of the production role. |
|---|---|
| Most bars sit under a blank root cause | The field is optional, and the reports that arrive on their own never fill it: both floor paths — Scrap piece and Report problem — raise the NCR as category other, severity major, with no root-cause stage, and one raised by a failed inspection carries only its list of failed checks. Make classification part of handling an NCR, or the Pareto is decorative. |
| Counts look enormous | No default period, and no period filter to switch on — build one with Add Custom Filter, or group by a date. |
| Dispositions column is mostly empty | Those reports are still open. Build a custom filter on the state to analyse decisions, or the reverse to see the queue. |
| Greyed sample data appears | Placeholder for an empty result; it disappears with real records. |
Common mistakes
- Reading the Pareto as blame. The stage is where the fault originated; the fix is usually a process or a tolerance, not a person.
- Counting reports as scrapped units — one report may cover several units, and scrap orders may still be draft.
- Ignoring the Use as is column: a rising concession count is a quality trend even though nothing was reworked.
- Analysing without severity — twenty minor finish notes and two critical water-leak failures are not the same story.
Was this article helpful?
Thanks — your feedback helps.
Running a window or door factory?
Ask for a demo