Analyse tasks and customer ratings in Project Reporting
What this does
Project › Reporting answers two different questions. Tasks Analysis is the workload report — one row per task, with the working-time measures: how long tasks wait for an assignee, how long they take to close, allocated versus spent hours. Customer Ratings is the satisfaction feed — every rating a customer submitted from a rating email, as smiley cards, lists and pivots.
Tasks Analysis reads a reporting table, but clicking any bar or cell drills straight into the real task list. Ratings are real records too — each card links back to its task.
Before you start
- Any project user opens Tasks Analysis; Customer Ratings is visible to Project Managers only.
- For ratings to exist at all, a task stage must request them (below) — no stage configured means an empty report, forever.
- For the time measures: deadlines and allocated hours actually set on tasks, and a working calendar on the project — the "working" measures follow it.
Steps
-
01
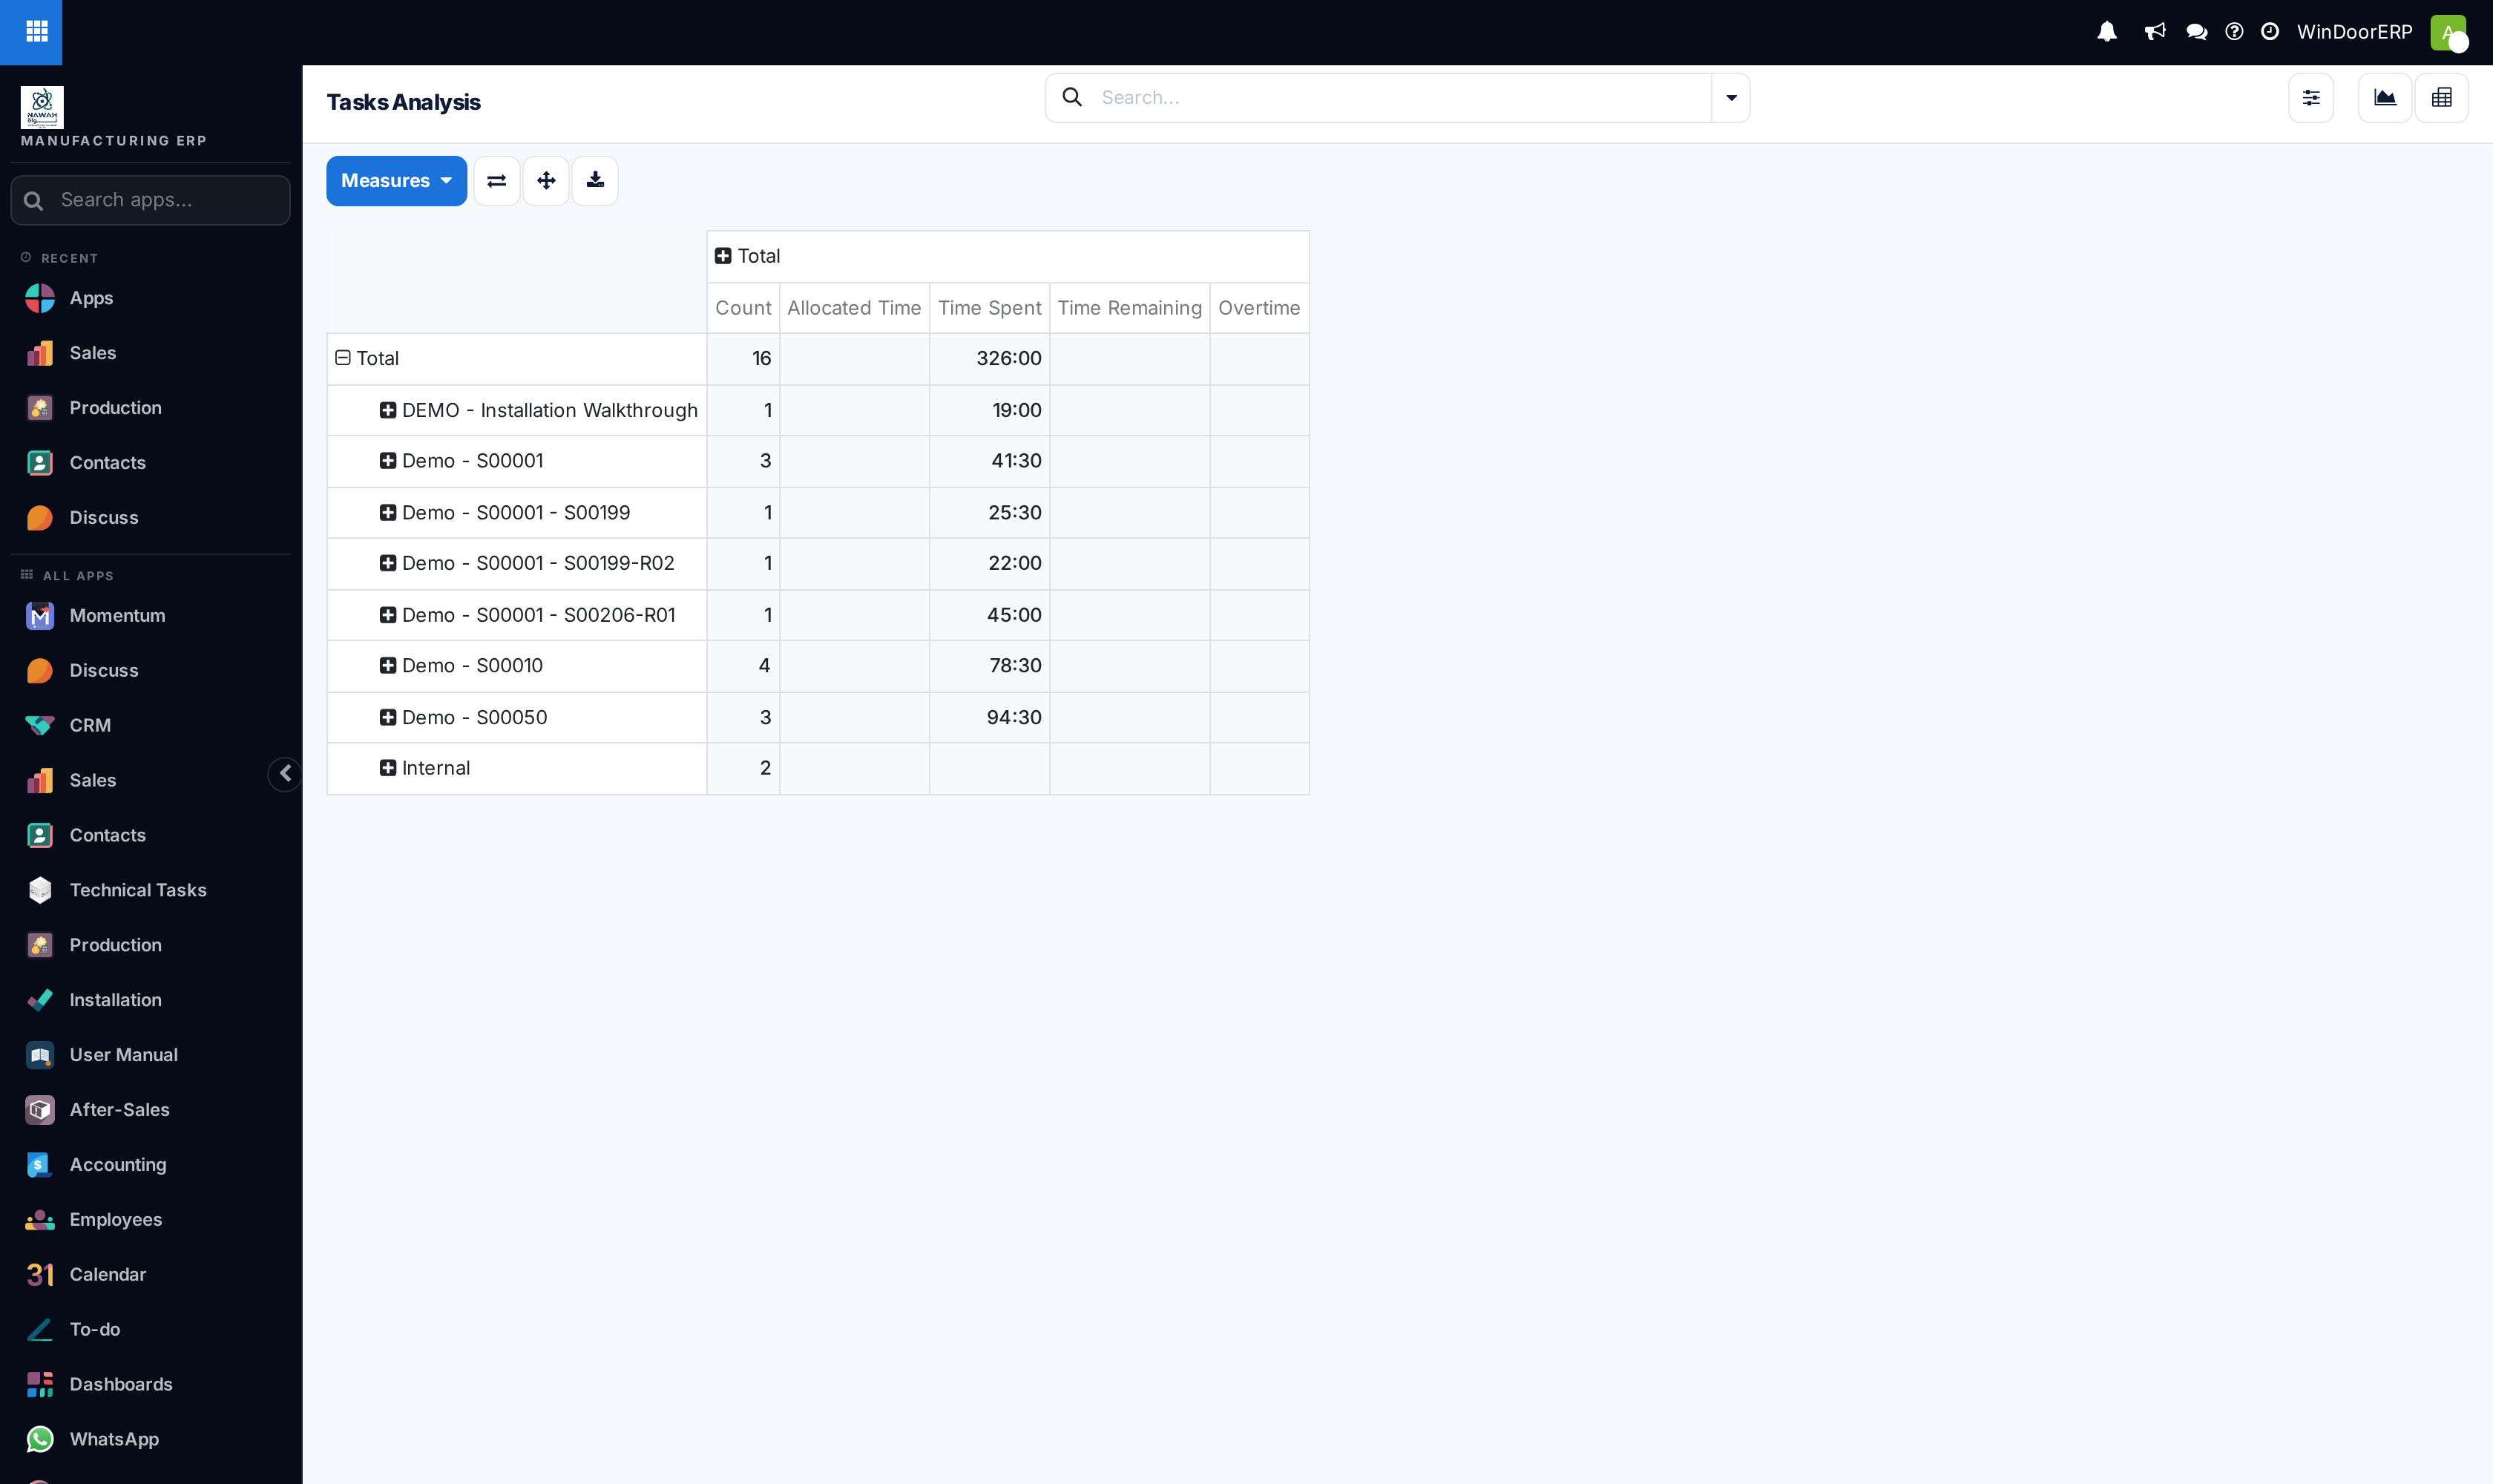
Open Project › Reporting › Tasks Analysis. The chart opens on task Count by project and stage; the pivot opens on Count per project (plus the timesheet time measures for Timesheets users) — add the working-hours measures from Measures.
-
02
Filter first: no default filter is applied, so closed and cancelled tasks are included until you pick Open (a date range narrows the window but does not exclude them).
-
03
Pick measures: Working Hours to Assign / to Close (or the day variants), Days to Deadline (negative = overdue, computed live), Last Rating (1–5), and — for Timesheets users — Allocated Time, Time Spent, Time Remaining, Overtime and Progress.
-
04
Click into any cell to open the tasks behind it and fix what you found.
-
05
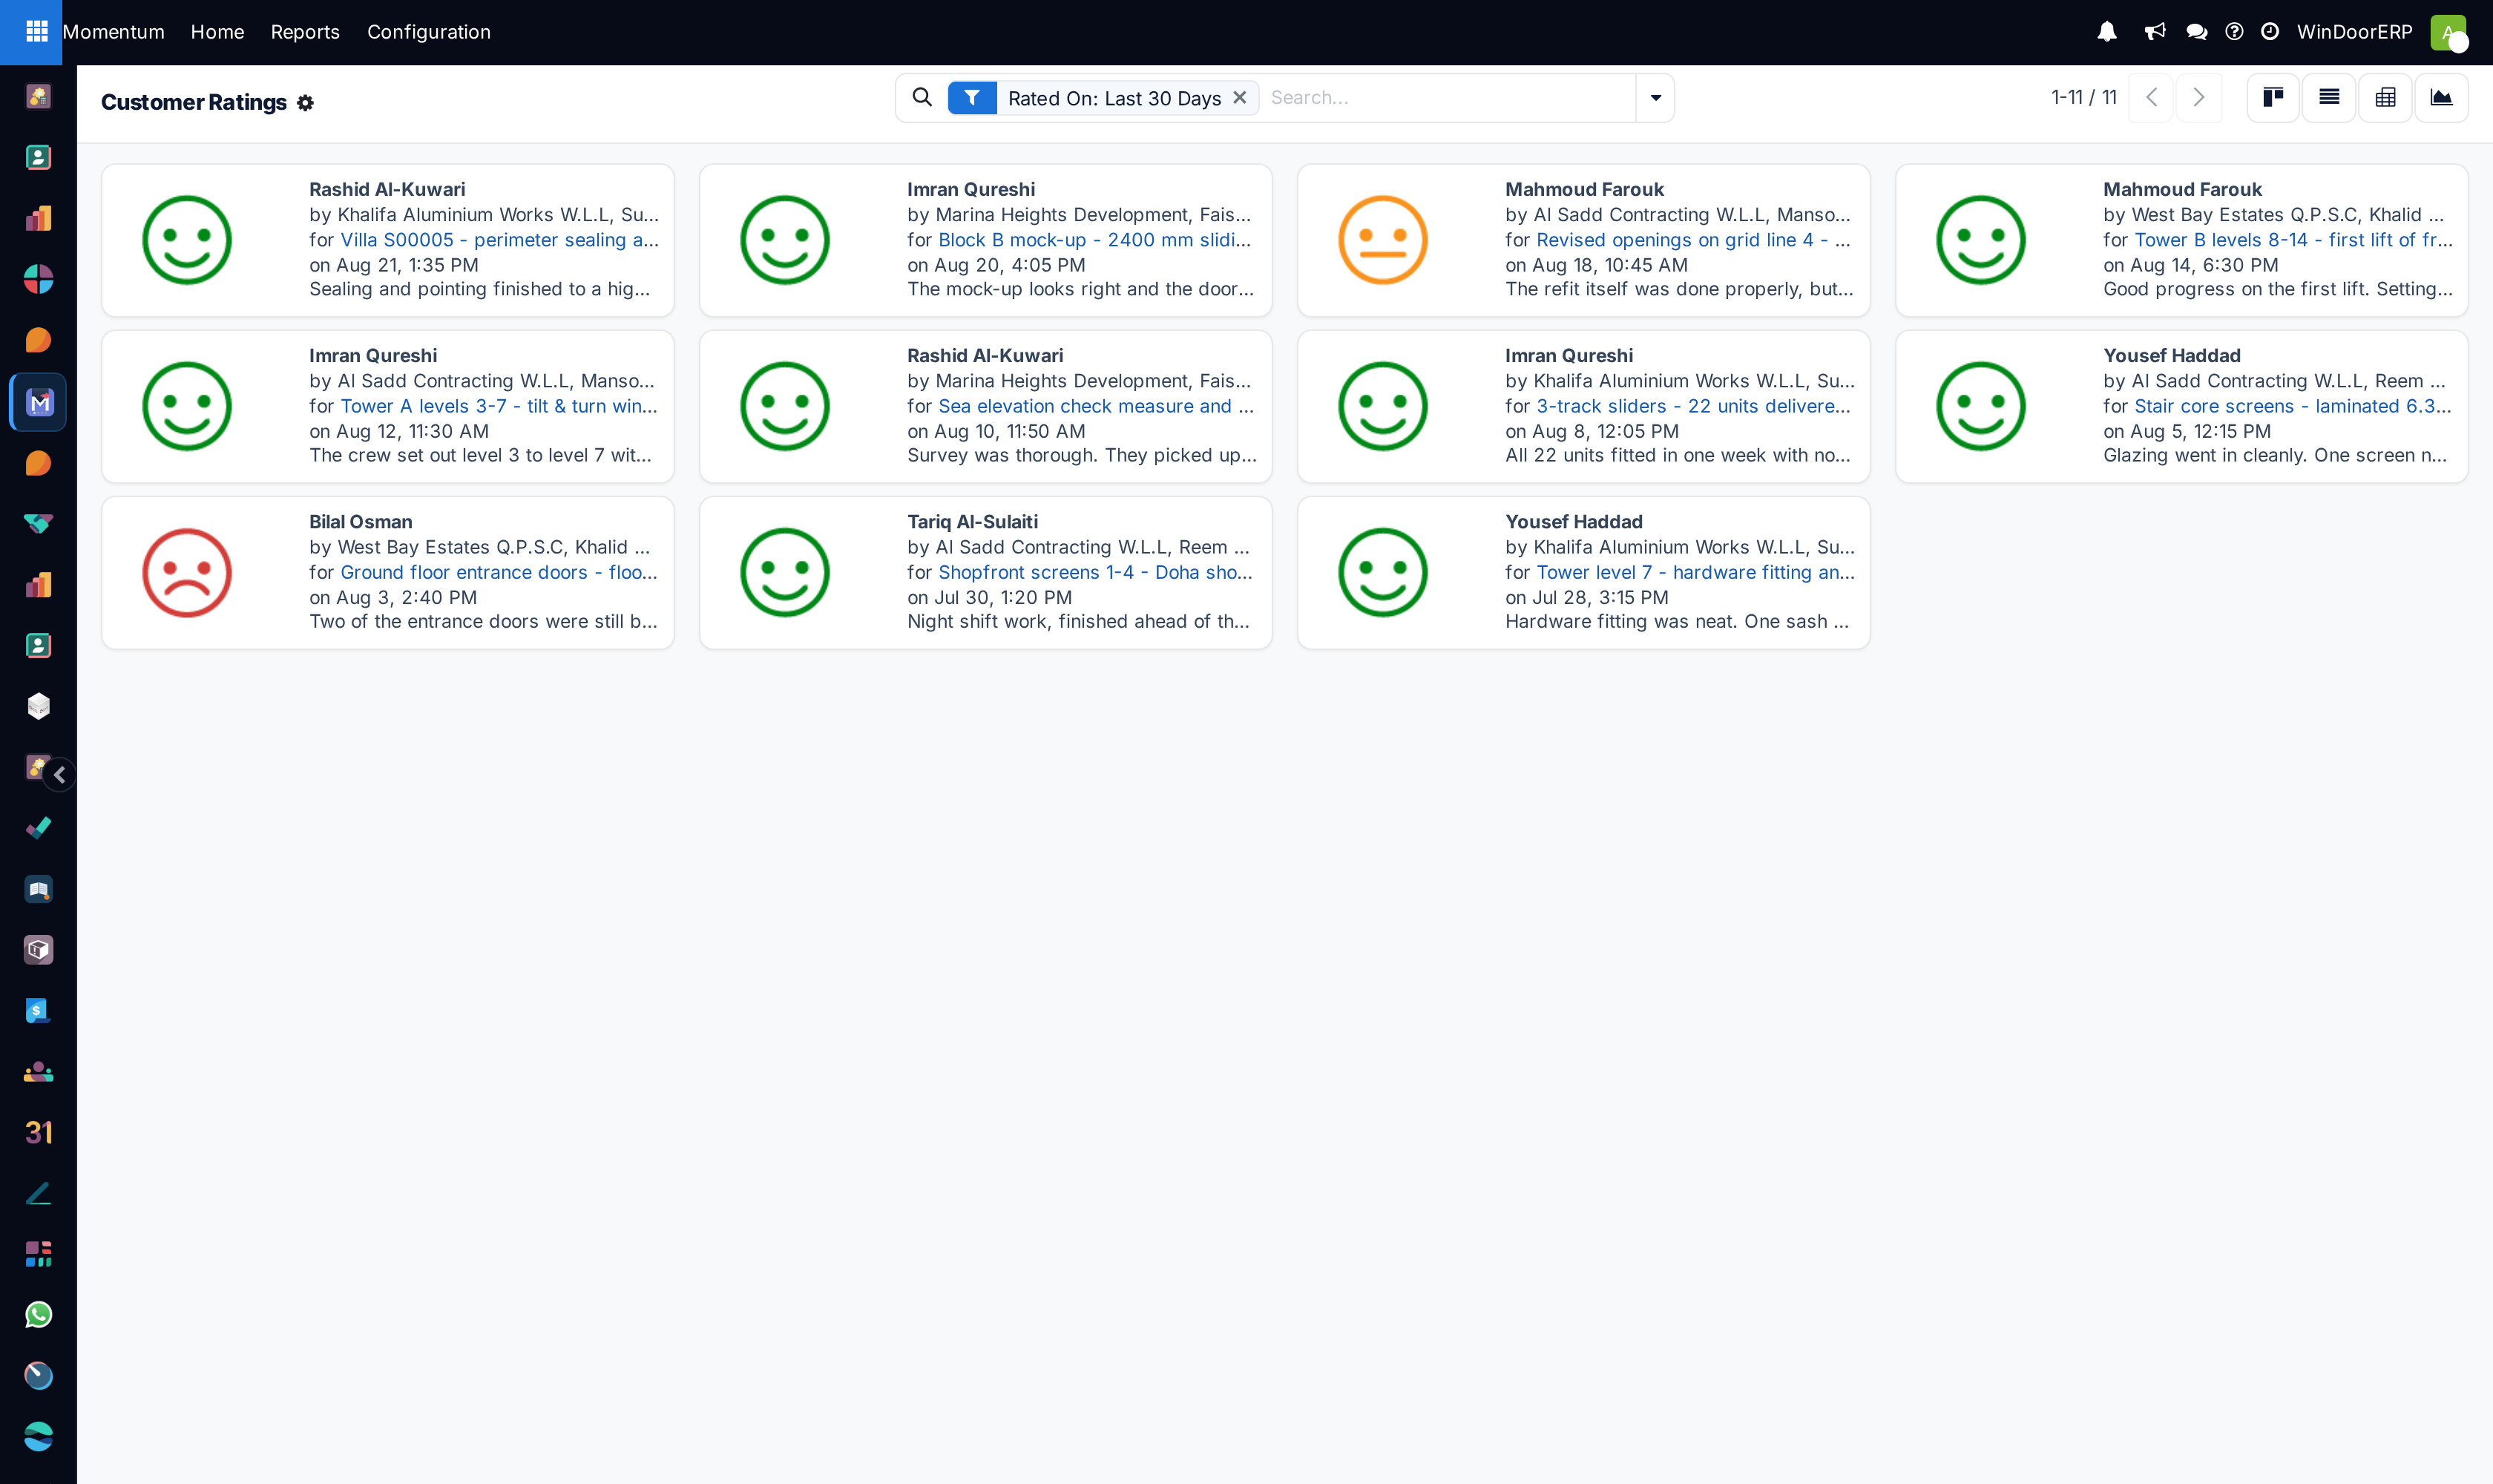
Open Project › Reporting › Customer Ratings — smiley cards over the last 30 days by default; switch to pivot/graph for averages per assignee or month, or filter Happy / Neutral / Unhappy.
The measures, precisely
| Measure | Definition |
|---|---|
| Working Hours / Days to Assign | From task creation to the first assignee — counted on the project's working calendar, leaves excluded, and averaged when grouped. |
| Working Hours / Days to Close | Creation to the task entering a folded (collapsed) stage — typically your Done and Cancelled columns; moving it back to an open column reopens the clock. Same calendar, same averaging. |
| Days to Deadline | Deadline minus now, recomputed at query time — negative numbers are overdue tasks. |
| Allocated / Spent / Remaining Time, Progress | The timesheet measures (Timesheets users only). Progress is spent ÷ allocated, averaged per task when grouped — not total spent over total allocated. |
| Rating (1–5) (Customer Ratings) | The customer's score, averaged when grouped. The email offers three smileys — 5 (Happy), 3 (Neutral), 1 (Unhappy) — which is why averages cluster around those values; ≥ 4 counts as happy, ≥ 3 neutral, below 3 unhappy. |
How ratings are requested
Activation lives on task stages, not in Settings. A project manager edits a stage and enables "Send a customer rating request" with a rating email template; the request goes to the task's customer when the task reaches that stage — or, in periodic mode, on a schedule (weekly, monthly…) for as long as the task stays there. Optionally, the stage can flip the task's state automatically from the feedback: good → Approved, neutral or bad → Changes Requested. A project shows its Ratings panel only once one of its stages requests ratings.
Note
There is no project profitability report in this edition — profitability appears as a panel on each project's side pane (revenues and costs from the linked sales and analytic records), not as a Reporting menu. Task-count "velocity" and per-project margins beyond that panel are not features of this screen.
Troubleshooting
| Customer Ratings is missing from the Reporting menu | It is shown to Project Managers only — the restriction is built in, not a settings toggle. |
|---|---|
| The ratings report is empty | No stage requests ratings, or no customer has answered yet. Configure a stage's rating request first; only submitted ratings appear. |
| Numbers include long-dead tasks | No default filter — closed and cancelled tasks count until you apply Open (a period filter alone narrows dates but keeps them in). |
| The charts show greyed data on a fresh database | Sample placeholder while no tasks match — it disappears with the first real rows. (Customer Ratings has no sample mode; it is simply empty until ratings arrive.) |
| Progress over 100% or oddly averaged | It is the mean of each task's own percentage; a few over-budget tasks skew groups. Compare Allocated and Spent directly for the true ratio. |
| "Average Rating" is not offered as a measure | In this version the per-task average is hidden from the dropdown — use Last Rating (1–5) here, or the Rating (1–5) measure on the ratings report. |
| Assign/close hours look shorter than the calendar time | Correct — they are working hours on the project's calendar, excluding nights, weekends and leaves. |
Common mistakes
- Comparing this report's working days with CRM's calendar "Days to Close" — different clocks, not comparable.
- Requesting ratings on every stage — customers rate the crossing into each stage, and the inbox noise buries the signal. One decisive stage (delivery, handover) is the pattern.
- Reading a 3.0 average as mediocre when the email only offers 5, 3 and 1 — a 3.0 can mean "everyone chose Okay".
- Judging assignees by hours-to-close without filtering out tasks that waited in backlog stages before anyone was assigned.
- Expecting profitability or milestone reporting here — that is the project side panel and the milestones feature, not this menu.
Was this article helpful?
Thanks — your feedback helps.
Running a window or door factory?
Ask for a demo