Read the stock buttons and the product forecast
What this does
Once a product is tracked, the buttons across the top of its form become the quickest view of its stock: what is on hand, what is coming in, what is promised out, and when a replenishment would arrive. The first button opens the product forecast, a report that adds those up and lists every pending move behind the numbers. This topic reads that report and the stock buttons beside it.
Before you start
- The product must be goods with Track Inventory on; otherwise there is no stock to forecast and the buttons do not appear.
- The forecast reads confirmed documents. A draft quotation or a draft purchase order changes nothing here.
- Lead times come from the vendor lines and the Inventory tab; a forecast with no lead times promises everything today.
Steps
-
01
Open the product. The first smart button shows the quantity On Hand with the Forecasted quantity under it.
-
02
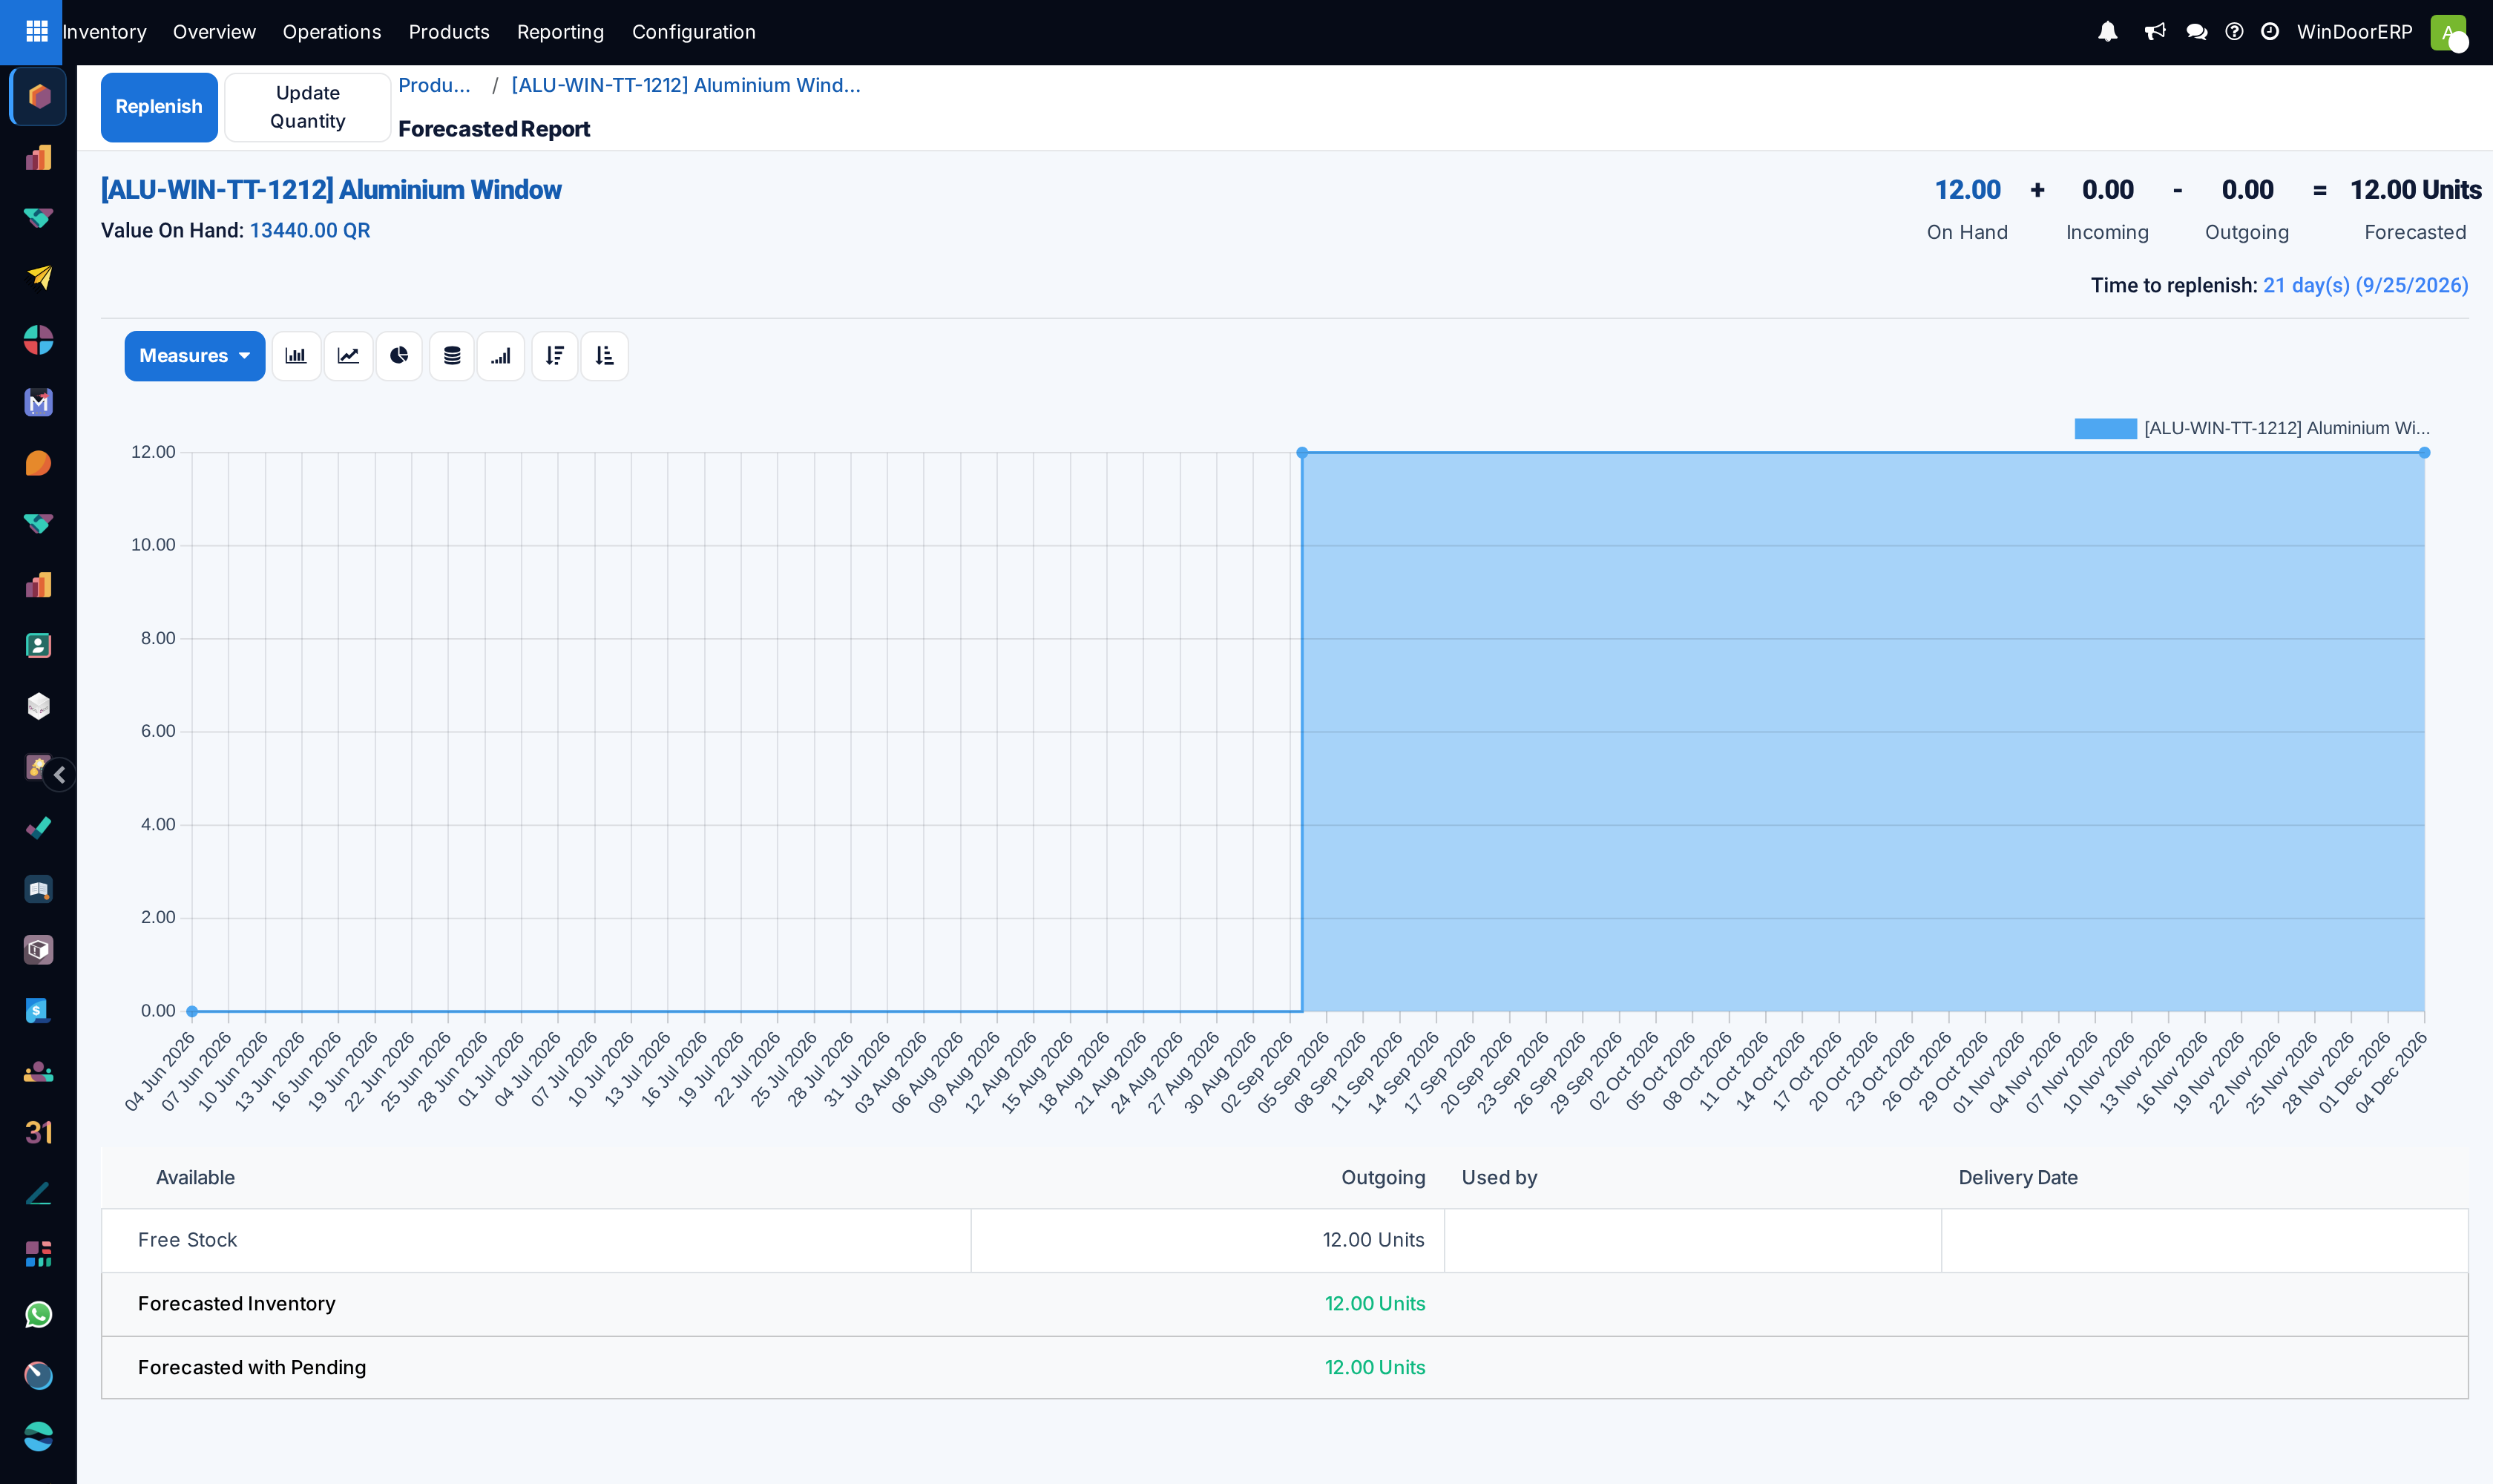
Click it. The Forecasted report opens for the product.
-
03
Read the header: On Hand + Incoming − Outgoing = Forecasted. A red forecast means the promised deliveries exceed what is on hand plus what is on order.
-
04
Read Time to replenish under the header: the total lead time for a new order of the product to arrive in your store. Hover it for the breakdown, from today through each delay to the earliest possible arrival.
-
05
Scroll to the table of pending documents to see which receipt or delivery each quantity belongs to, and which deliveries are already reserved from stock.
-
06
Use the warehouse filter at the top of the report when the company runs more than one warehouse.
-
07
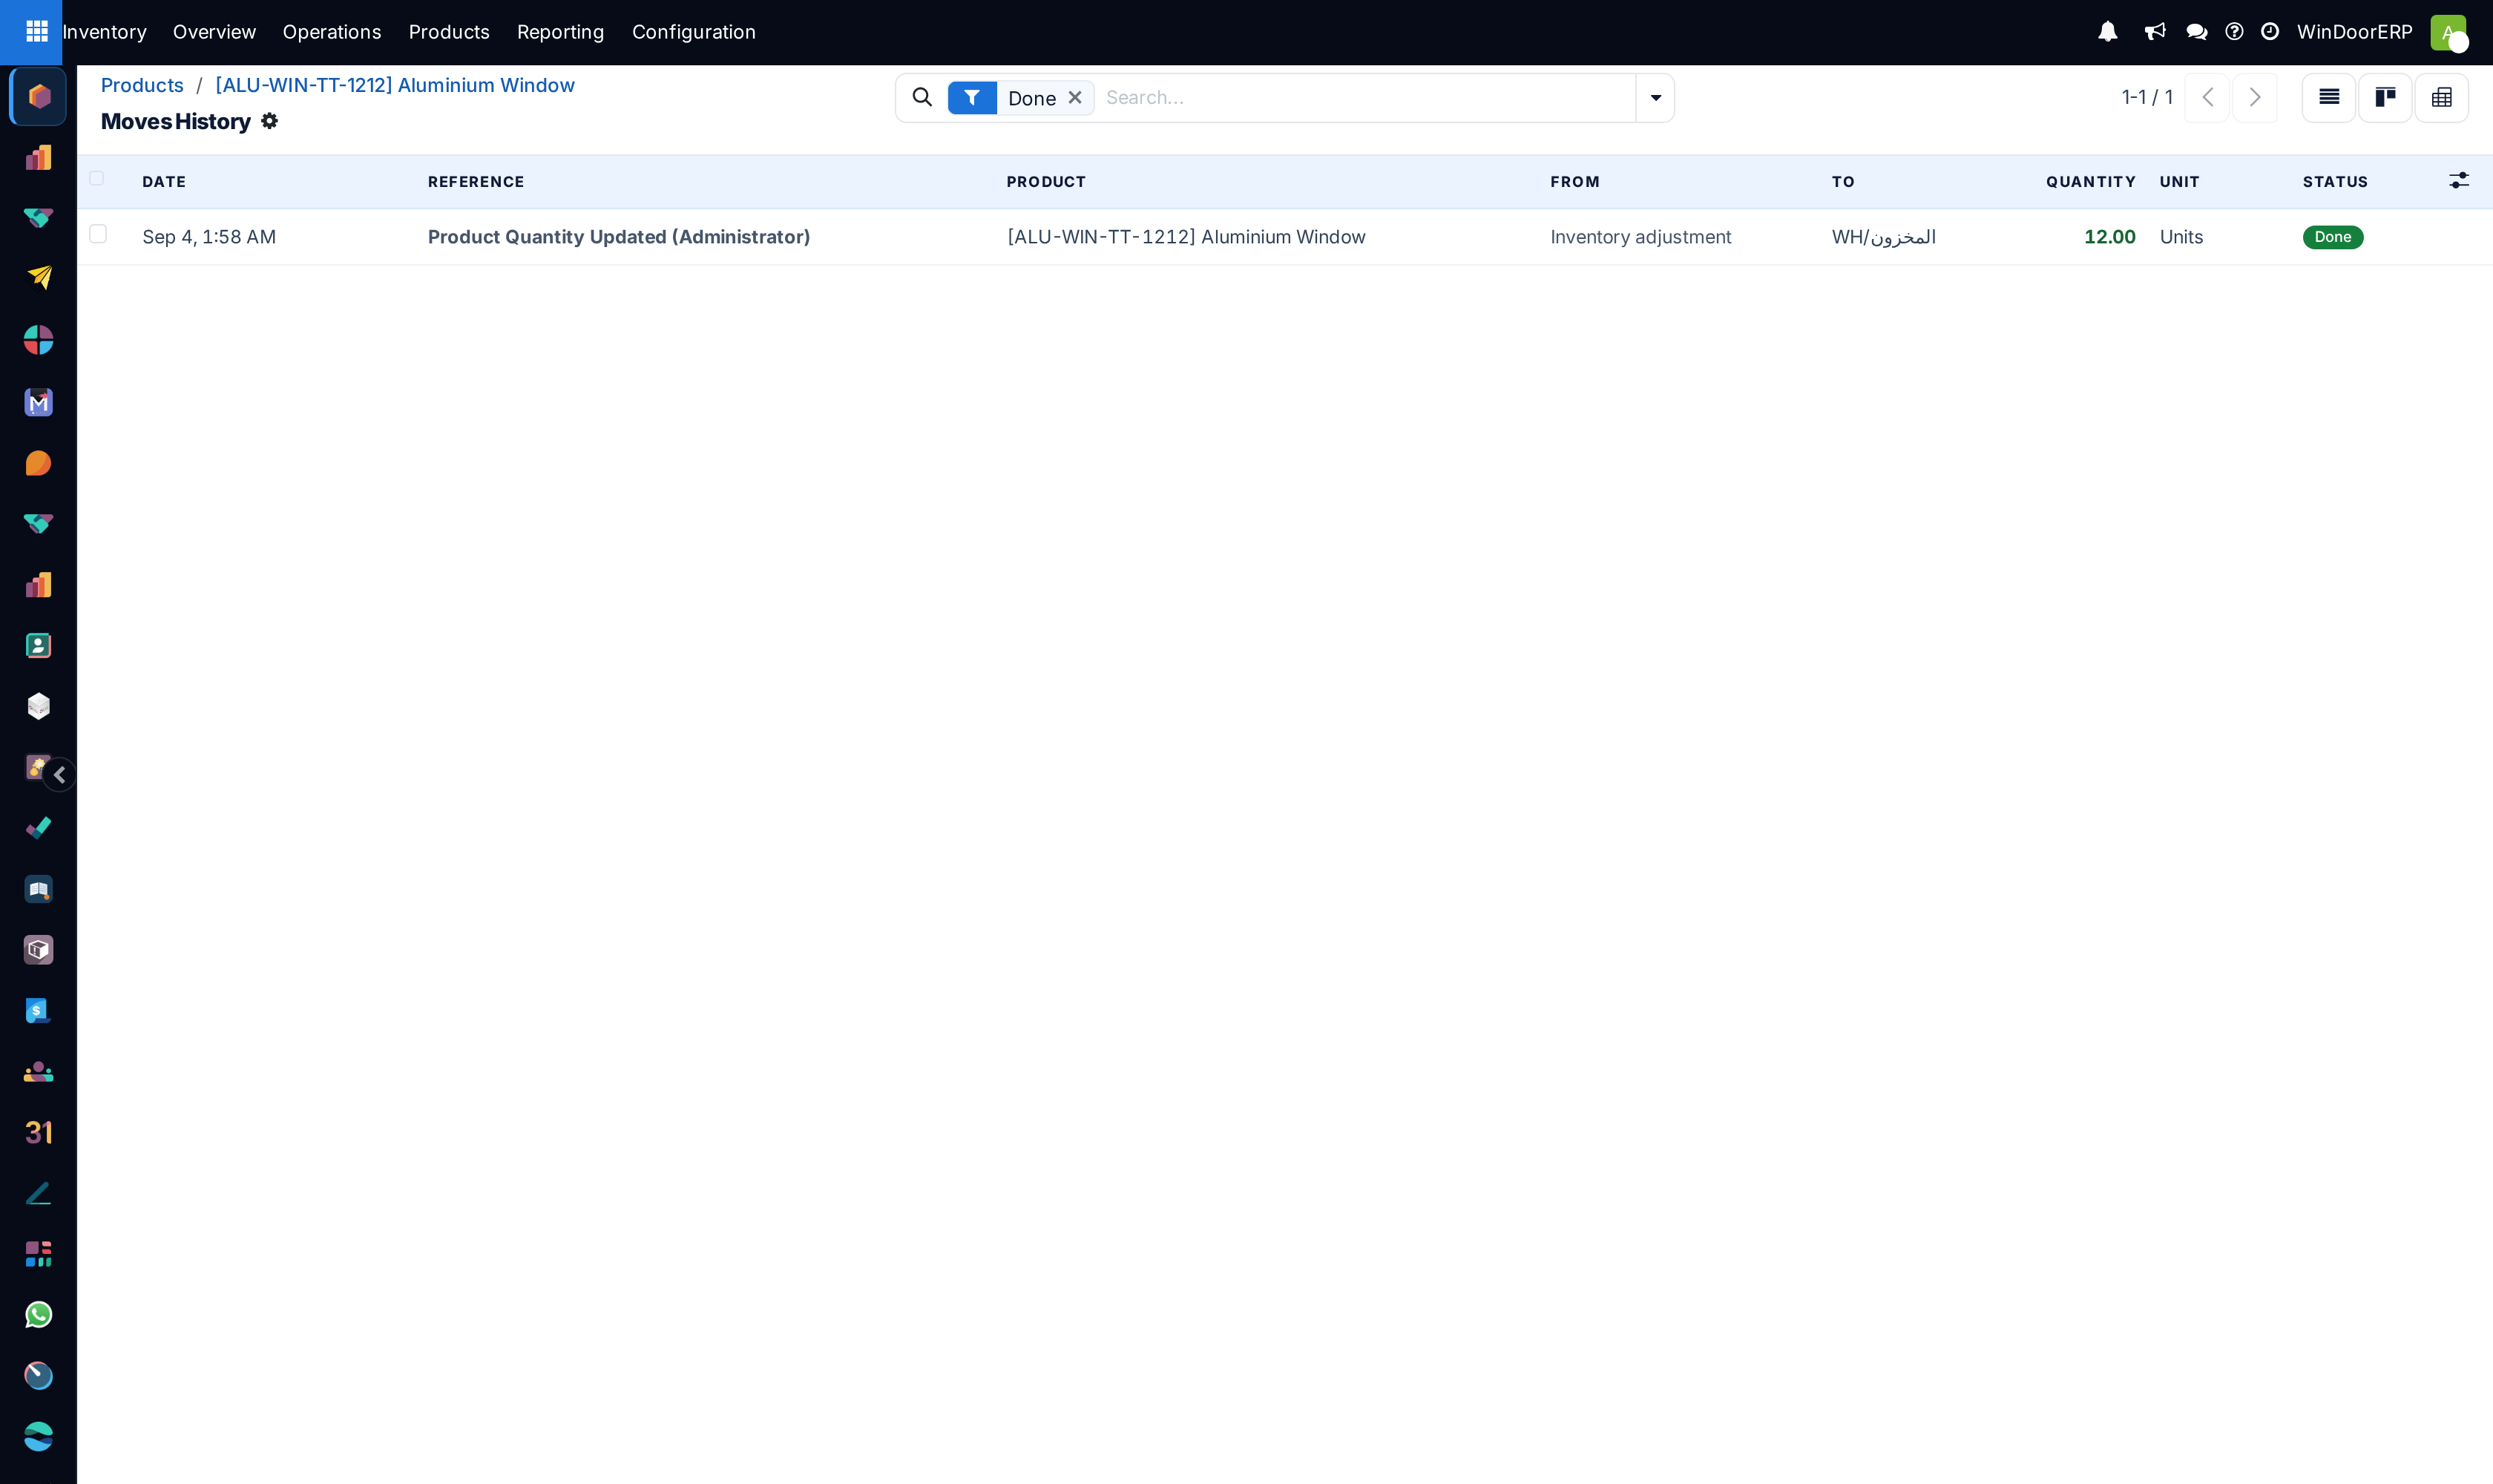
Go back to the product and read the In/Out button for the movement history.
The header of the forecast
| Figure | What it counts |
|---|---|
| On Hand | The physical quantity in every internal location of the warehouse. Clicking it opens the stock per location. |
| Incoming | Quantities on confirmed receipts not yet validated: purchase orders on their way, returns expected back. |
| Outgoing | Quantities on confirmed deliveries not yet validated: sales orders waiting to ship, consumptions planned by production. |
| Forecasted | On hand plus incoming minus outgoing, in the product's unit. Red when negative. |
| Time to replenish | The sum of the delays a new order would take: the vendor's lead time and any warehouse delays. The tooltip titled Lead Time Information lists Today, one line per delay, and the Earliest Possible Arrival. |
| Value On Hand | The on-hand quantity multiplied by the product cost, shown under the product name. |
| Replenish and Update Quantity buttons | The two buttons at the top of the report: Replenish opens the replenishment wizard to order the product now; Update Quantity opens the stock per location so a count can be corrected. |
Below the header the report lists the pending documents. Each line names the document, its date and its quantity; a line shown in red is a demand that no stock or receipt covers yet, and a line marked as reserved has already taken its quantity from the shelf. Buttons on the lines let you unreserve, reserve or open the document.
The stock buttons on the product
| Button | What it shows and opens |
|---|---|
| On-hand quantity with Forecasted under it | The two headline figures; opens the forecast report described above. |
| In / Out | The number of incoming and outgoing stock moves in the past 12 months. Opens the Moves History filtered to the product: every validated move line with date, source, destination and quantity. |
| Reordering Rules, or Min/Max | The product's reordering rules; covered in the next topic. |
| Putaway Rules and Storage Capacities | Where the product is put when it arrives, and how much of it a storage category may hold; the putaway topic covers the first. |
The same two figures appear as the On Hand and Forecasted columns of the product list, with totals at the foot, which is the fastest way to scan a whole family of profiles for shortages.
Troubleshooting
The button is missing: the product is not tracked, is a service or a combo, or has several variants; open a variant for its own forecast.
The forecast is negative although material is on order: the purchase order is still a draft request for quotation. Confirm it and the quantity becomes incoming.
Time to replenish says zero days: no vendor line carries a Lead Time, and no warehouse delay is configured.
On hand and forecast differ from the list: the list is per company and the report is per warehouse when a warehouse filter is set.
Common mistakes
- Reading On Hand as available. Reserved quantities are still on hand; the forecast and the pending table show what is promised.
- Planning production from the forecast of a product whose sales orders are still quotations.
- Trusting a lead time that was never entered.
Was this article helpful?
Thanks — your feedback helps.
Running a window or door factory?
Ask for a demo