Analyse Site QC results, failures, first-pass rate and measurements
What this does
Site QC analytics live under Installation › Analysis & Reports as five screens over the checks installers answer on site: Site QC Results (every answered check, pass or fail), Site QC Failures (straight to what fails most), Site QC First-Pass Rate (the share of openings that passed their very first inspection), Site QC Rework (re-inspections, with the hours between first failure and eventual pass), and Site QC Measurements (how far measured values drift from tolerance).
Two record streams feed them: one row per check (results, failures, measurements) and one row per inspection attempt (first-pass, rework). Check rows appear when a sheet is opened and fill in as the installer answers; submitting the sheet stamps the inspector and date and appends the attempt row.
Before you start
- The Site QC toggle enabled in the Installation settings, and an installation role — the same access as the rest of the Installation app.
- Checklists configured (Installation › Configuration › Site QC › QC Checklists) and inspections actually submitted. One sample checklist ships; answers start at zero, so a fresh site shows greyed sample data on the graph and pivot screens (the list-first screens simply open empty).
Steps
-
01
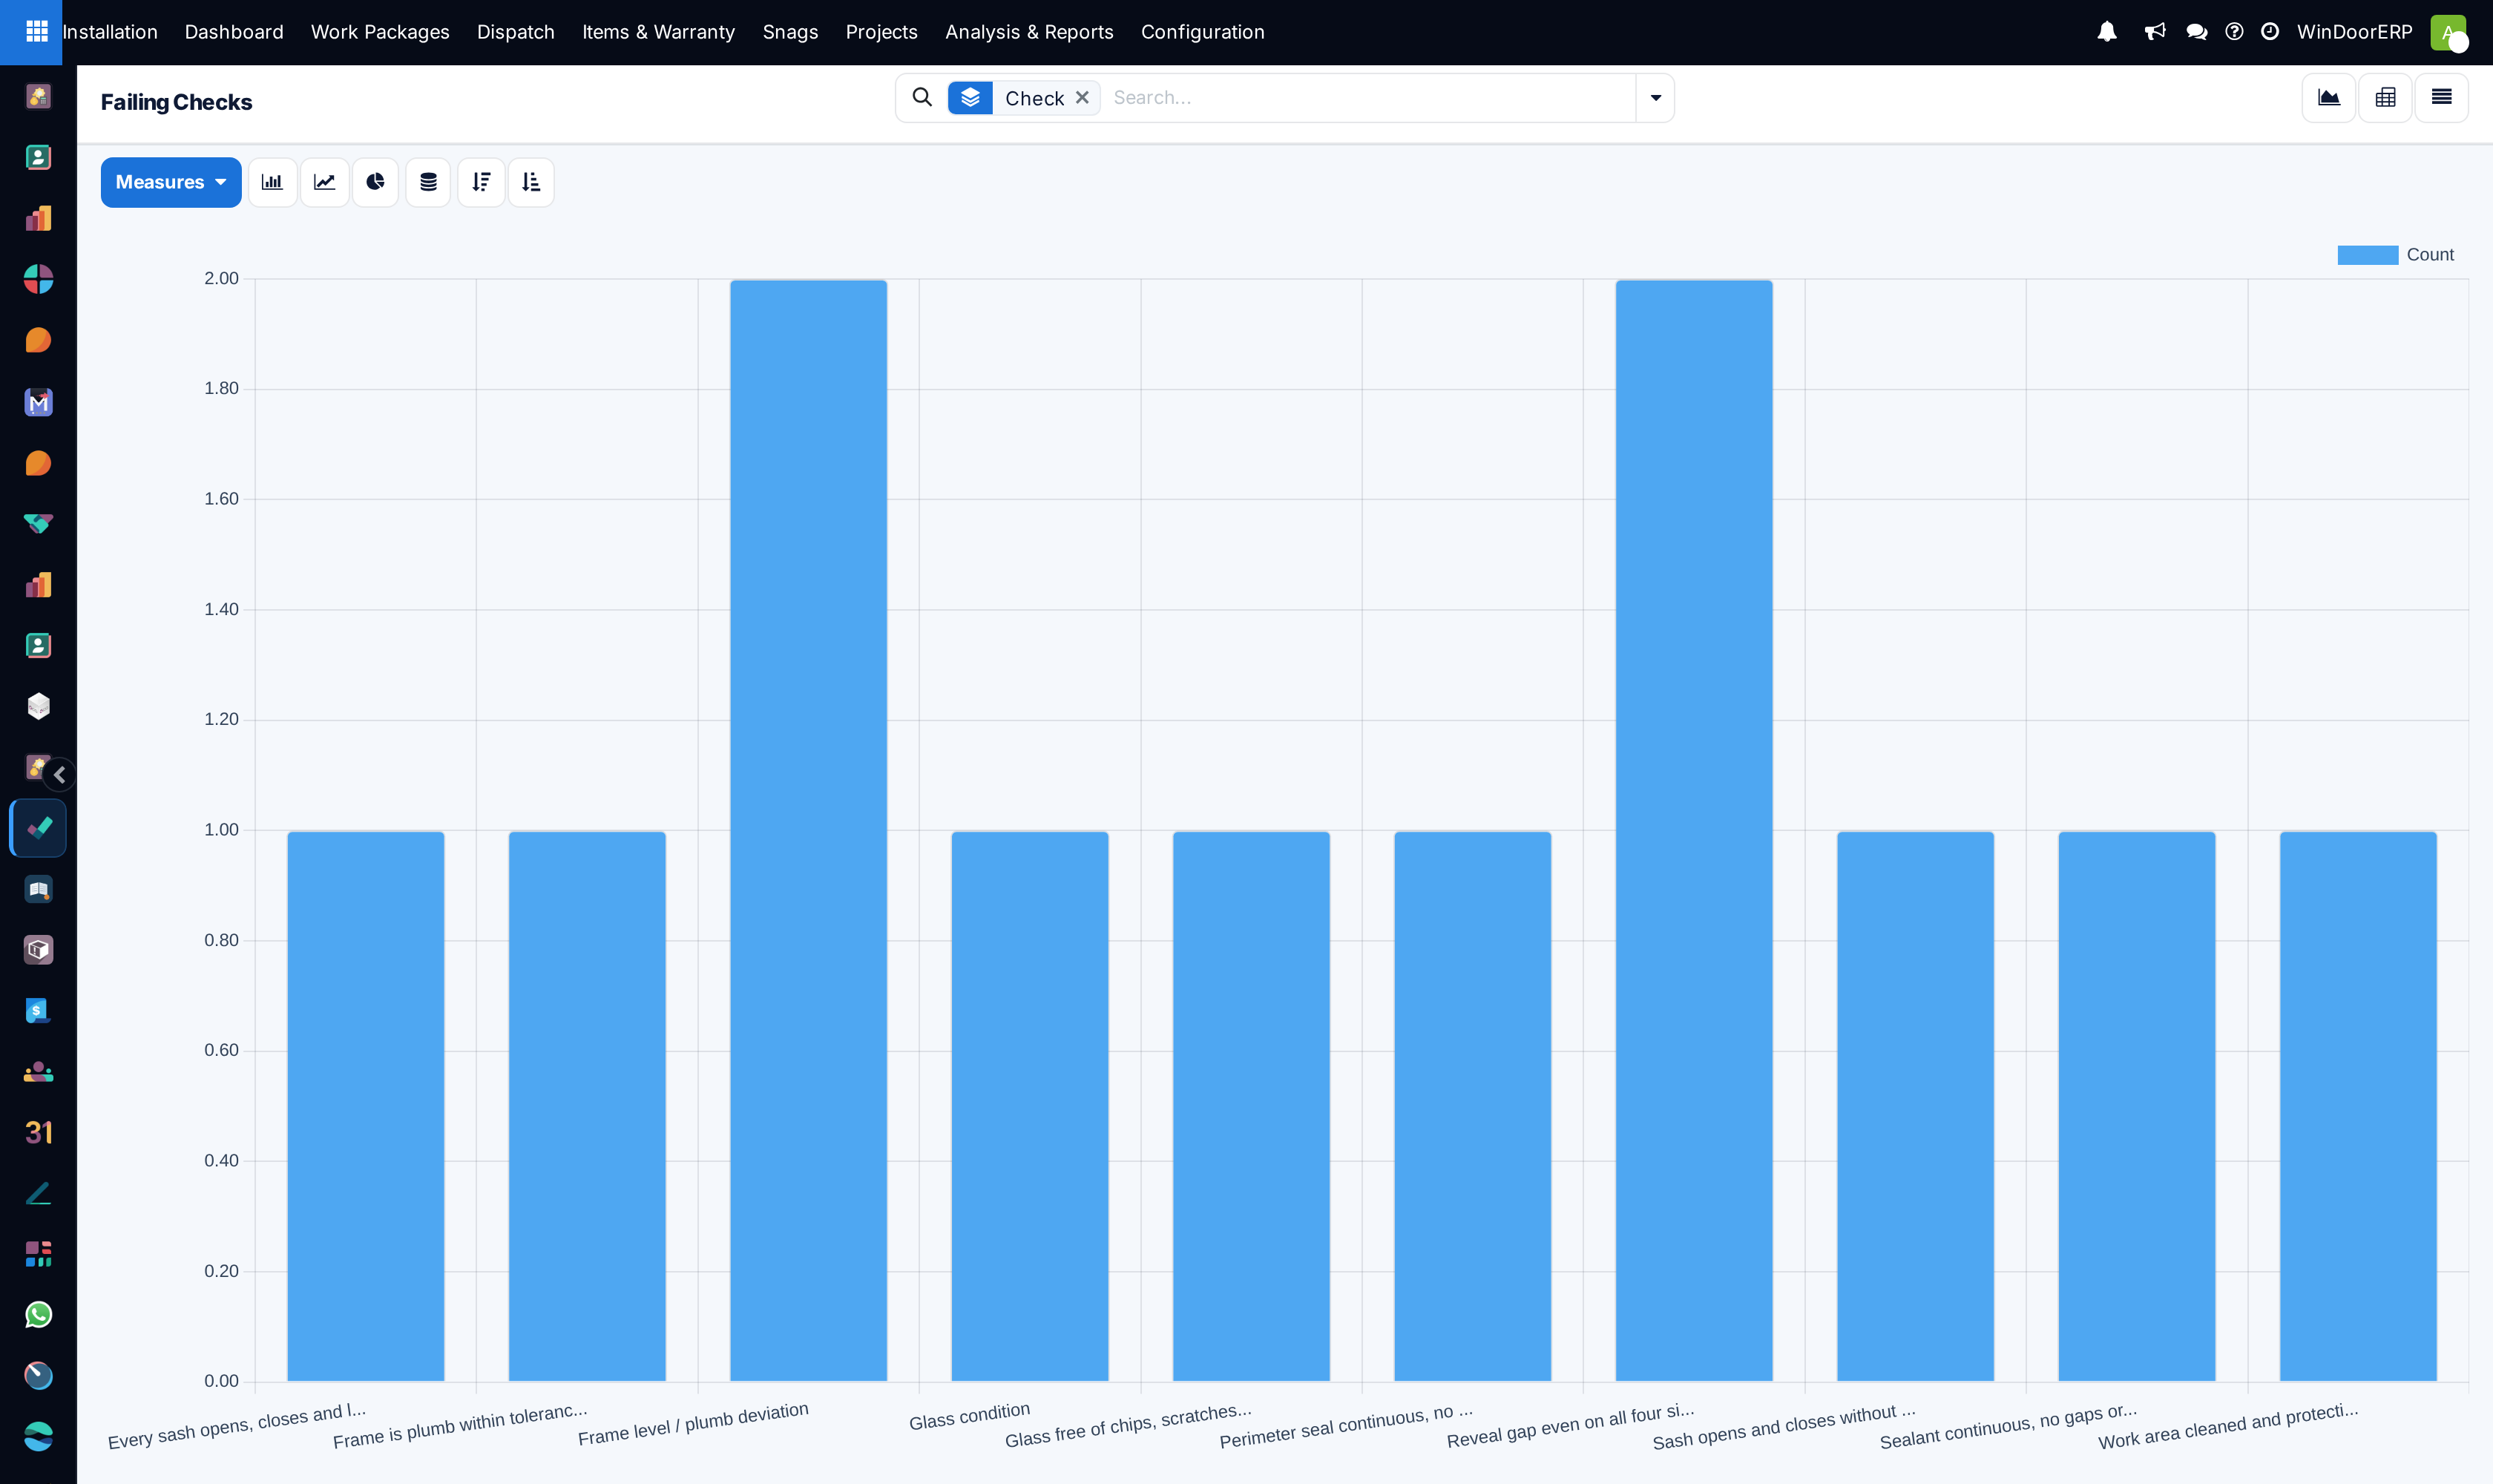
Open Analysis & Reports › Site QC Failures first — it is the manager's report: only failed checks, grouped by check, so the top bar is your biggest site problem.
-
02
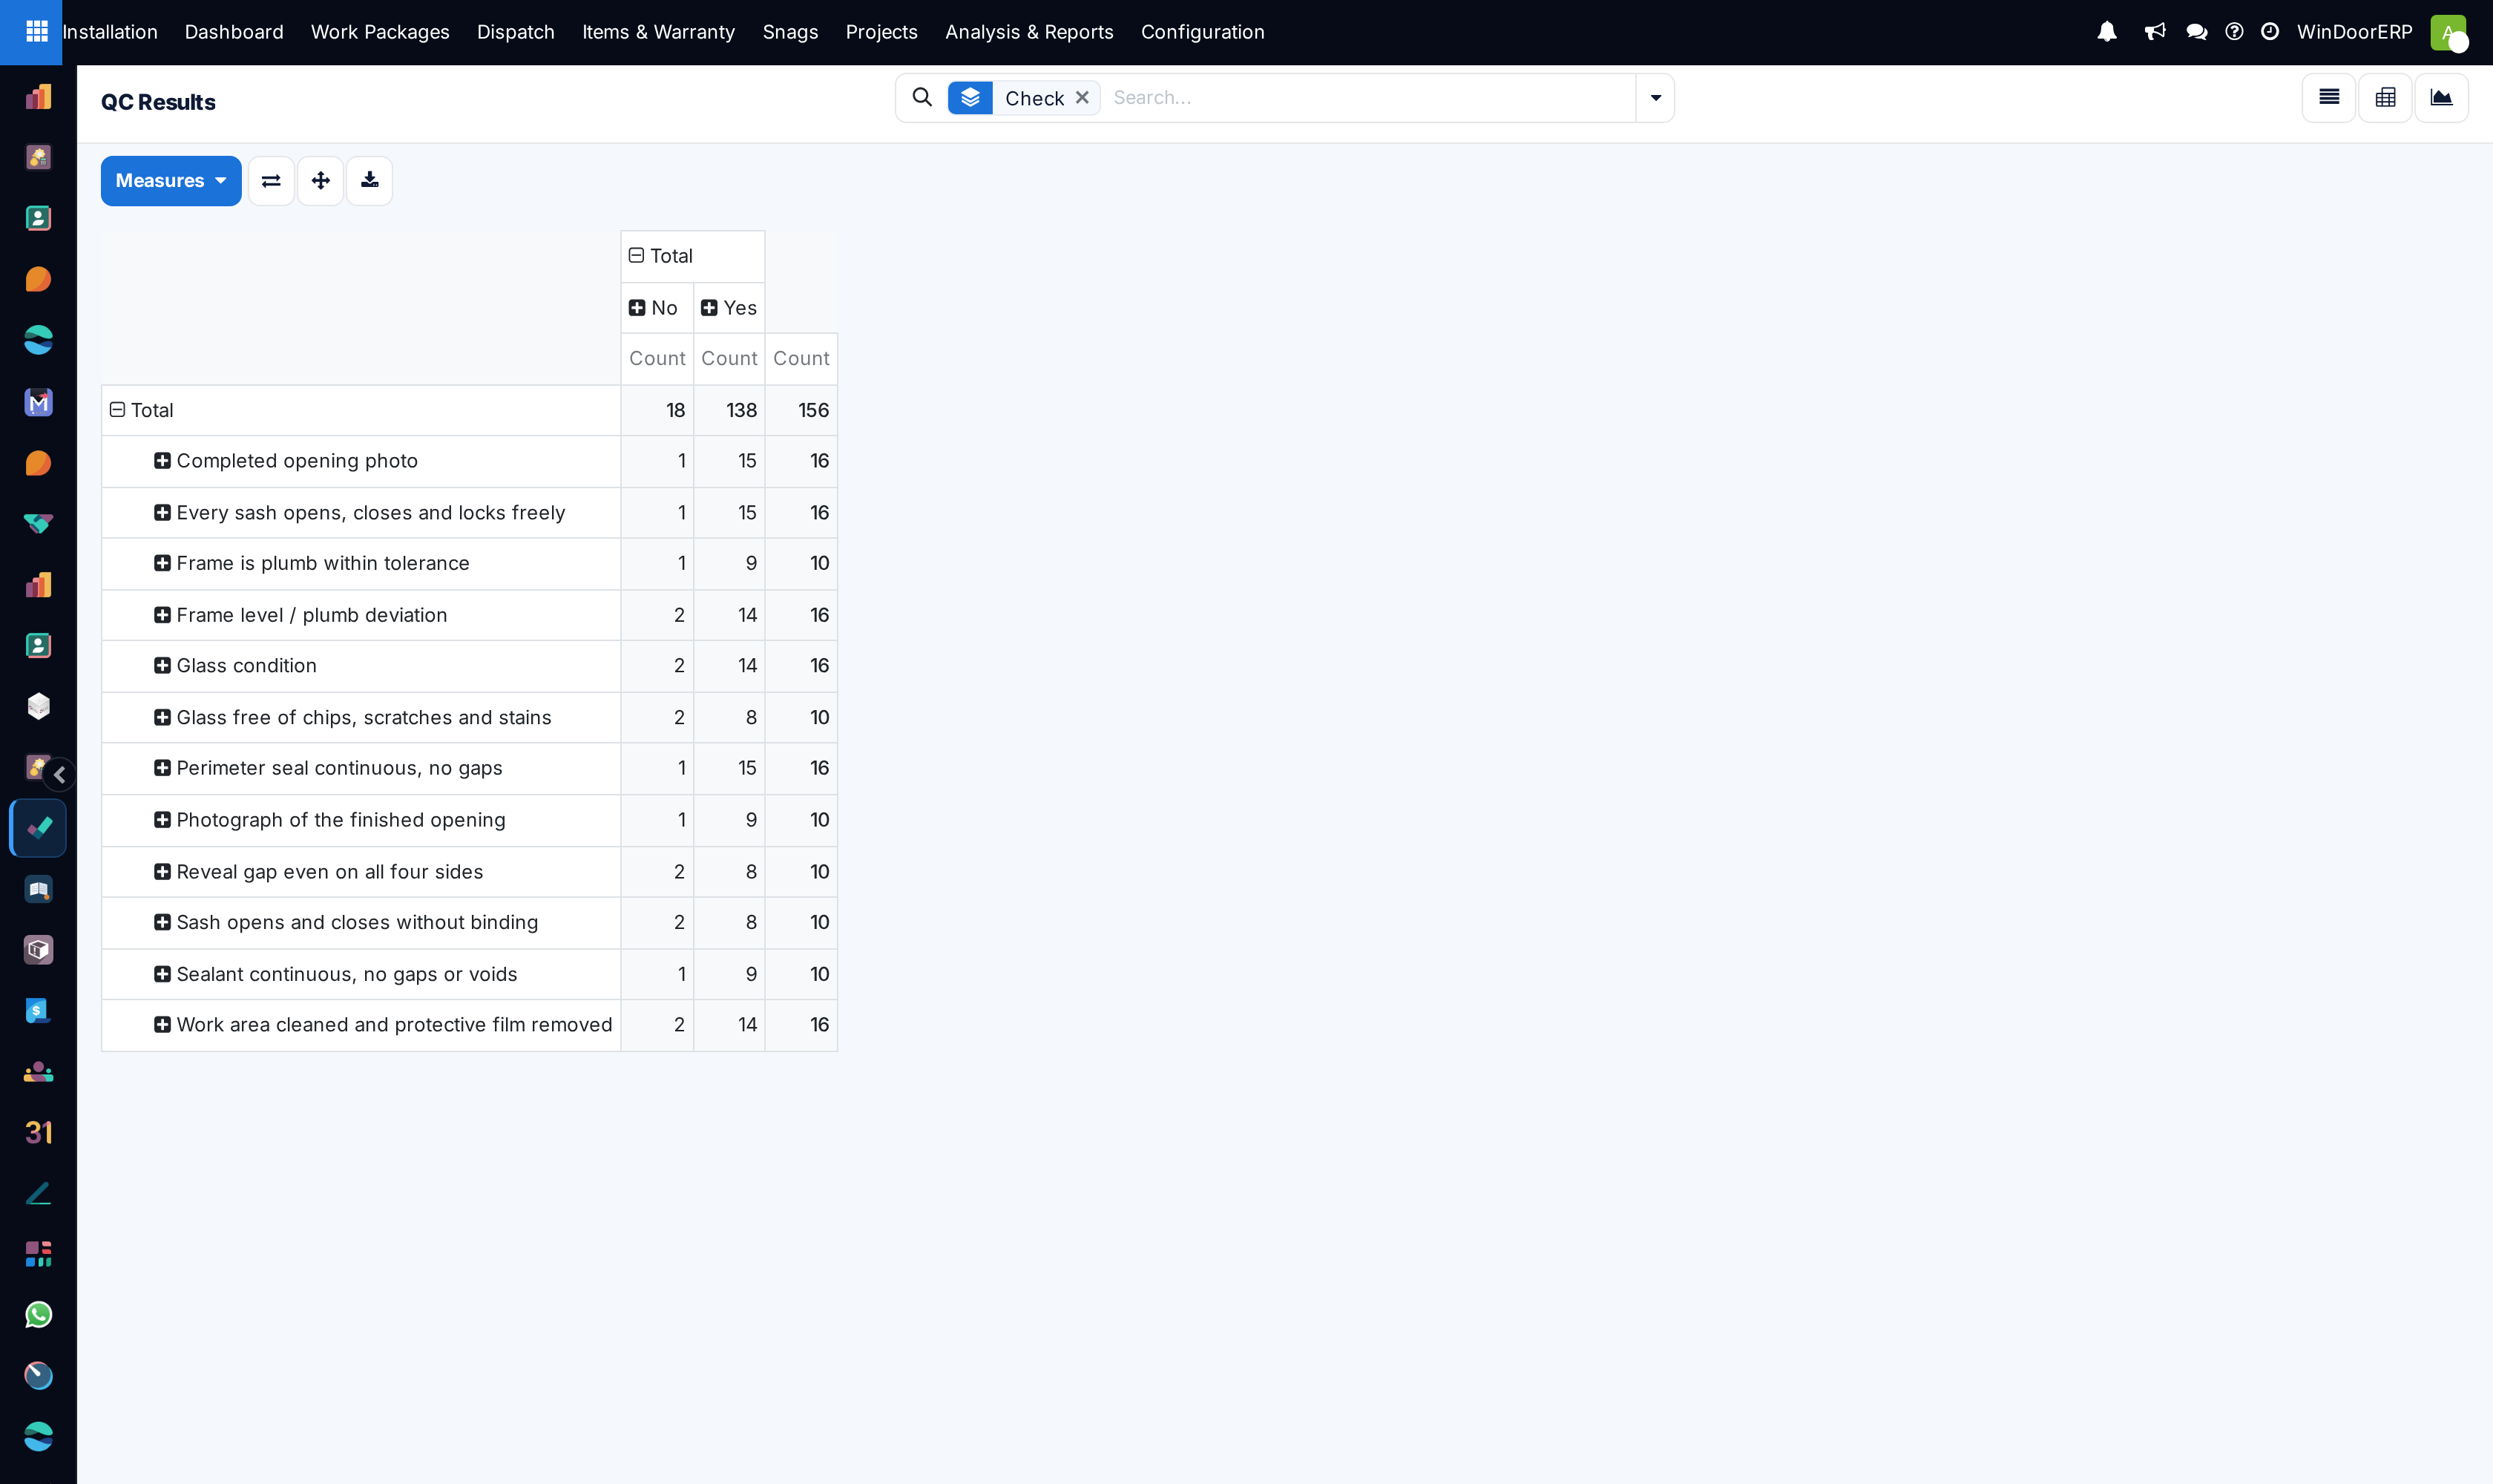
Cross-check in Site QC Results: every answered check, the pivot crossing checks against passed/failed counts. Filters cover Failed, Passed, Critical and This Month; group by project, work package, inspector, product or severity.
-
03
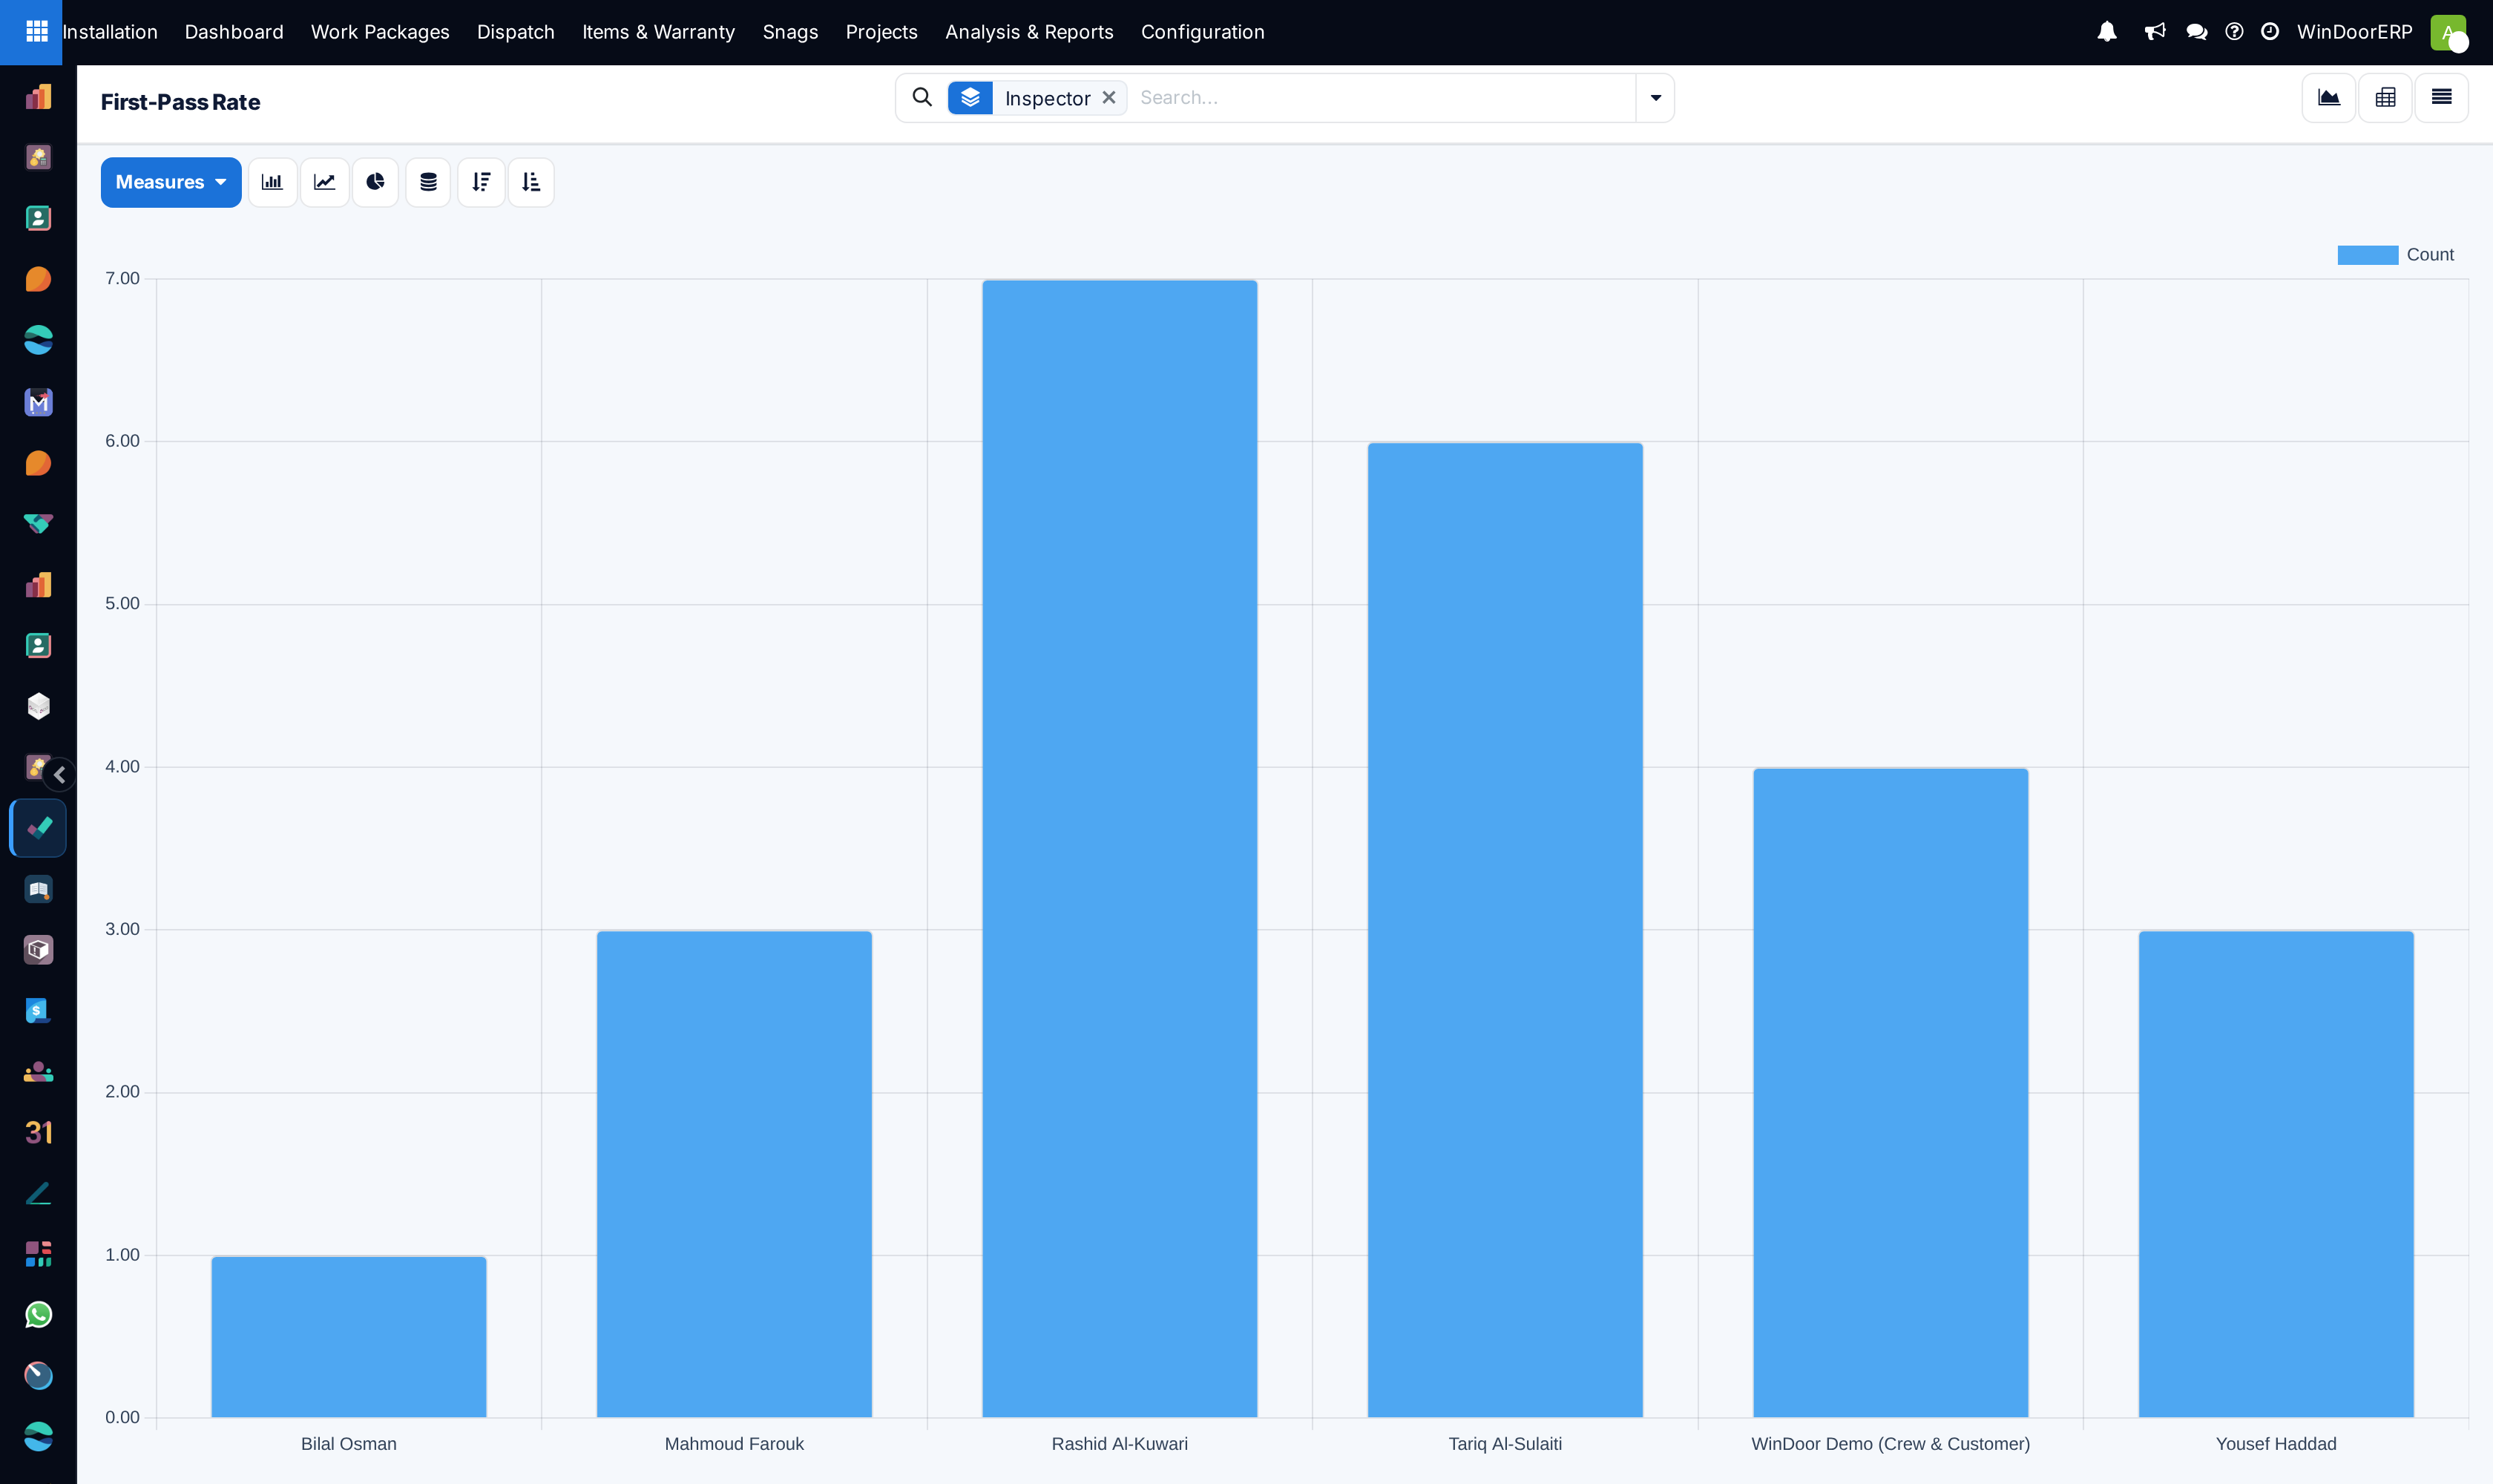
Open Site QC First-Pass Rate: only each opening's first inspection, grouped by inspector by default — read the passed-versus-failed split per group as the rate (there is no single stored percentage).
-
04
Open Site QC Rework: attempts after the first, with Rework Hours — the elapsed time from the first failed inspection to the eventual pass — as the pivot measure per inspector or project.
-
05
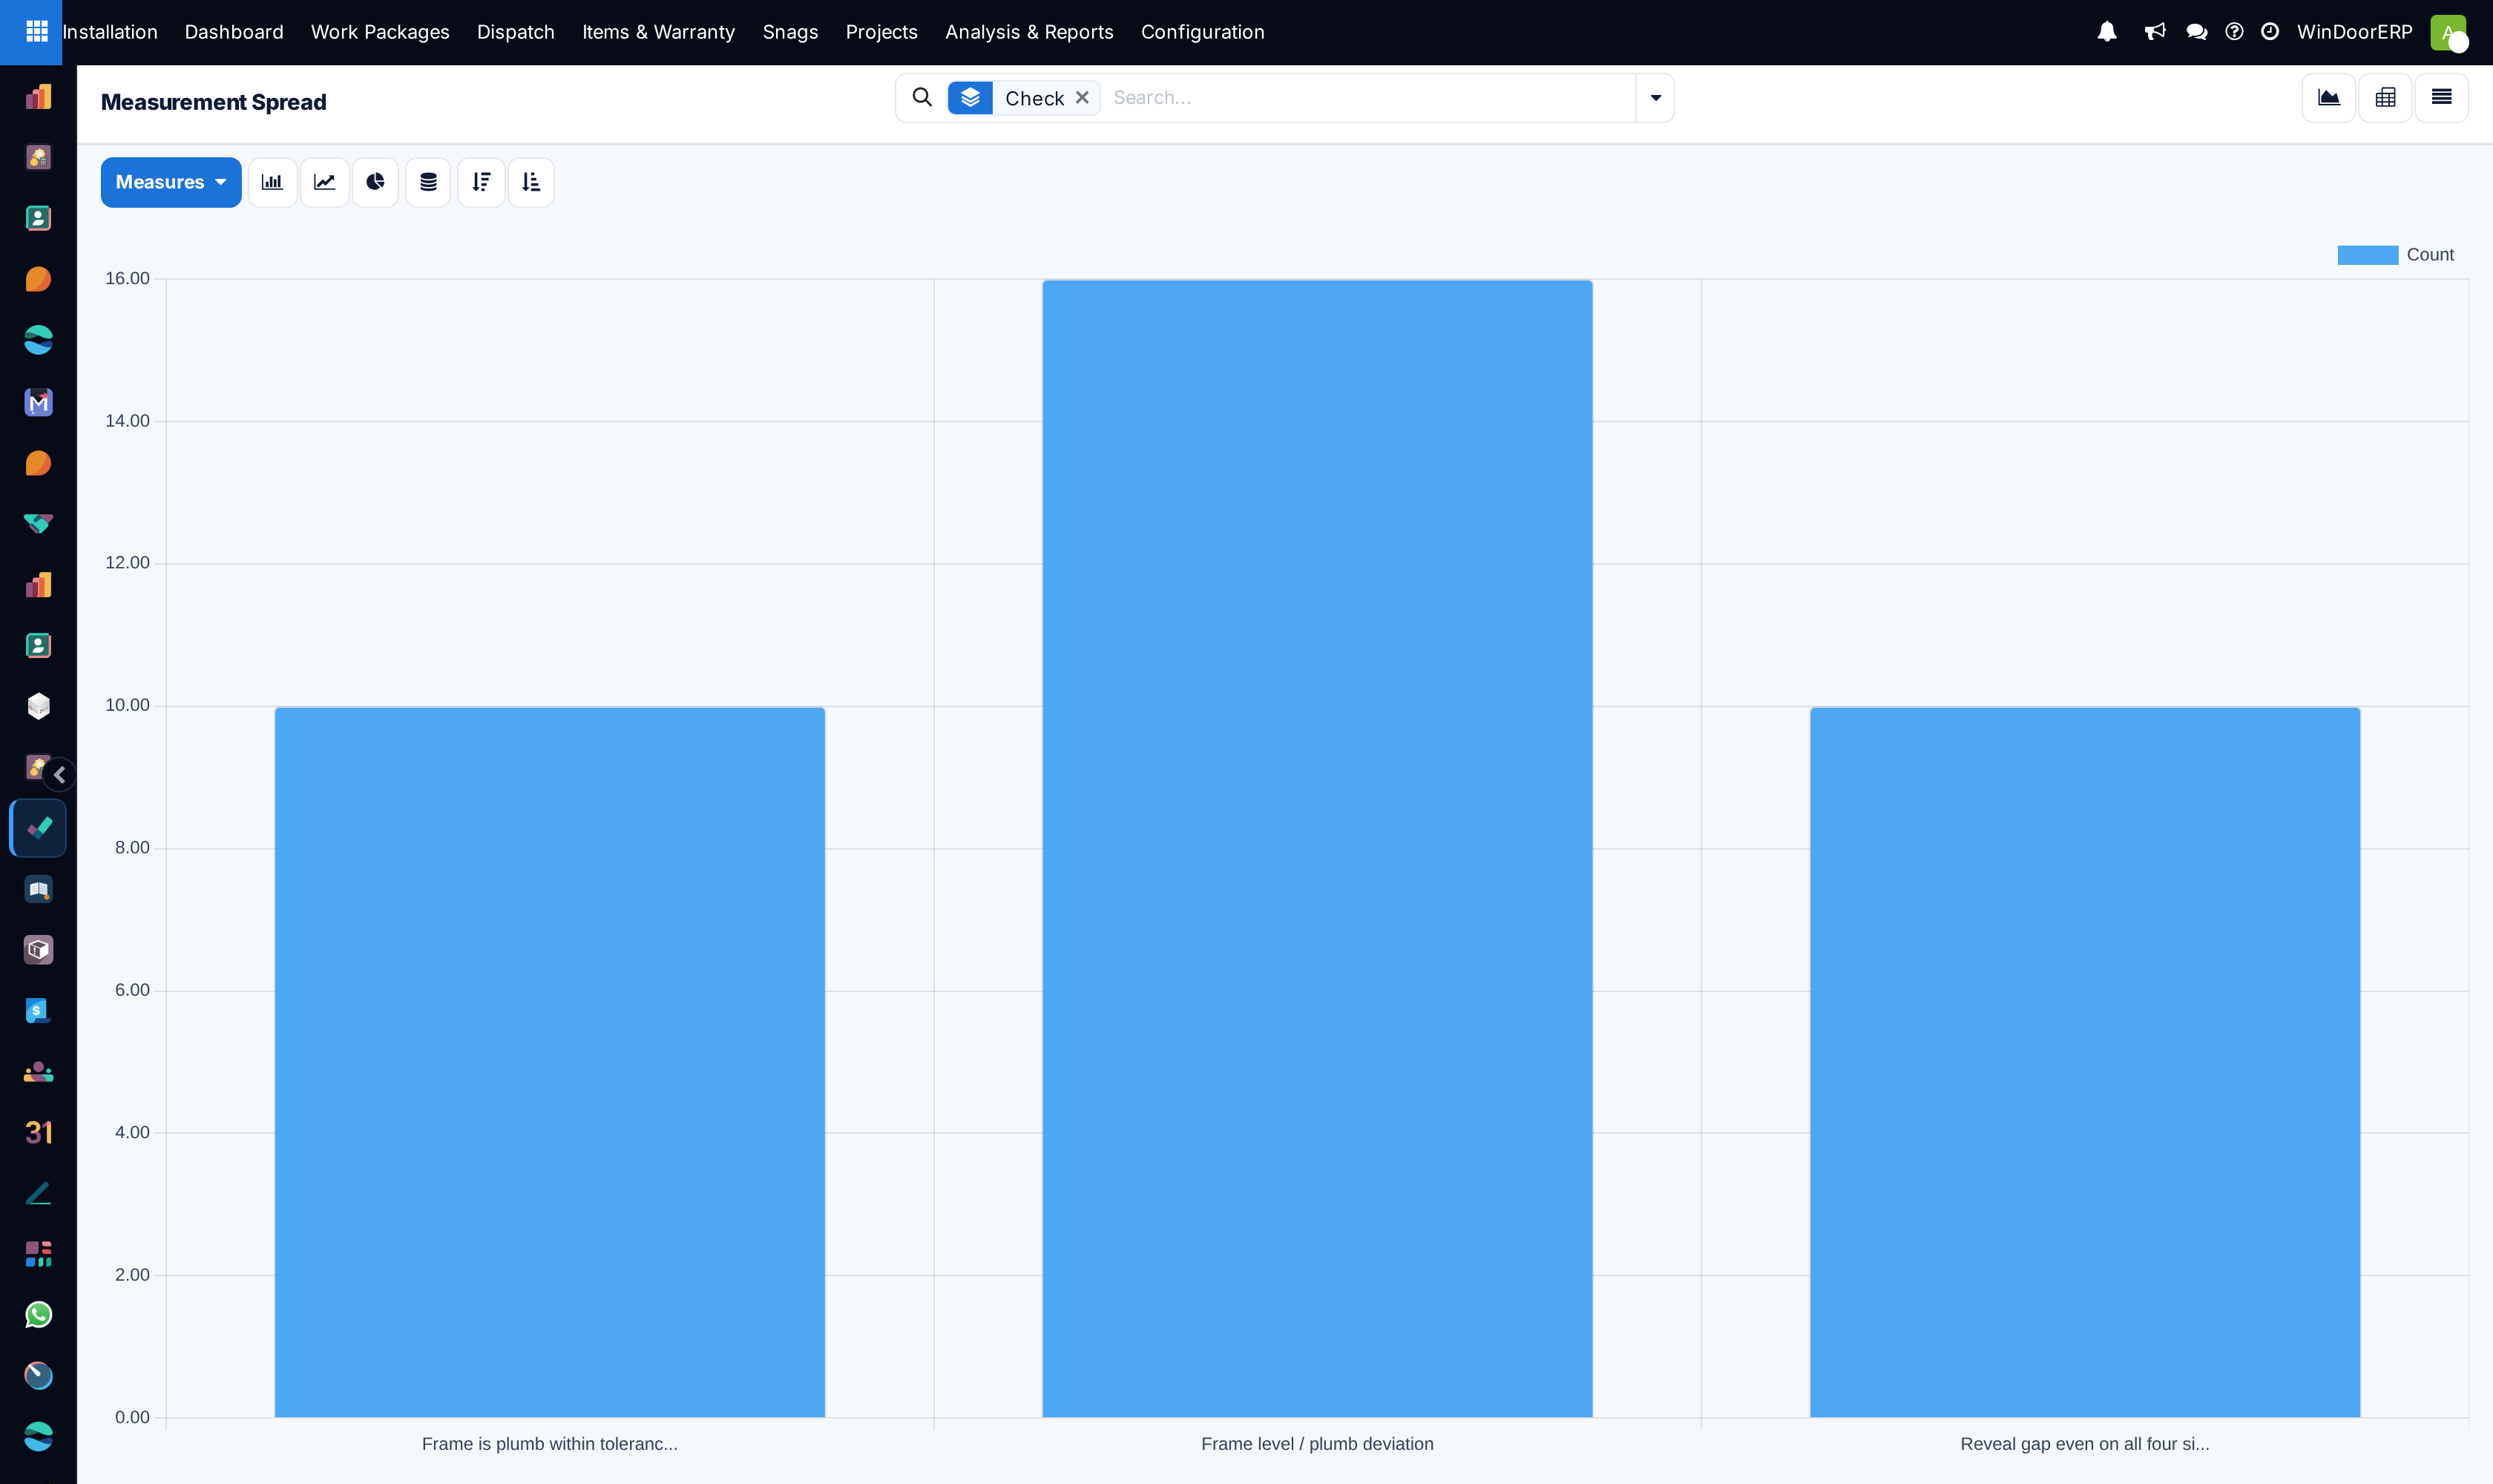
Open Site QC Measurements for the dimensional checks: the Deviation measure is how far outside tolerance each measured value landed — rising breach counts or magnitudes per check are the early warning (values inside the band record a deviation of zero).
The five screens
| Screen | Rows | Scope and default |
|---|---|---|
| Site QC Results | All check rows | Everything, grouped by check — including still-blank rows from half-filled sheets, so apply the Passed/Failed filters for answered-only counts. The list shows the measured value, deviation, severity and the pass toggle. |
| Site QC Failures | Answered checks | Pre-filtered to failures only, grouped by check. |
| Site QC First-Pass Rate | Inspection attempts | First attempts only, grouped by inspector; the graph can also split passed-versus-failed per week. |
| Site QC Rework | Inspection attempts | Attempts beyond the first, grouped by project, measuring Rework Hours. |
| Site QC Measurements | Answered checks | Measurement-type checks only, graphing Deviation per check. |
How a check passes — the rules behind the numbers
- Pass/fail and yes/no checks pass on the obvious answer; choice checks pass when the selected option is in the checklist's passing list; photo checks pass when a photo is attached.
- Measurements pass inside the tolerance band — and a check whose tolerances are both zero is informational: it always passes and records the value only.
- A check that requires an evidence photo fails without one, whatever the measured answer says.
- Deviation is recorded only when a value lands outside tolerance — the distance beyond the nearer bound.
- First pass = attempt number 1 and passed. Rework Hours is wall-clock time between the first failed attempt and the eventual passing one — elapsed hours, not labour booked and not money; it lands on the passing re-attempt only, so intermediate failures carry zero and a job never re-passed contributes nothing.
Troubleshooting
| The graphs show smooth grey data on a new site | Sample mode on the chart and pivot views — no inspections submitted yet. It disappears with the first real submission; the list-first screens just open empty. Note the breadcrumb titles differ slightly from the menu labels (Failing Checks, Rework Loop, Measurement Spread) — same screens. |
|---|---|
| A measurement inside tolerance shows as failed | The check demands an evidence photo and none was attached — missing evidence fails the check regardless of the value. |
| An "always passing" measurement check | Both tolerances are 0.0 — that makes it informational by design. Set real bounds if it should gate. |
| Expected rework costs, found only hours | Correct — the module measures elapsed hours between failure and pass. Cost it outside if you need money. |
| First-pass numbers look too good | Only submitted inspections count. Crews fixing issues before submitting the sheet never register a failed first attempt. |
| The five menus are missing | The Site QC toggle is off in the Installation settings, or you lack the installation role — the entries live inside the Installation app and follow its access. |
Common mistakes
- Reading rework hours as technician time on the job — it is calendar time between two inspections, including nights and weekends.
- Comparing inspectors' first-pass rates without comparing what they inspect — hard checklists depress the rate.
- Leaving tolerances at zero on dimensional checks and believing the site "never fails a measurement".
- Building the Pareto while crews free-type answers into the wrong checklist — the analytics are only as clean as the checklist discipline.
- Judging quality on Results counts alone: an opening inspected three times contributes three rows; use First-Pass Rate for the per-opening truth.
Was this article helpful?
Thanks — your feedback helps.
Running a window or door factory?
Ask for a demo