Conduct Win/Loss pipeline analysis, conversion rates, and sales cohort performance
What this does
Provides C-suite executives with end-to-end analytical dashboards to measure win/loss ratios, average deal cycles, stage conversion velocity, and lost reasons across manufacturing branches.
Before you start
- Sales Manager or Executive permissions.
Steps
Important
Filtering Win/Loss analysis by Profile Series reveals which aluminium systems deliver the highest commercial closing rates.
-
01
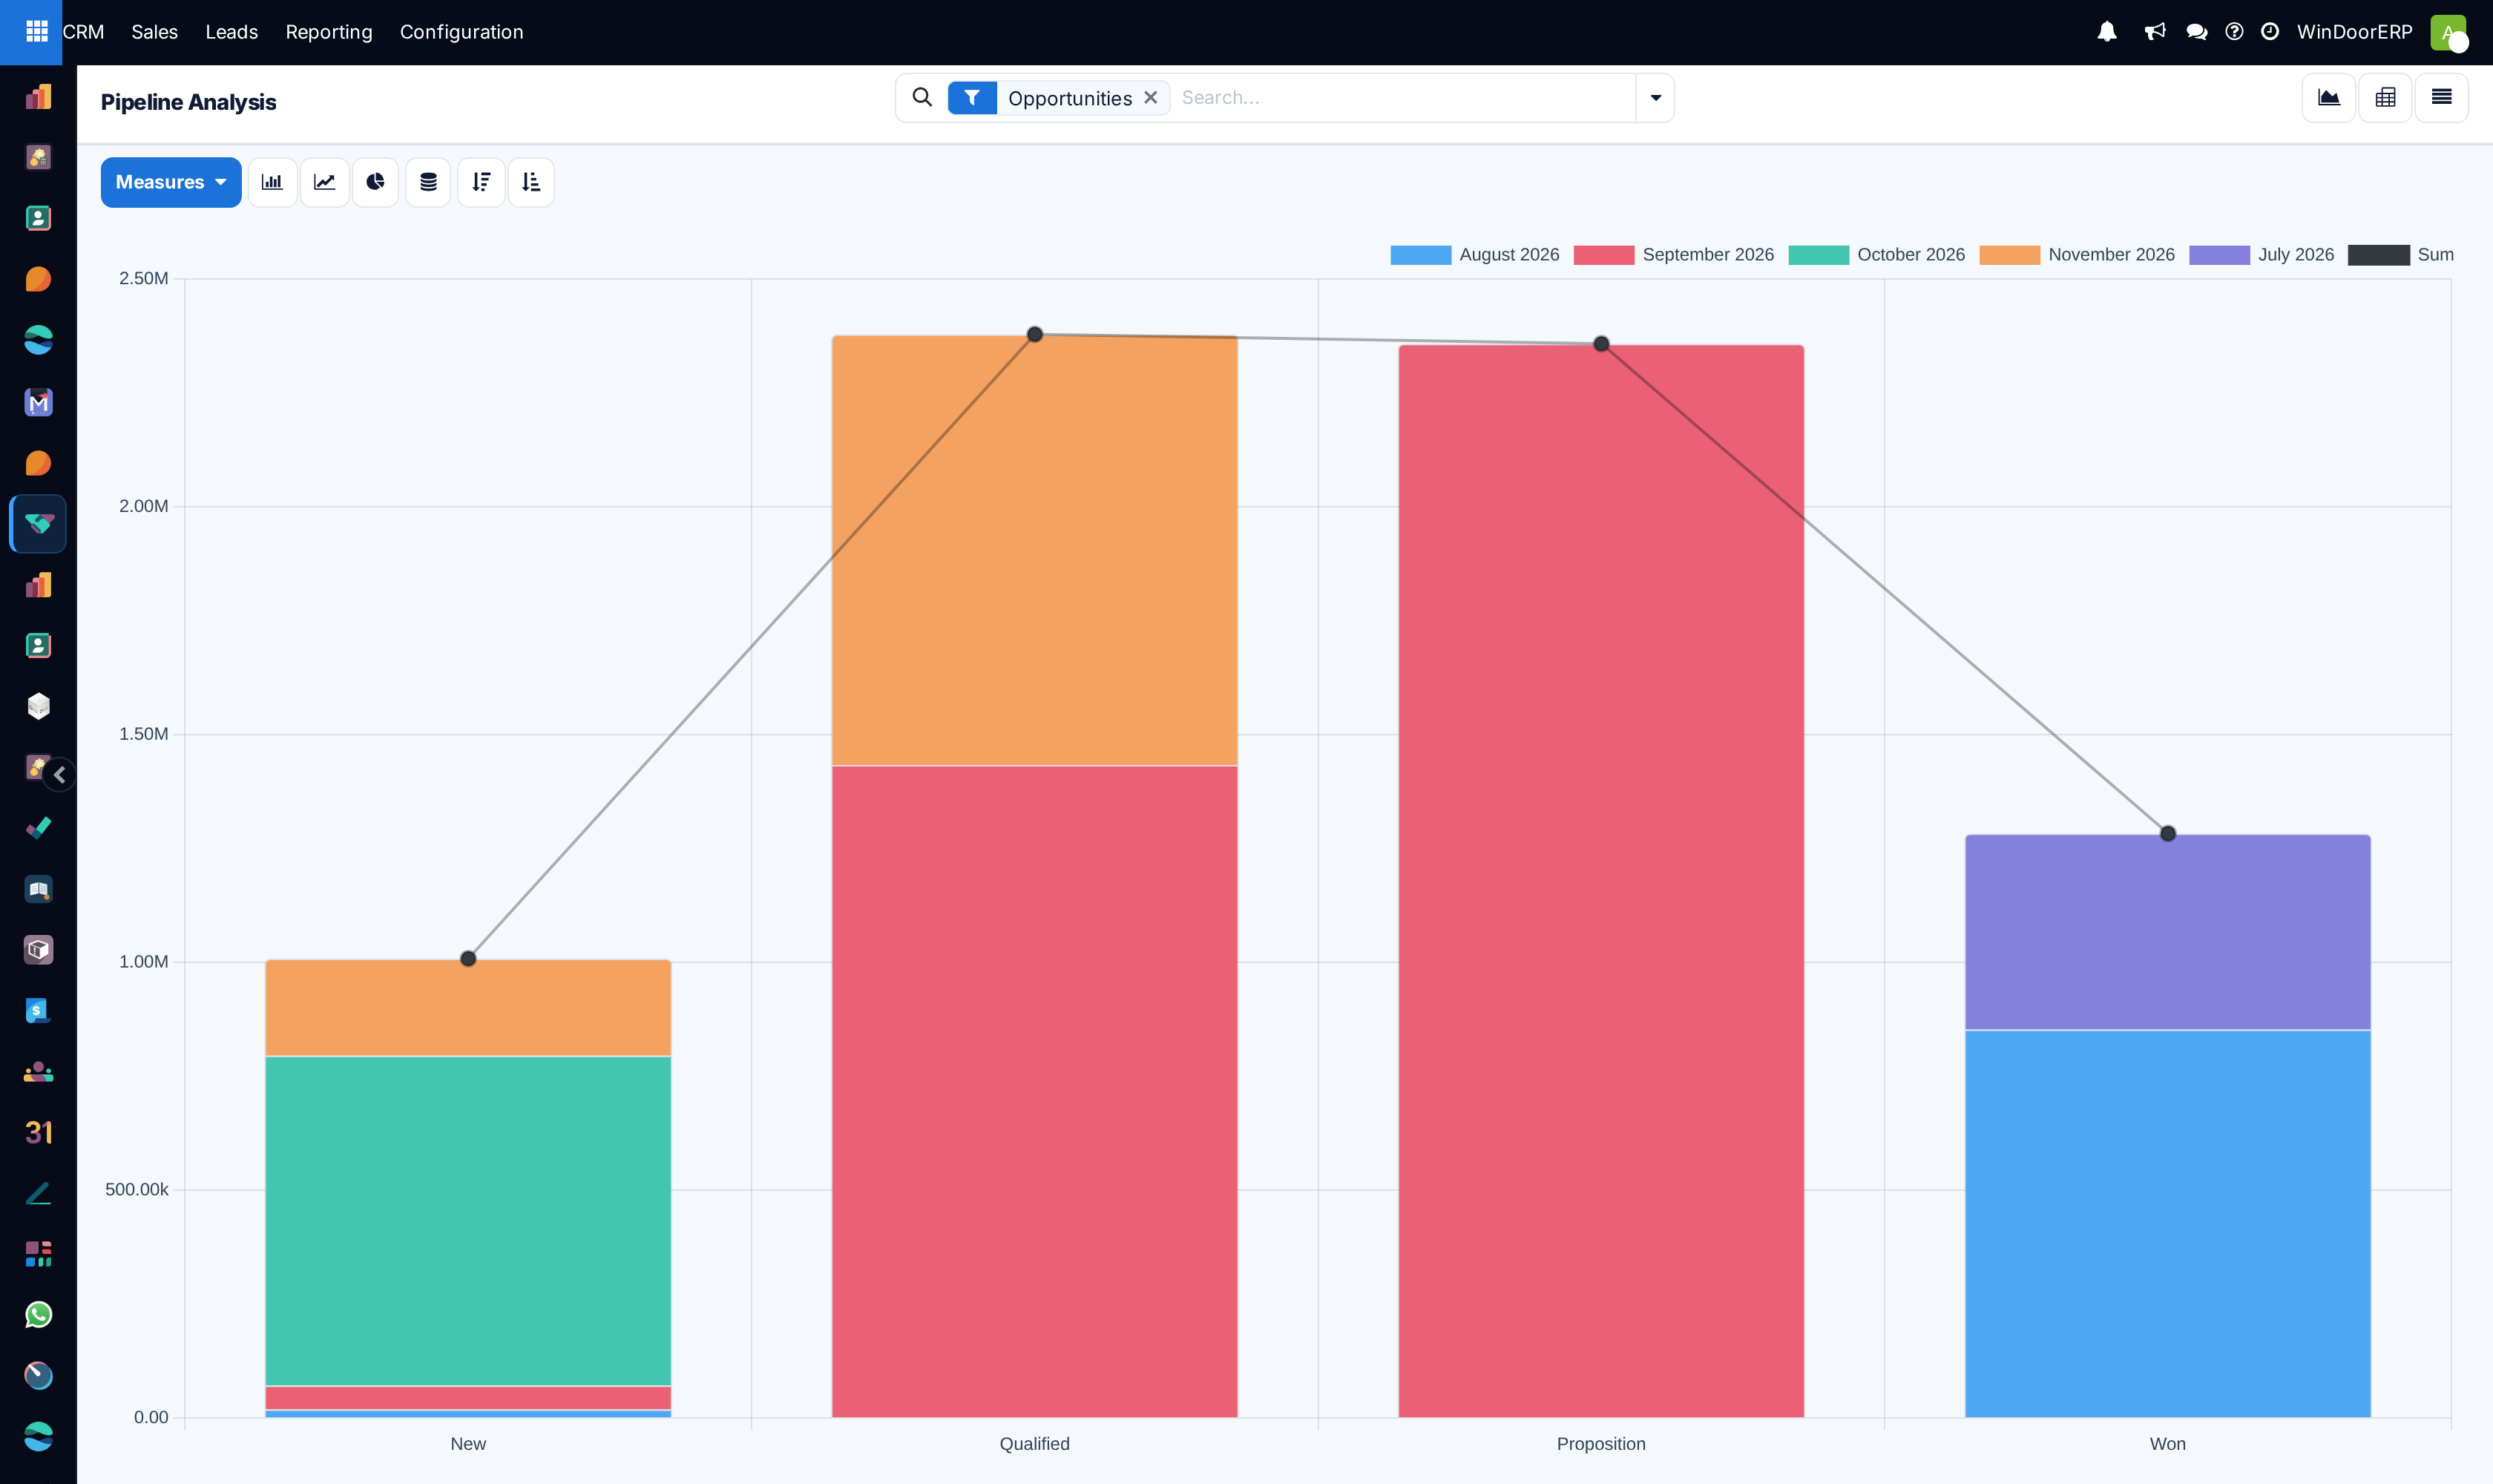
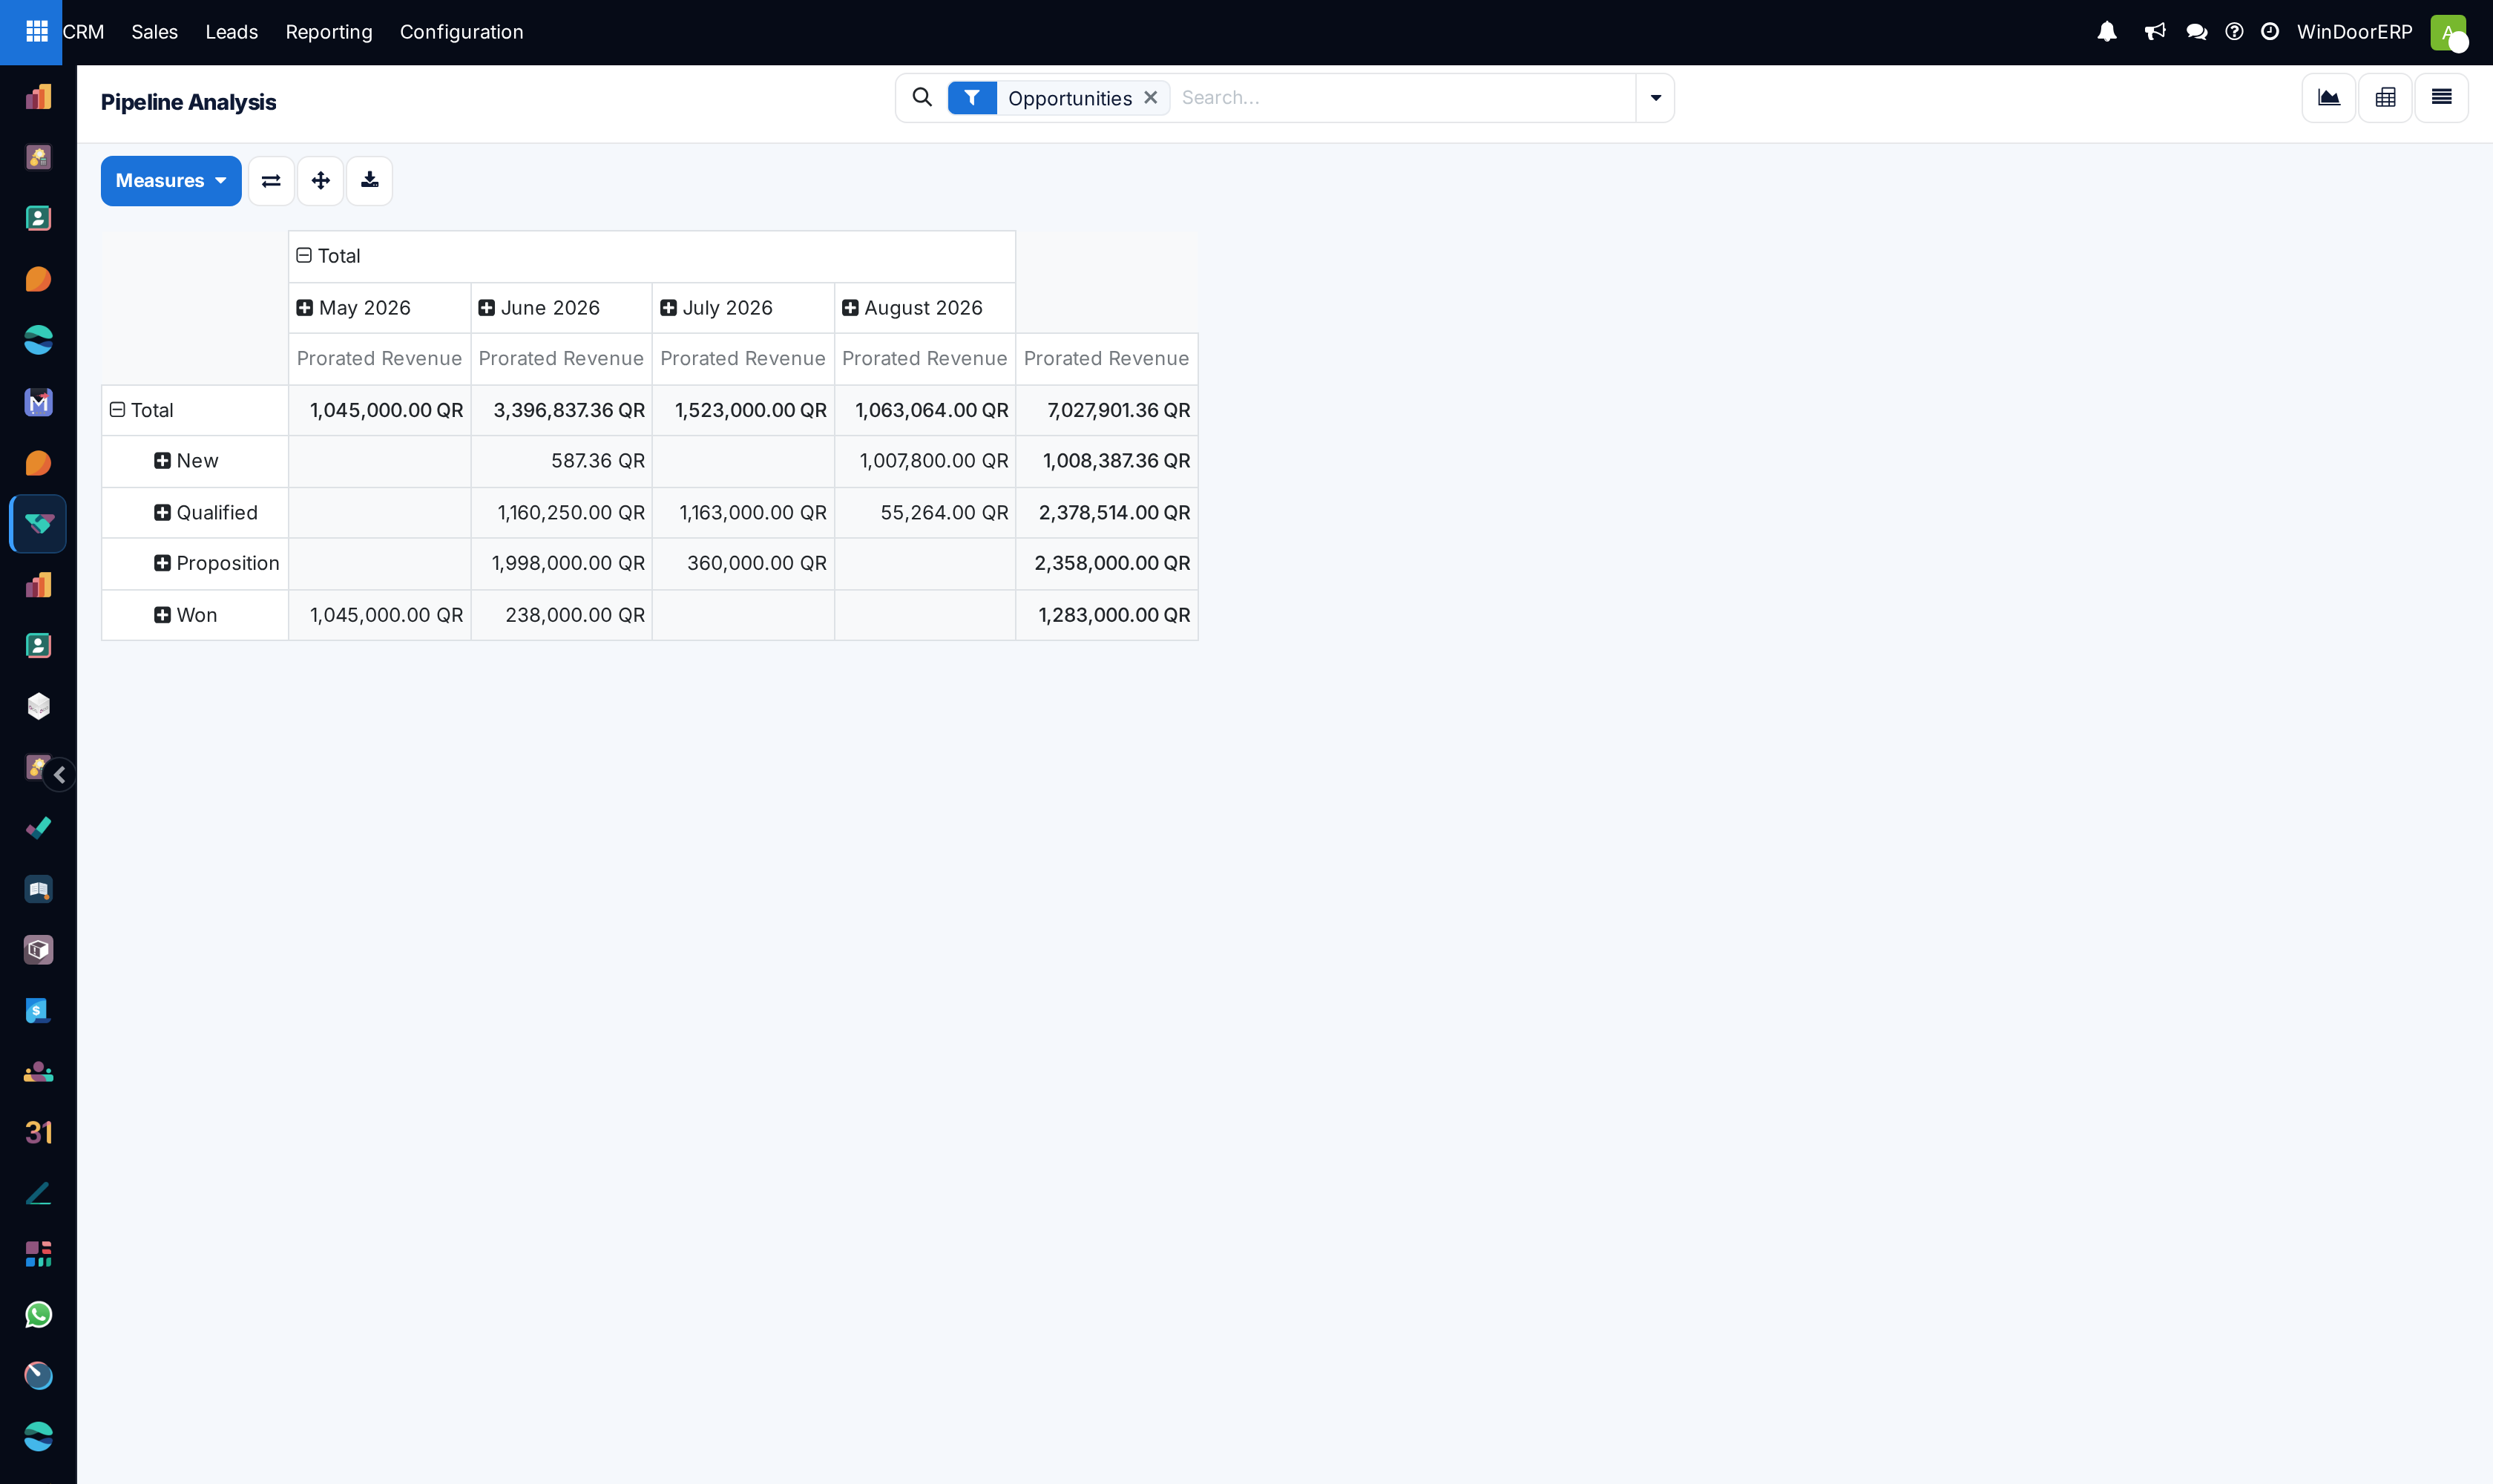
Open CRM › Reporting › Pipeline.
-
02
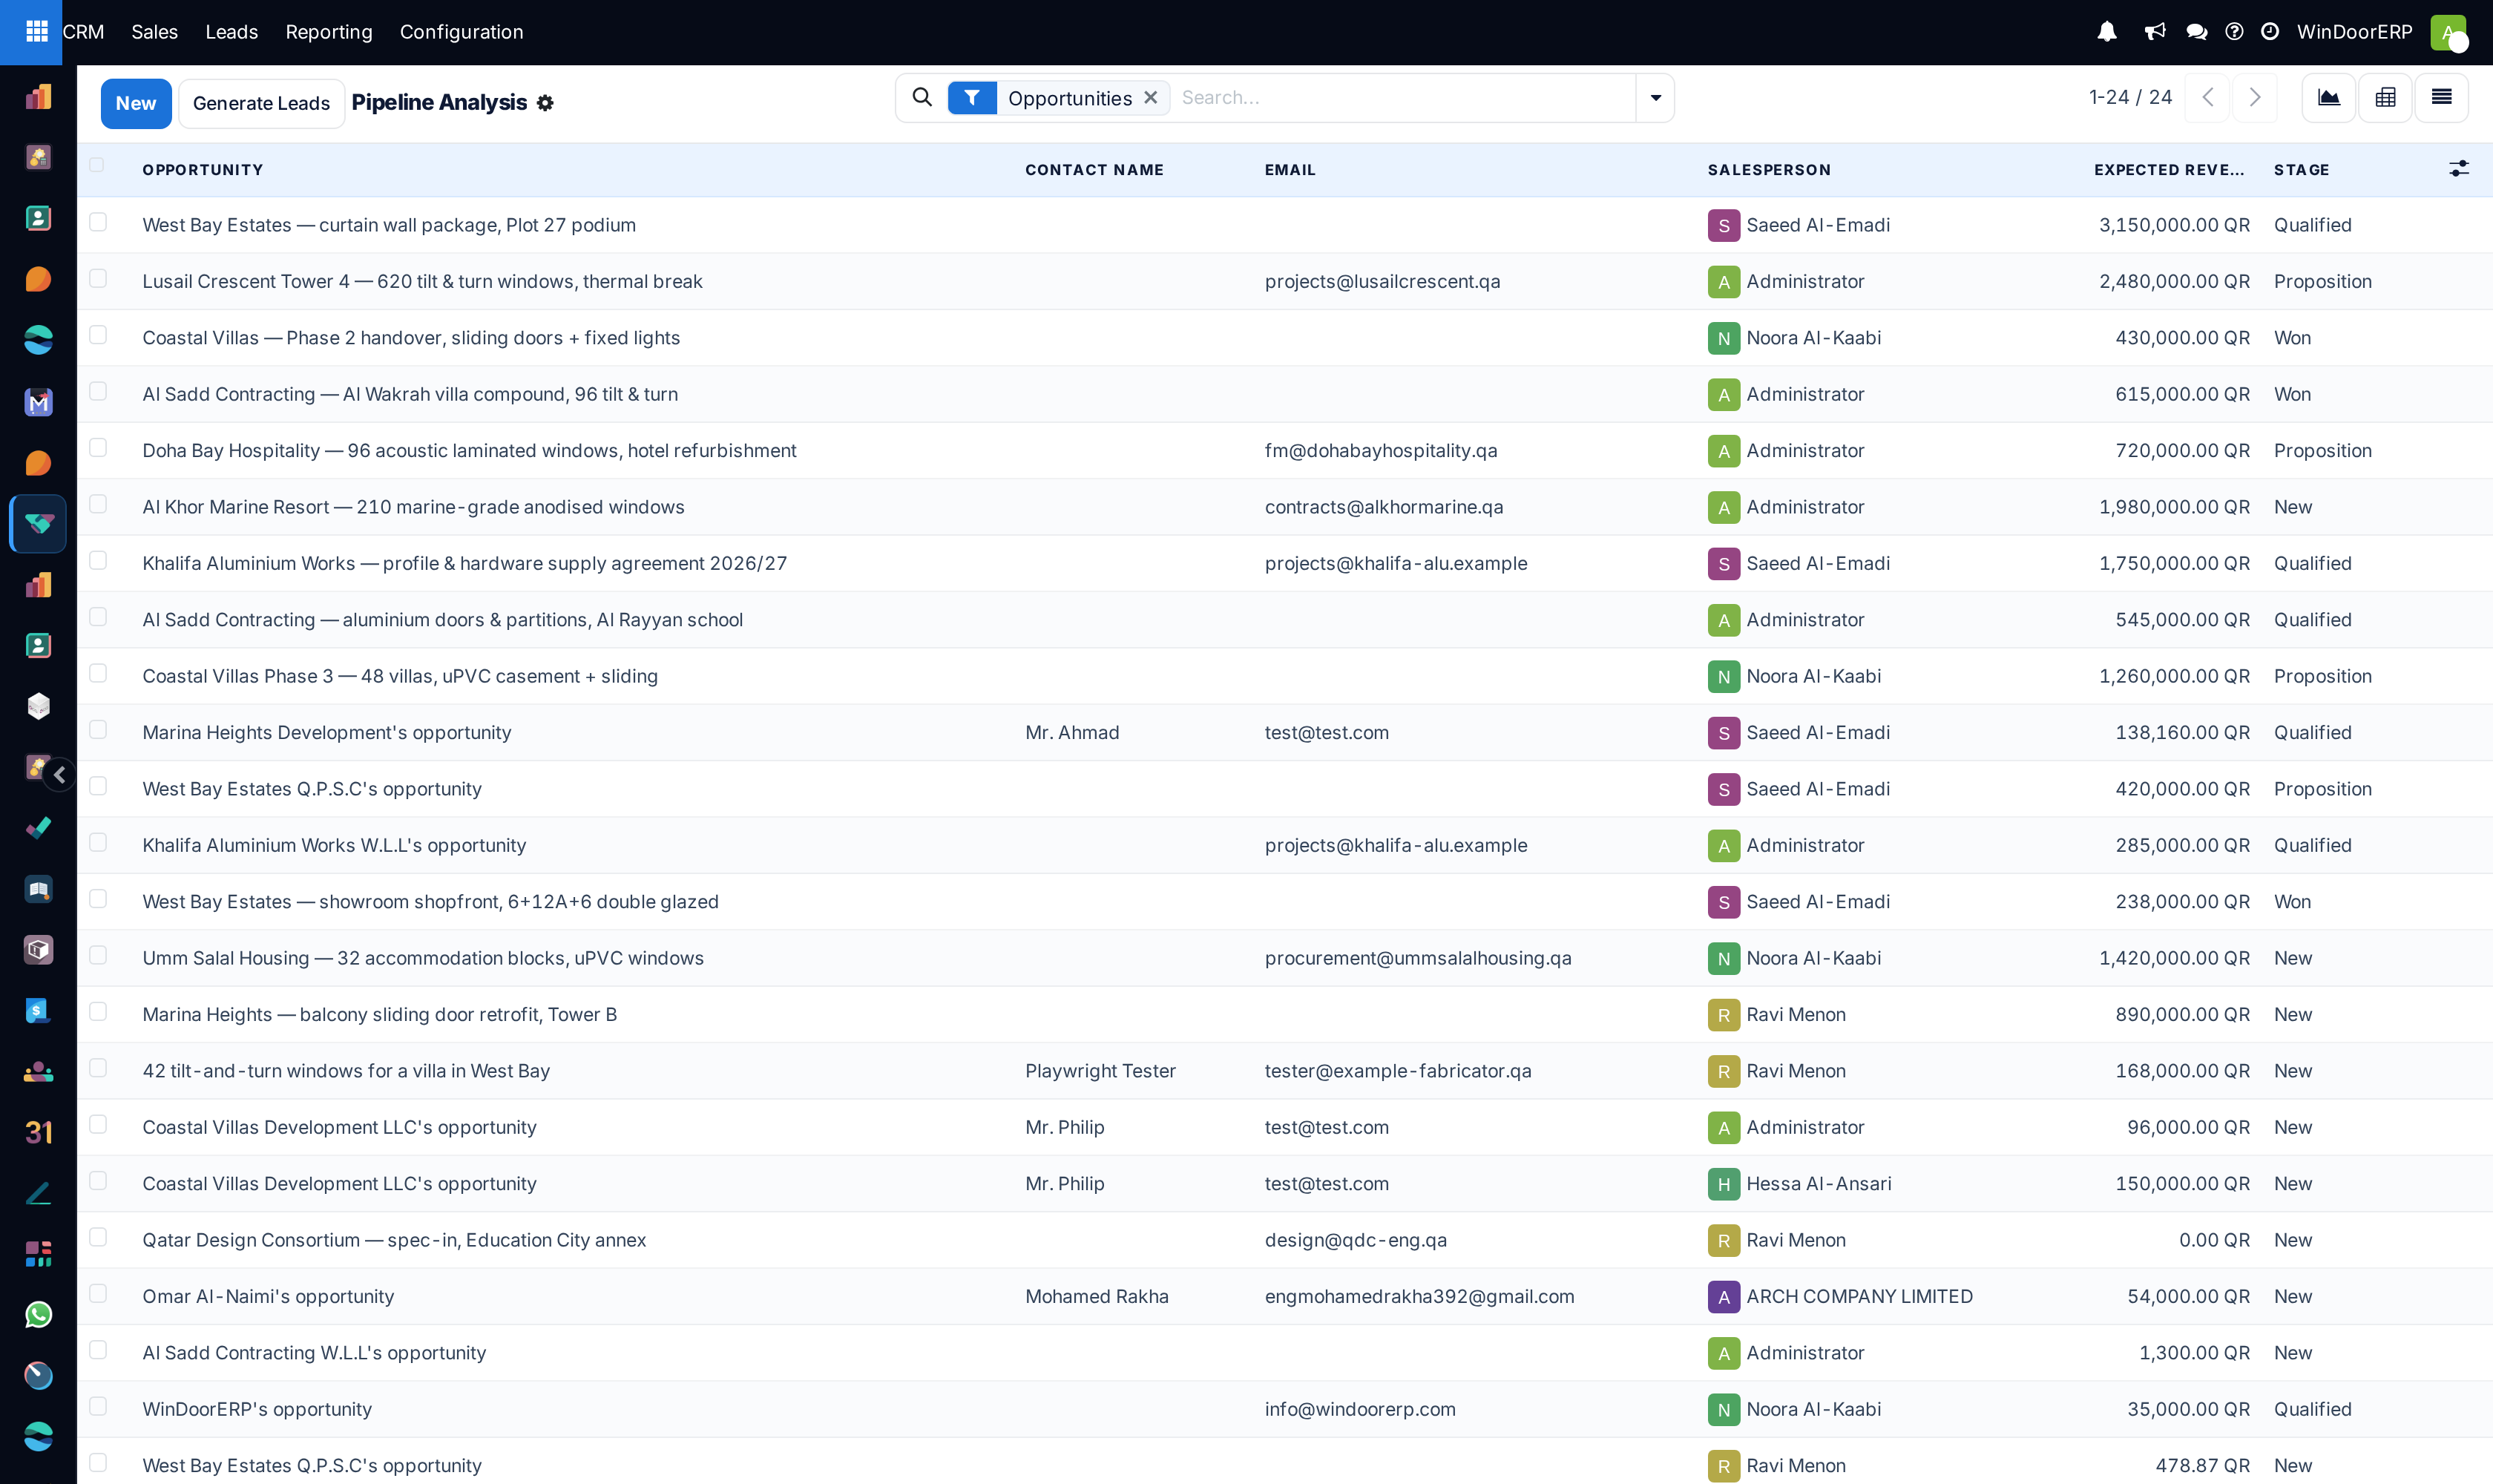
Switch between Graph (Bar, Line, Pie), Pivot, and List views.
-
03
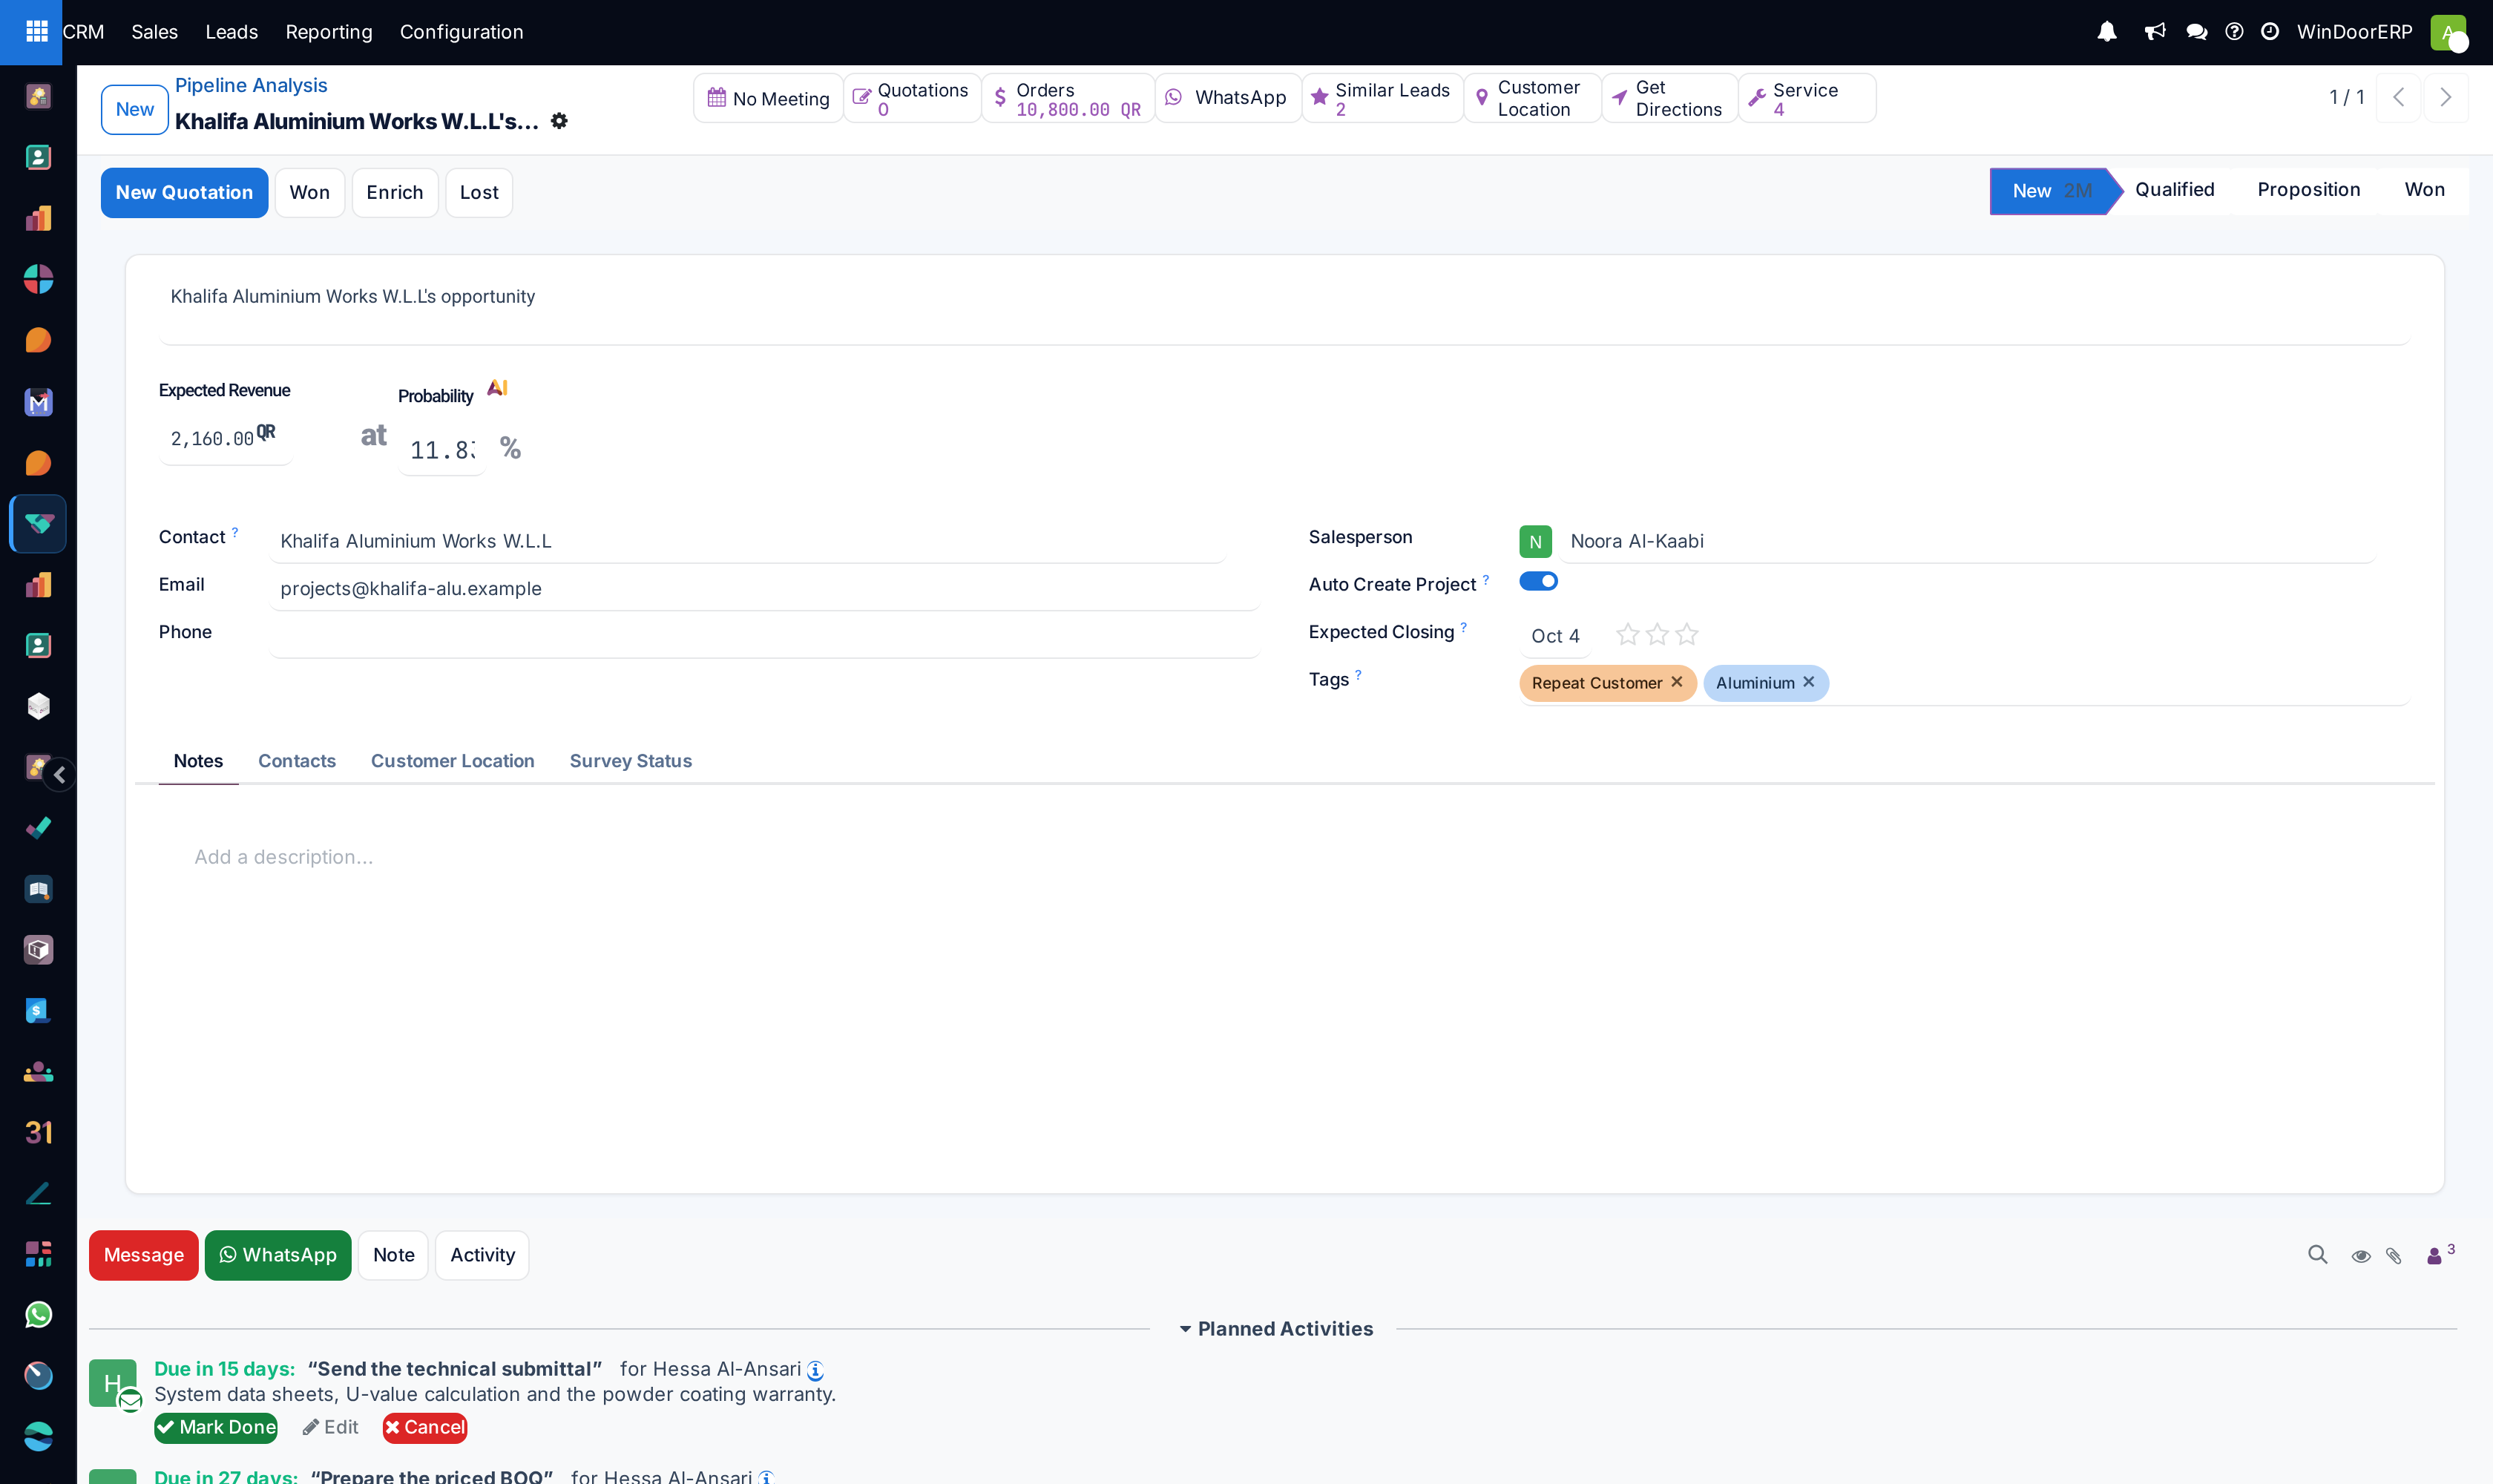
Analyze Win/Loss Ratio: filter by Won and Lost to evaluate conversion effectiveness.
-
04
Measure Days to Assign and Days to Close to identify bottlenecks in estimation drafting.
-
05
Group by Lost Reason to determine whether pricing, lead time, or specification limitations cause contract losses.
Common mistakes
- Analyzing pipeline metrics without excluding internal testing opportunity records.
- Comparing residential sales cycles directly against multi-year commercial facade tenders.
Was this article helpful?
Thanks — your feedback helps.
Running a window or door factory?
Ask for a demo