Build executive spreadsheet dashboards, custom KPI cards, and live business telemetry
What this does
Empowers executive leadership with customizable multi-tab spreadsheet dashboards combining live factory production throughput, sales pipeline velocity, and cash collection KPIs.
Before you start
- Executive or Managerial reporting privileges.
Steps
Important
Spreadsheet Dashboards update in real-time without requiring manual Excel exports or external BI data sync bridges.
-
01
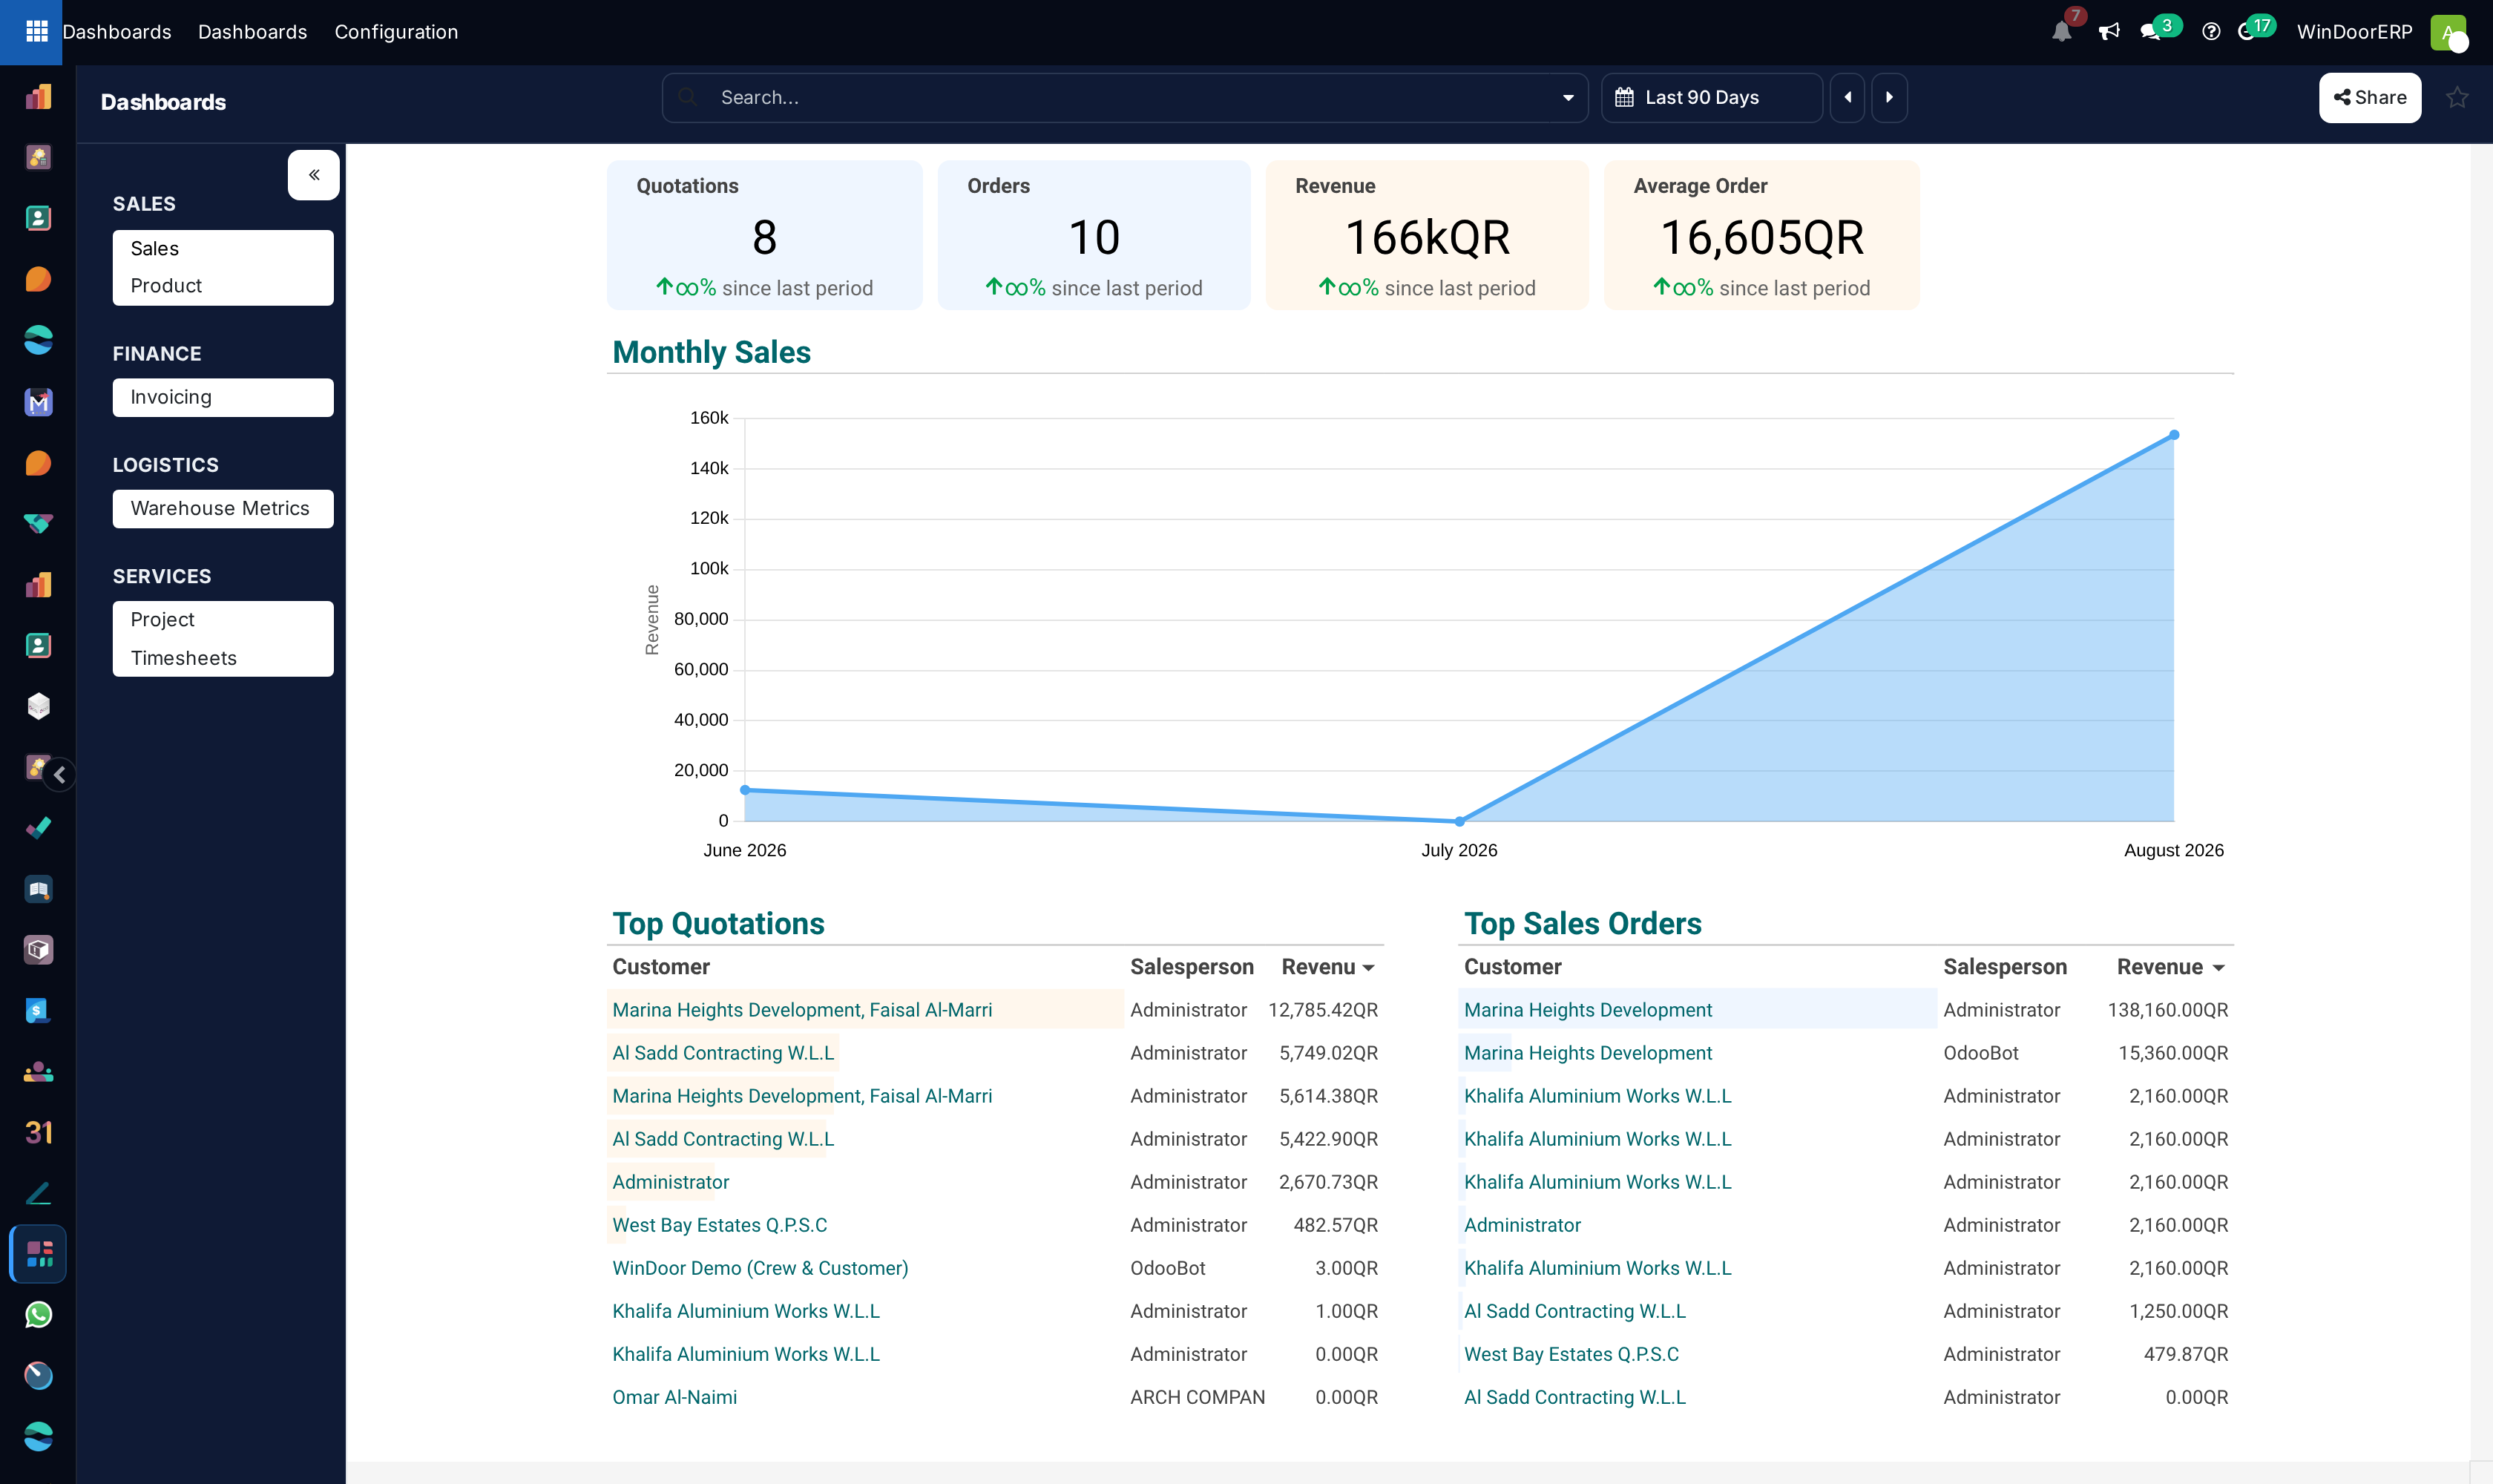
Open Dashboards to access your custom visual command center.
-
02
Interact with real-time pivot tables, charts, and financial formulas synced live with the ERP database.
-
03
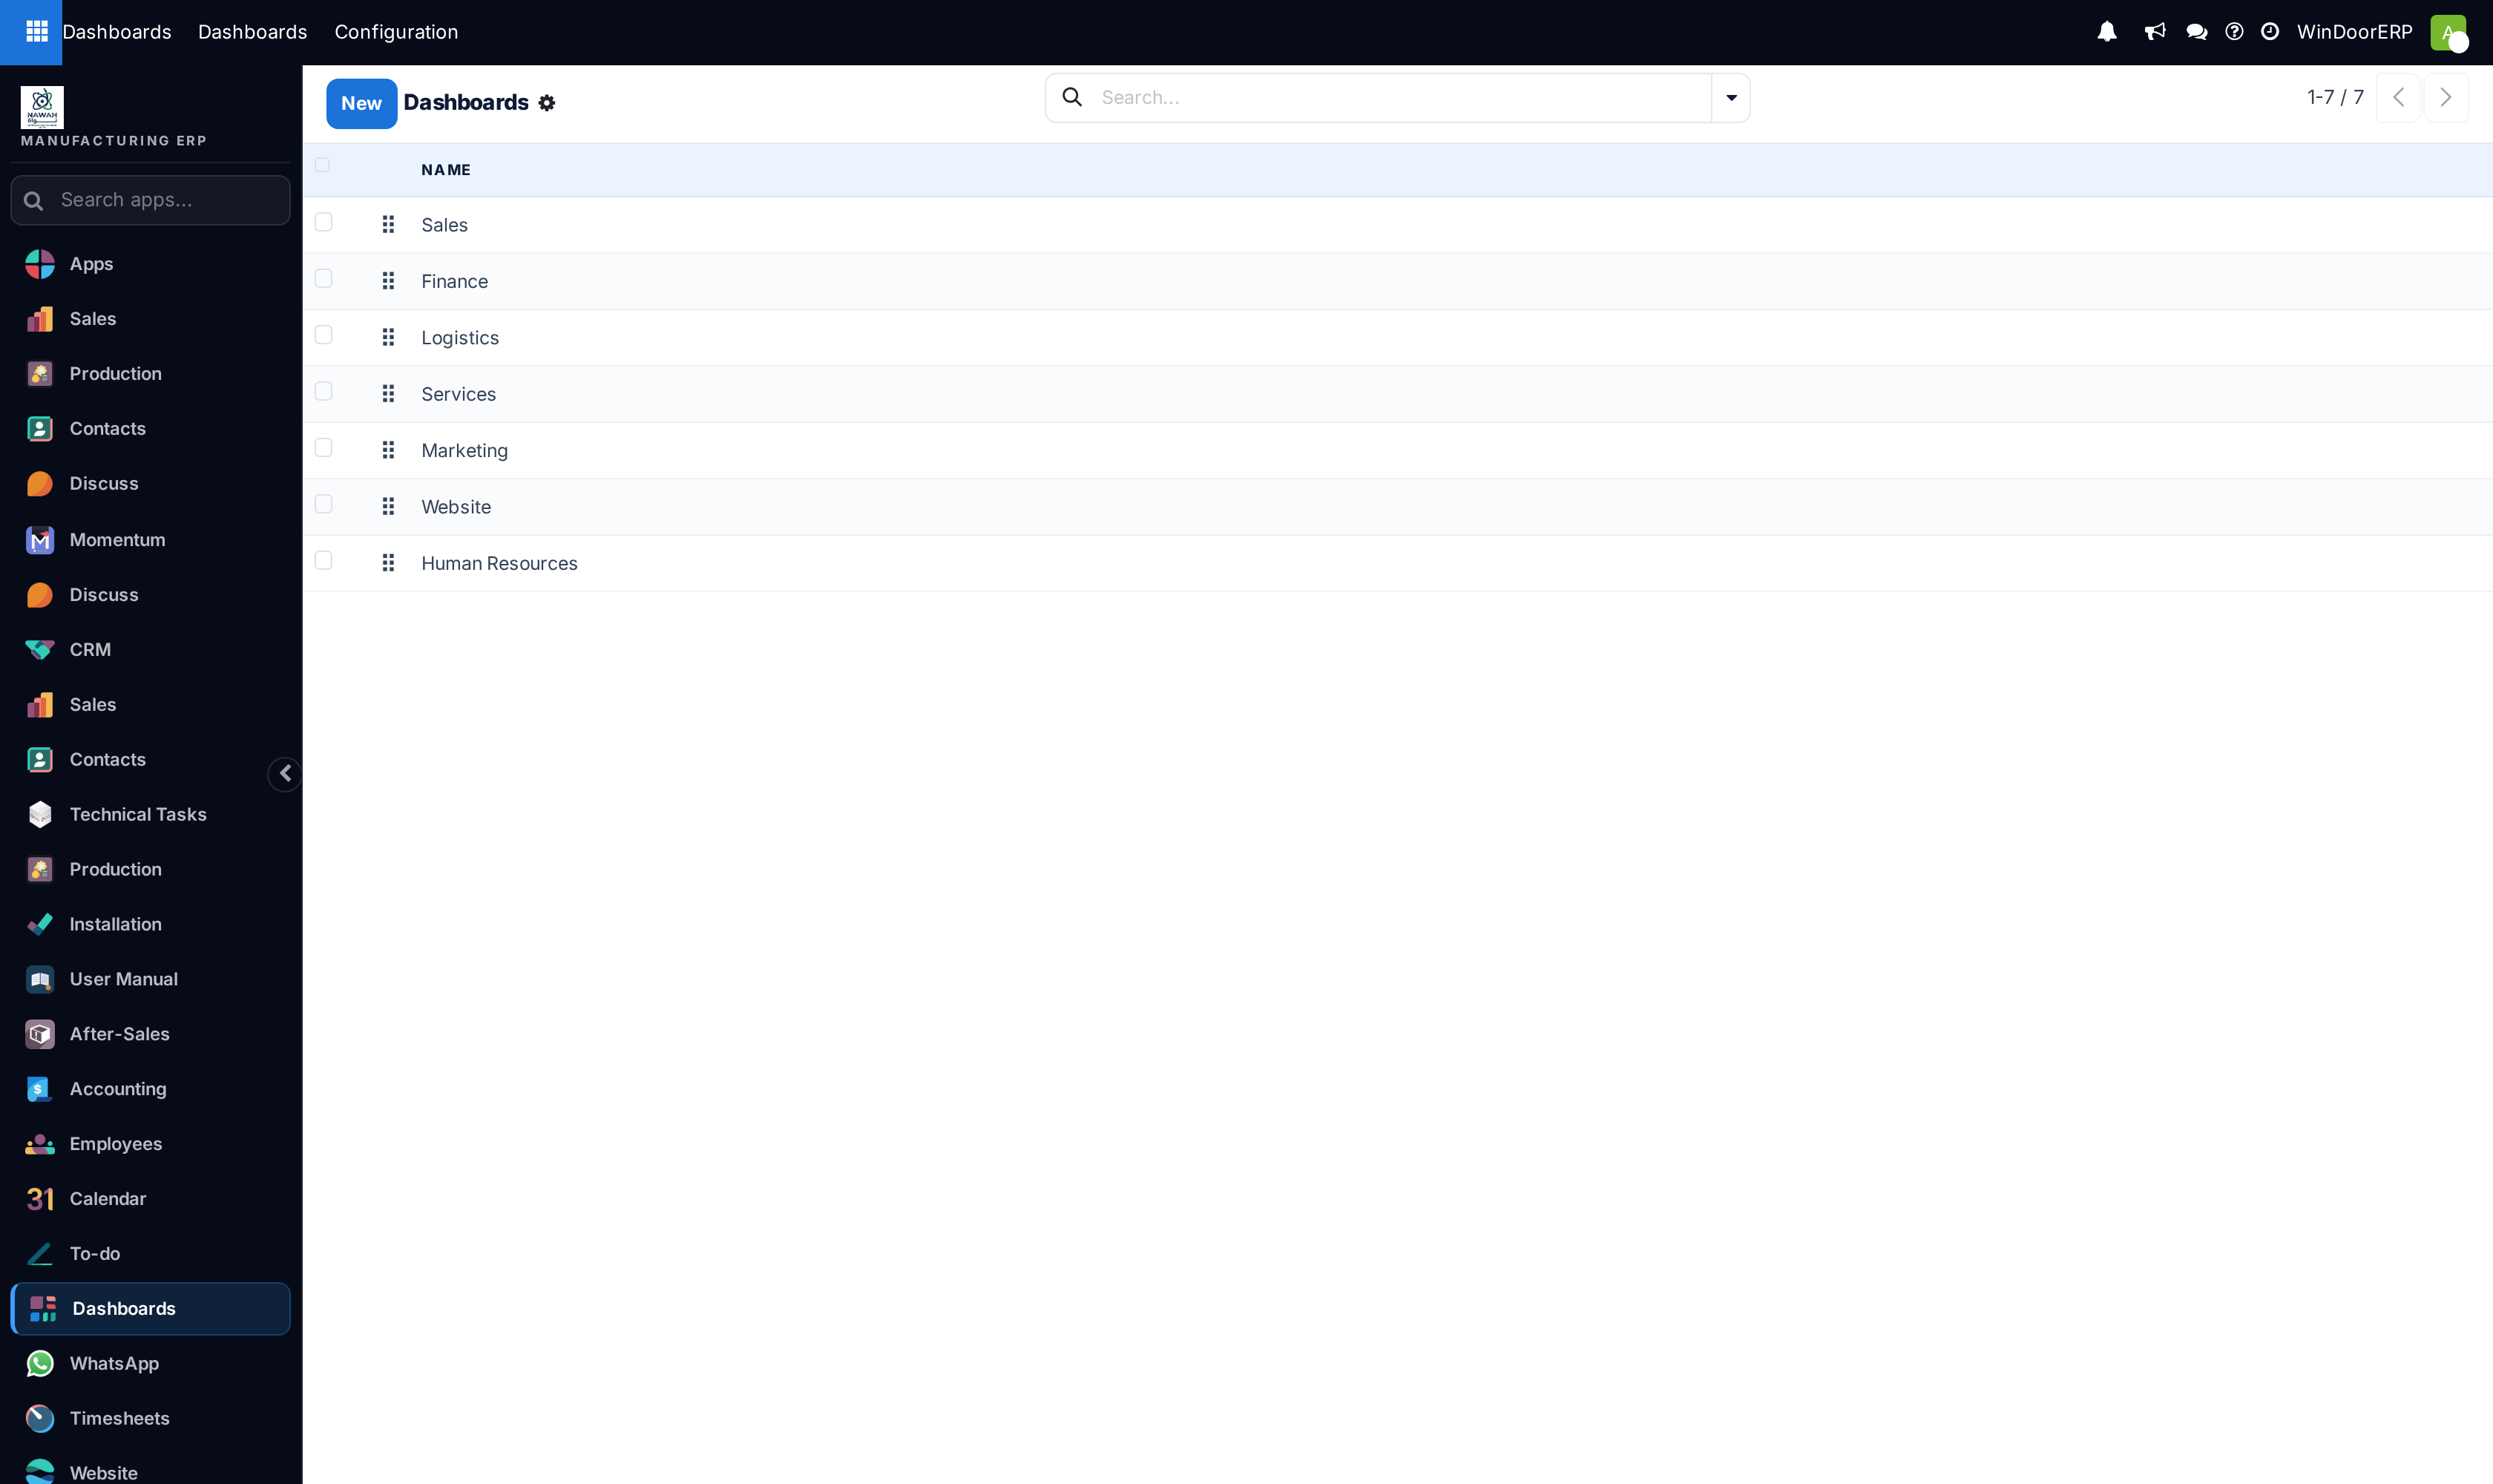
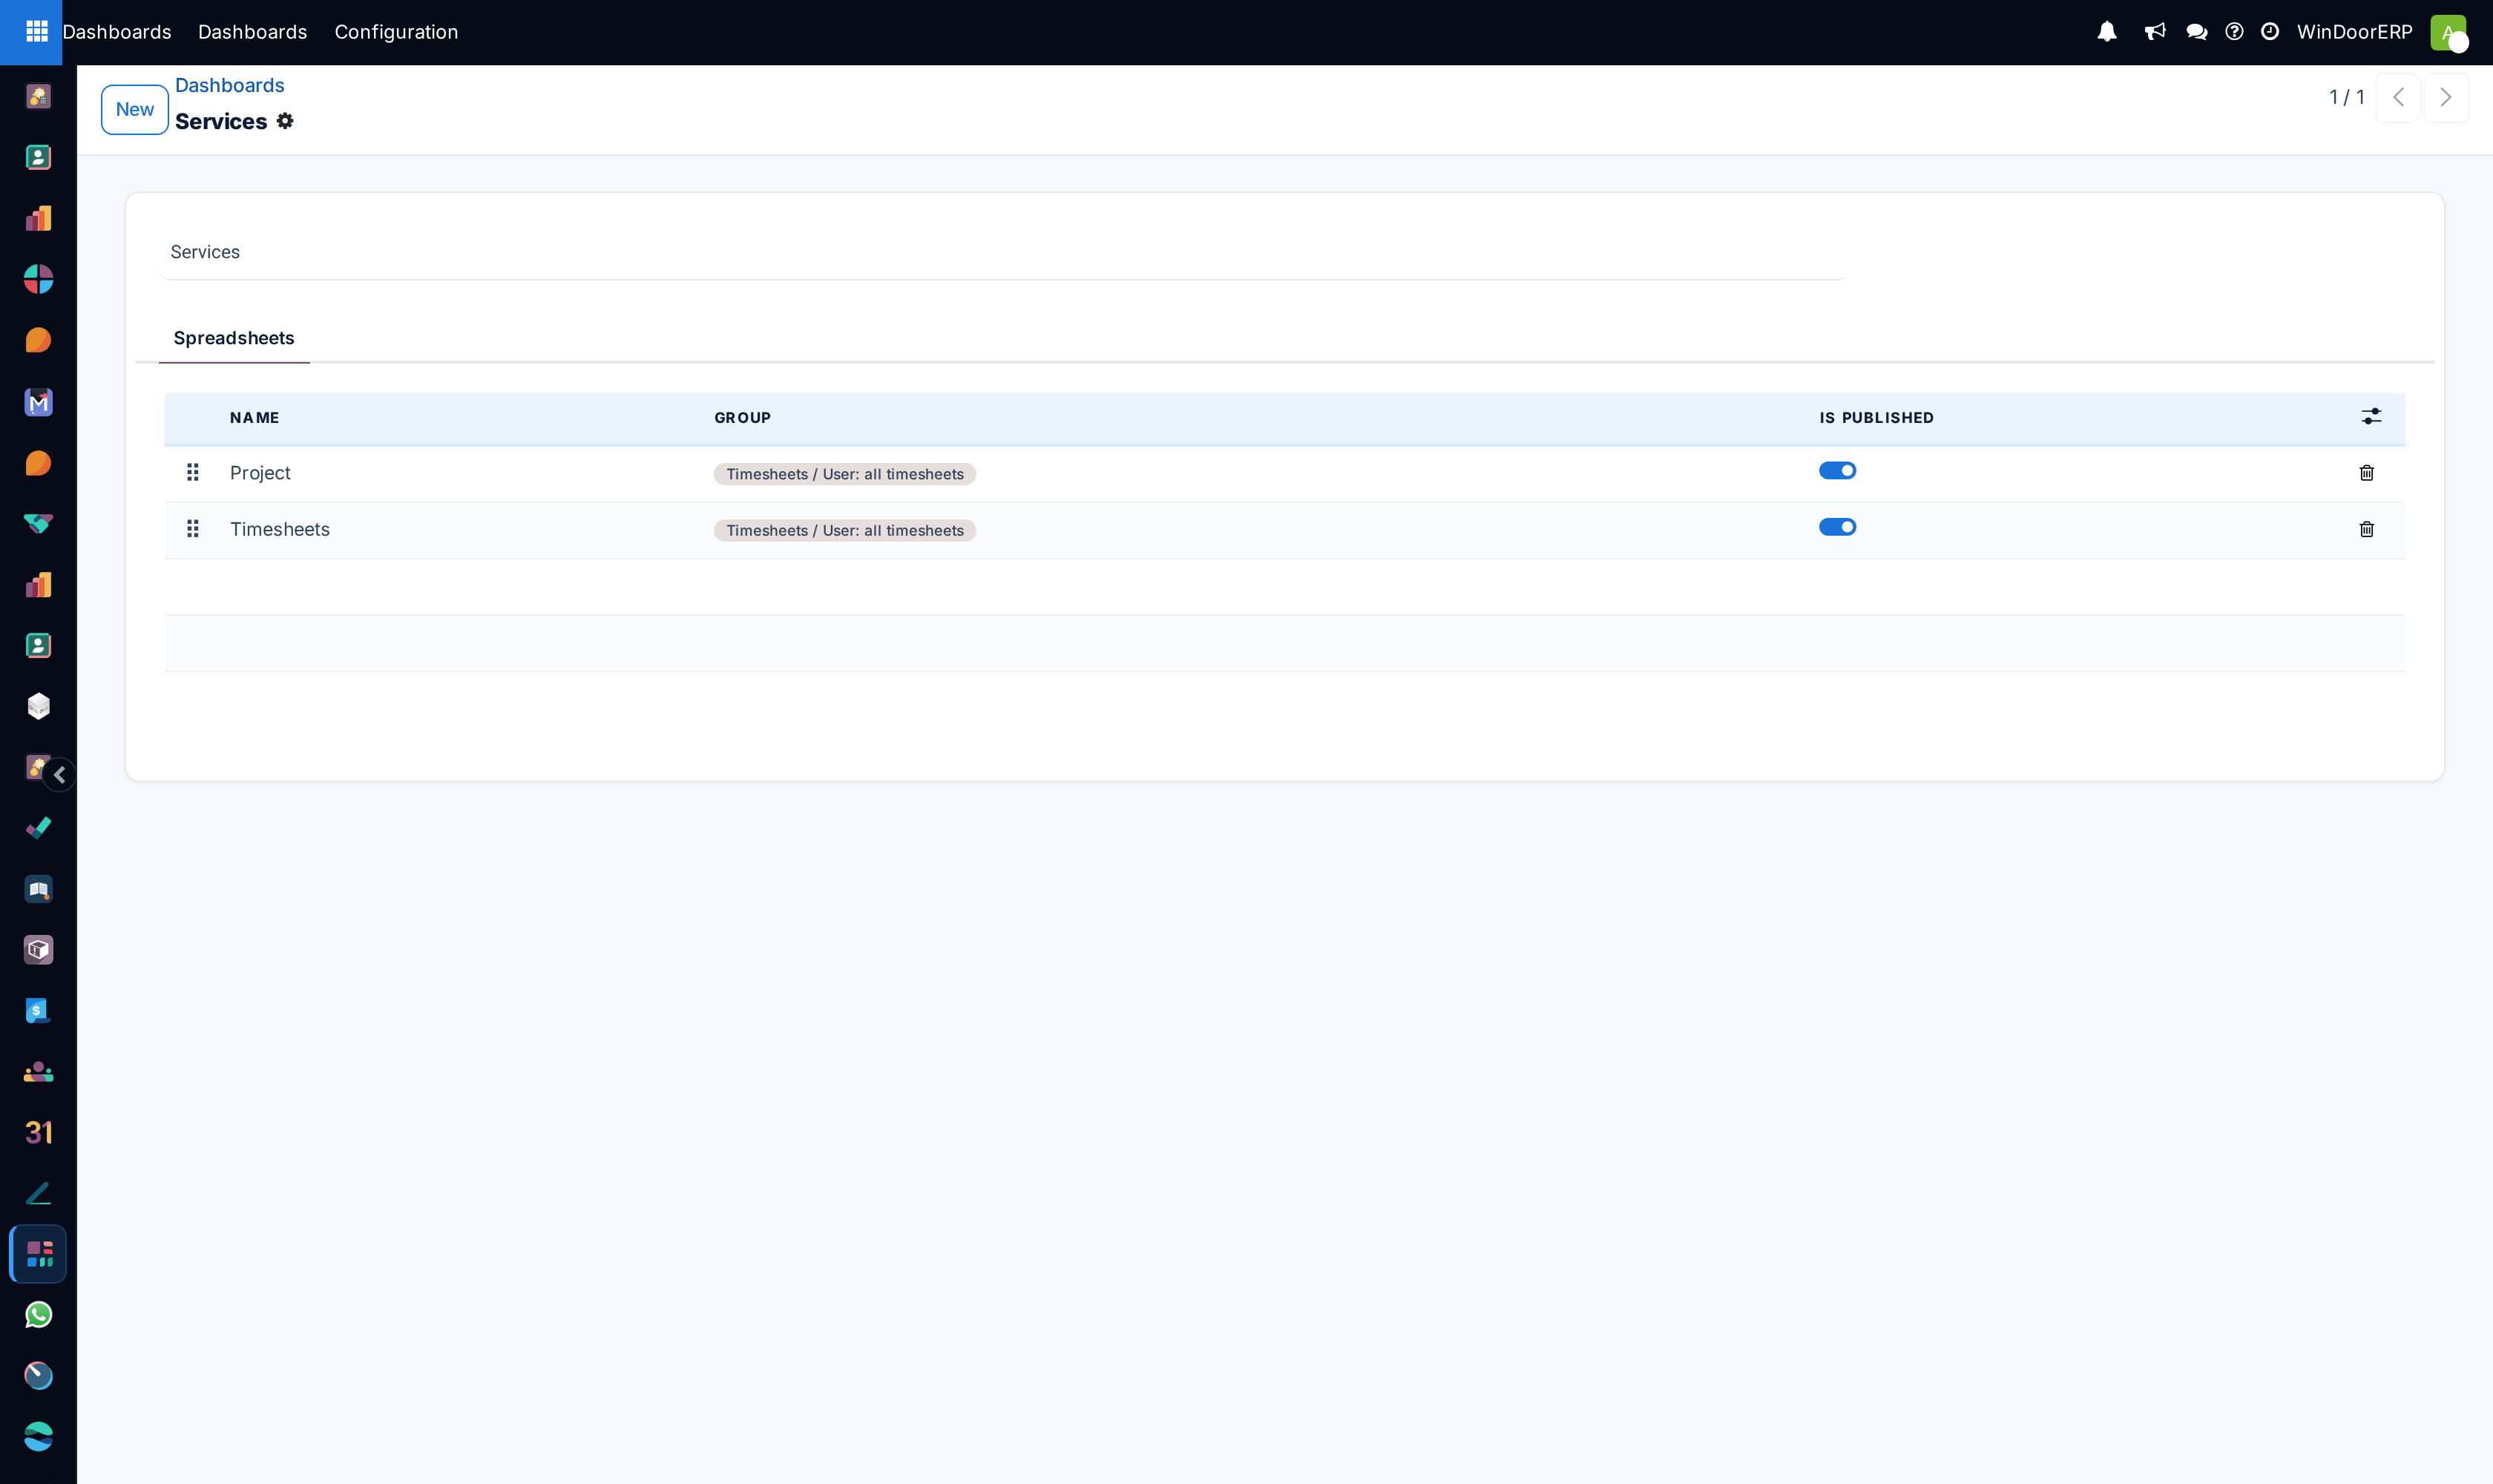
Navigate to Configuration › Dashboards to build new board layouts.
-
04
Embed live filters (e.g. Date Range, Sales Team, Factory Line) to drill down into operational variances.
Common mistakes
- Hardcoding static numbers into dynamic spreadsheet formula cells.
- Sharing sensitive executive financial dashboards with unprivileged department staff.
Was this article helpful?
Thanks — your feedback helps.
Running a window or door factory?
Ask for a demo