Analyze finished window unit output, daily completion velocity, and monthly volume
What this does
Delivers executive reporting on daily, weekly, and monthly fabricated window and door volumes, segmented by system series, profile color, and product category.
Before you start
- Access to Production Reporting menus.
Steps
Important
Measuring total output in both Unit Counts and Total Square Meters (m²) provides a balanced view of factory capacity utilization.
-
01
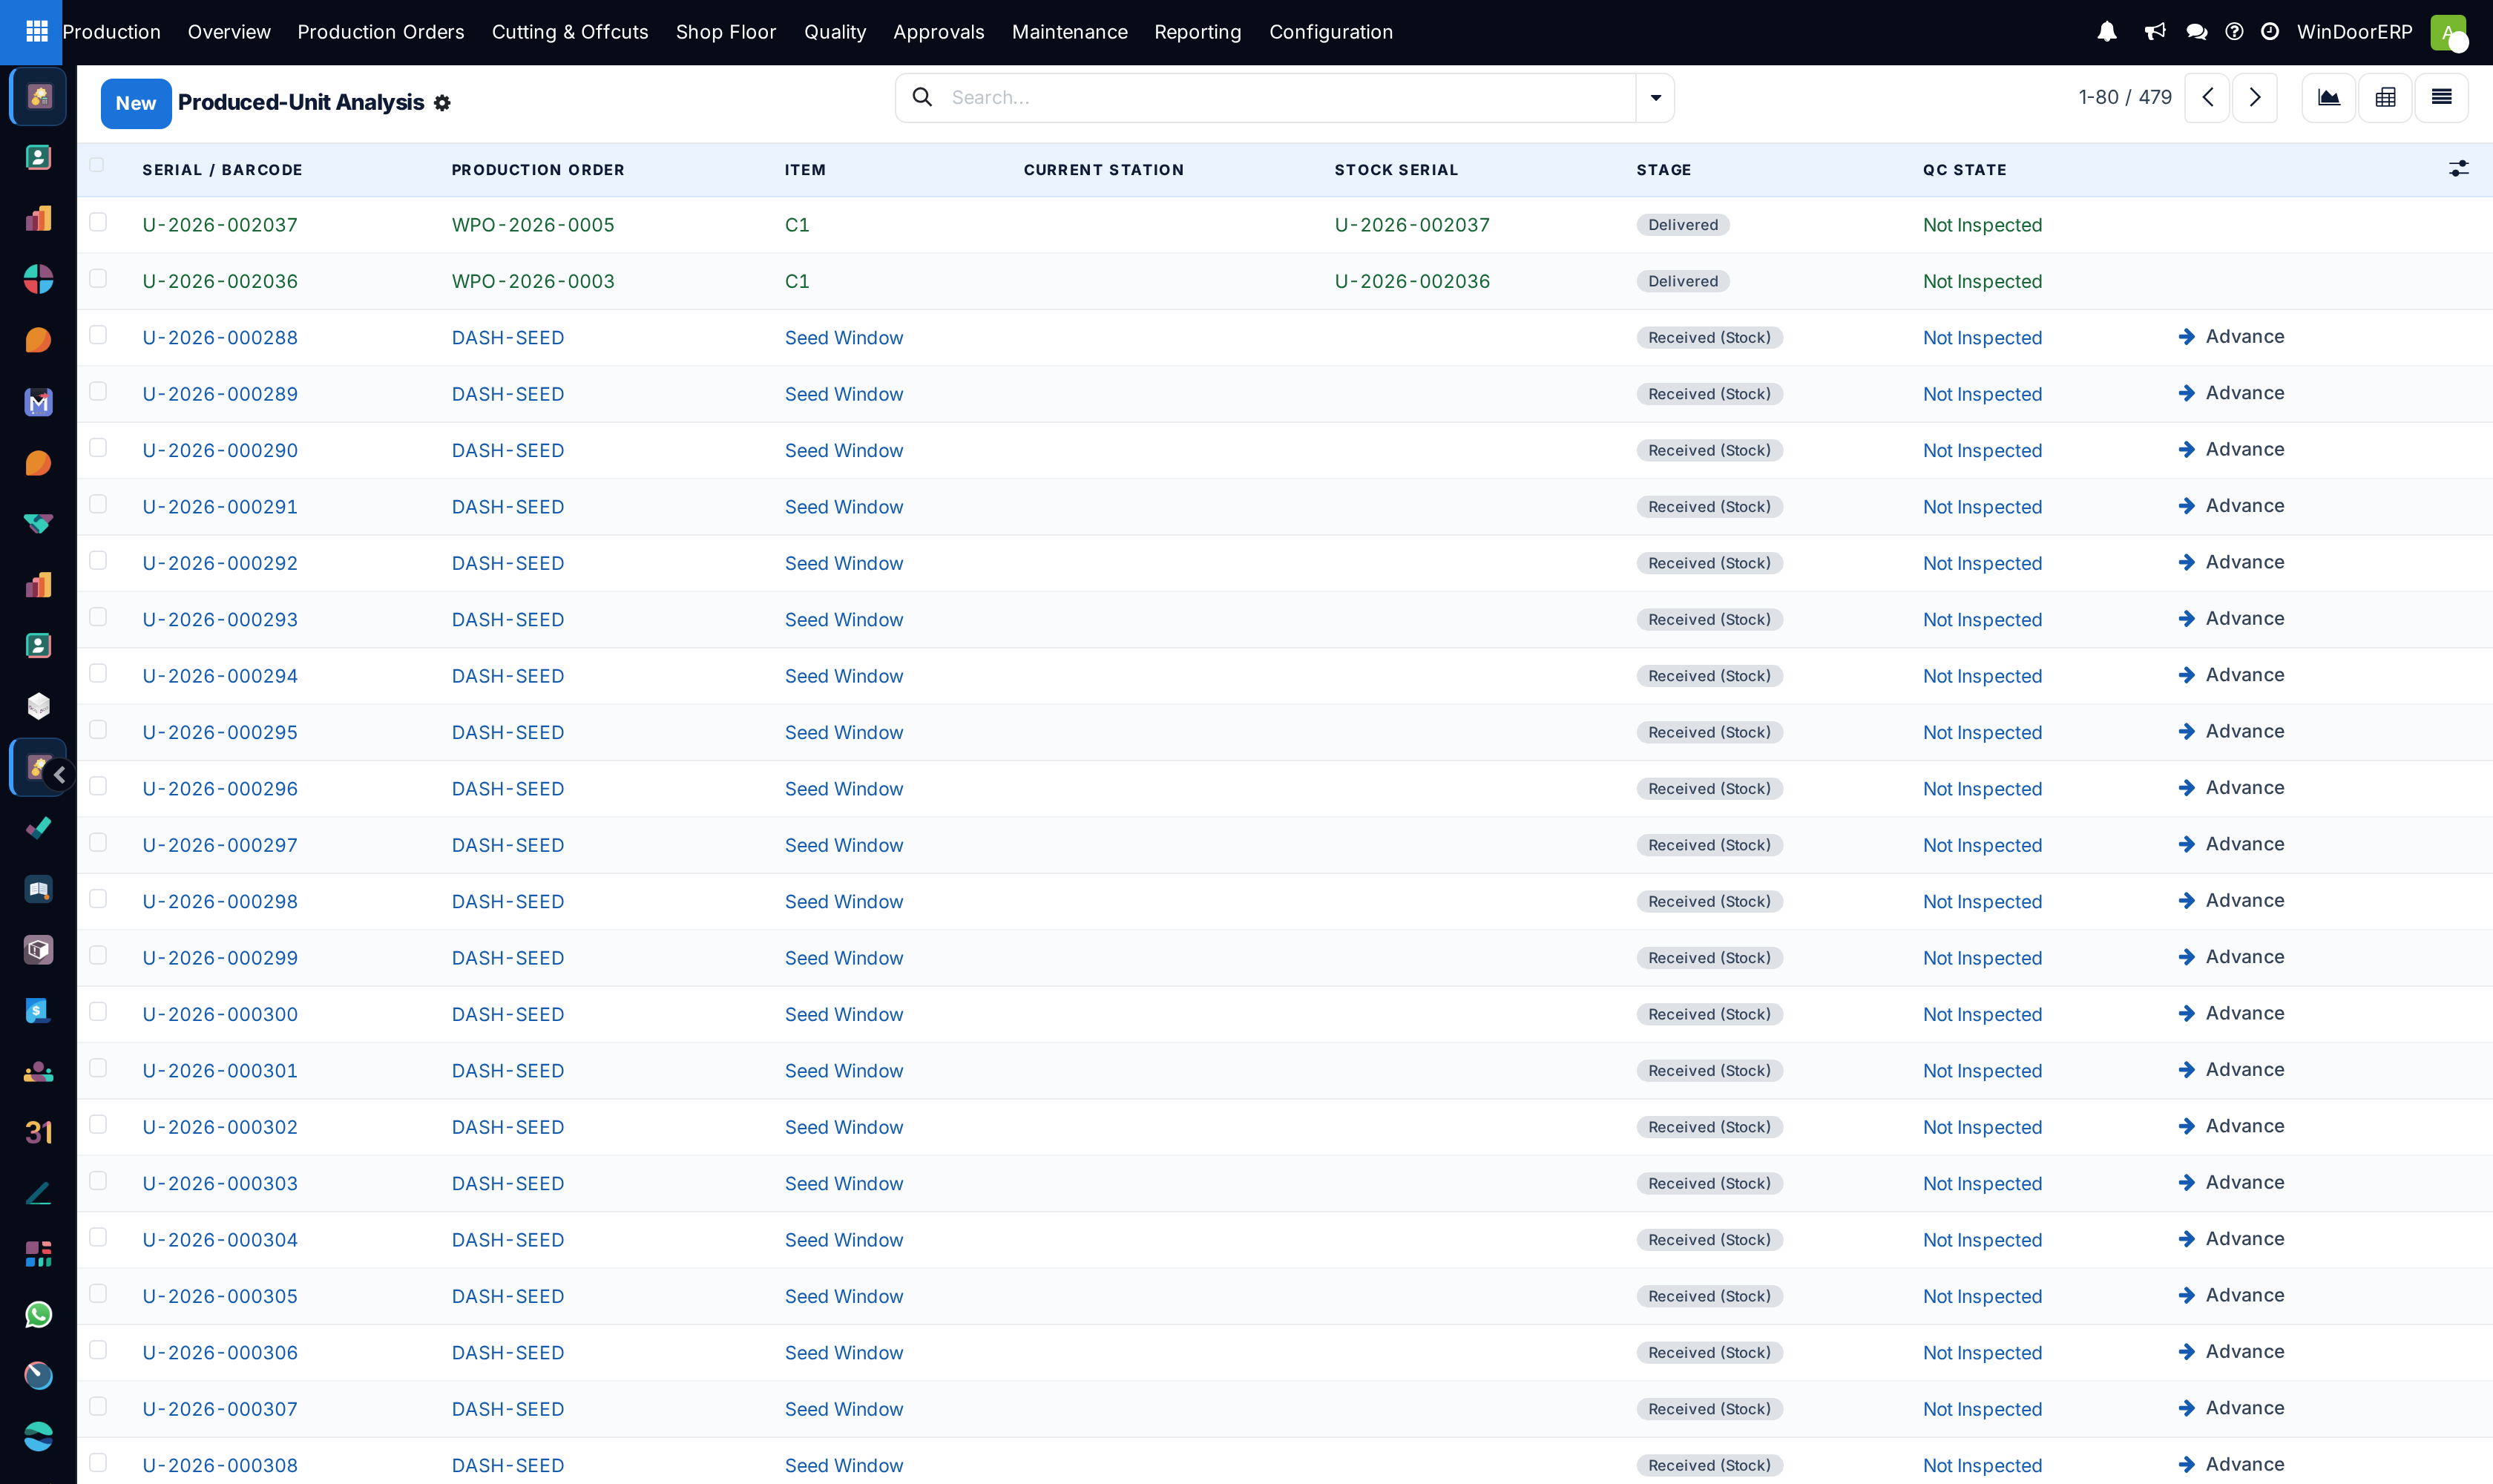
Open Production › Reporting › Produced Units.
-
02
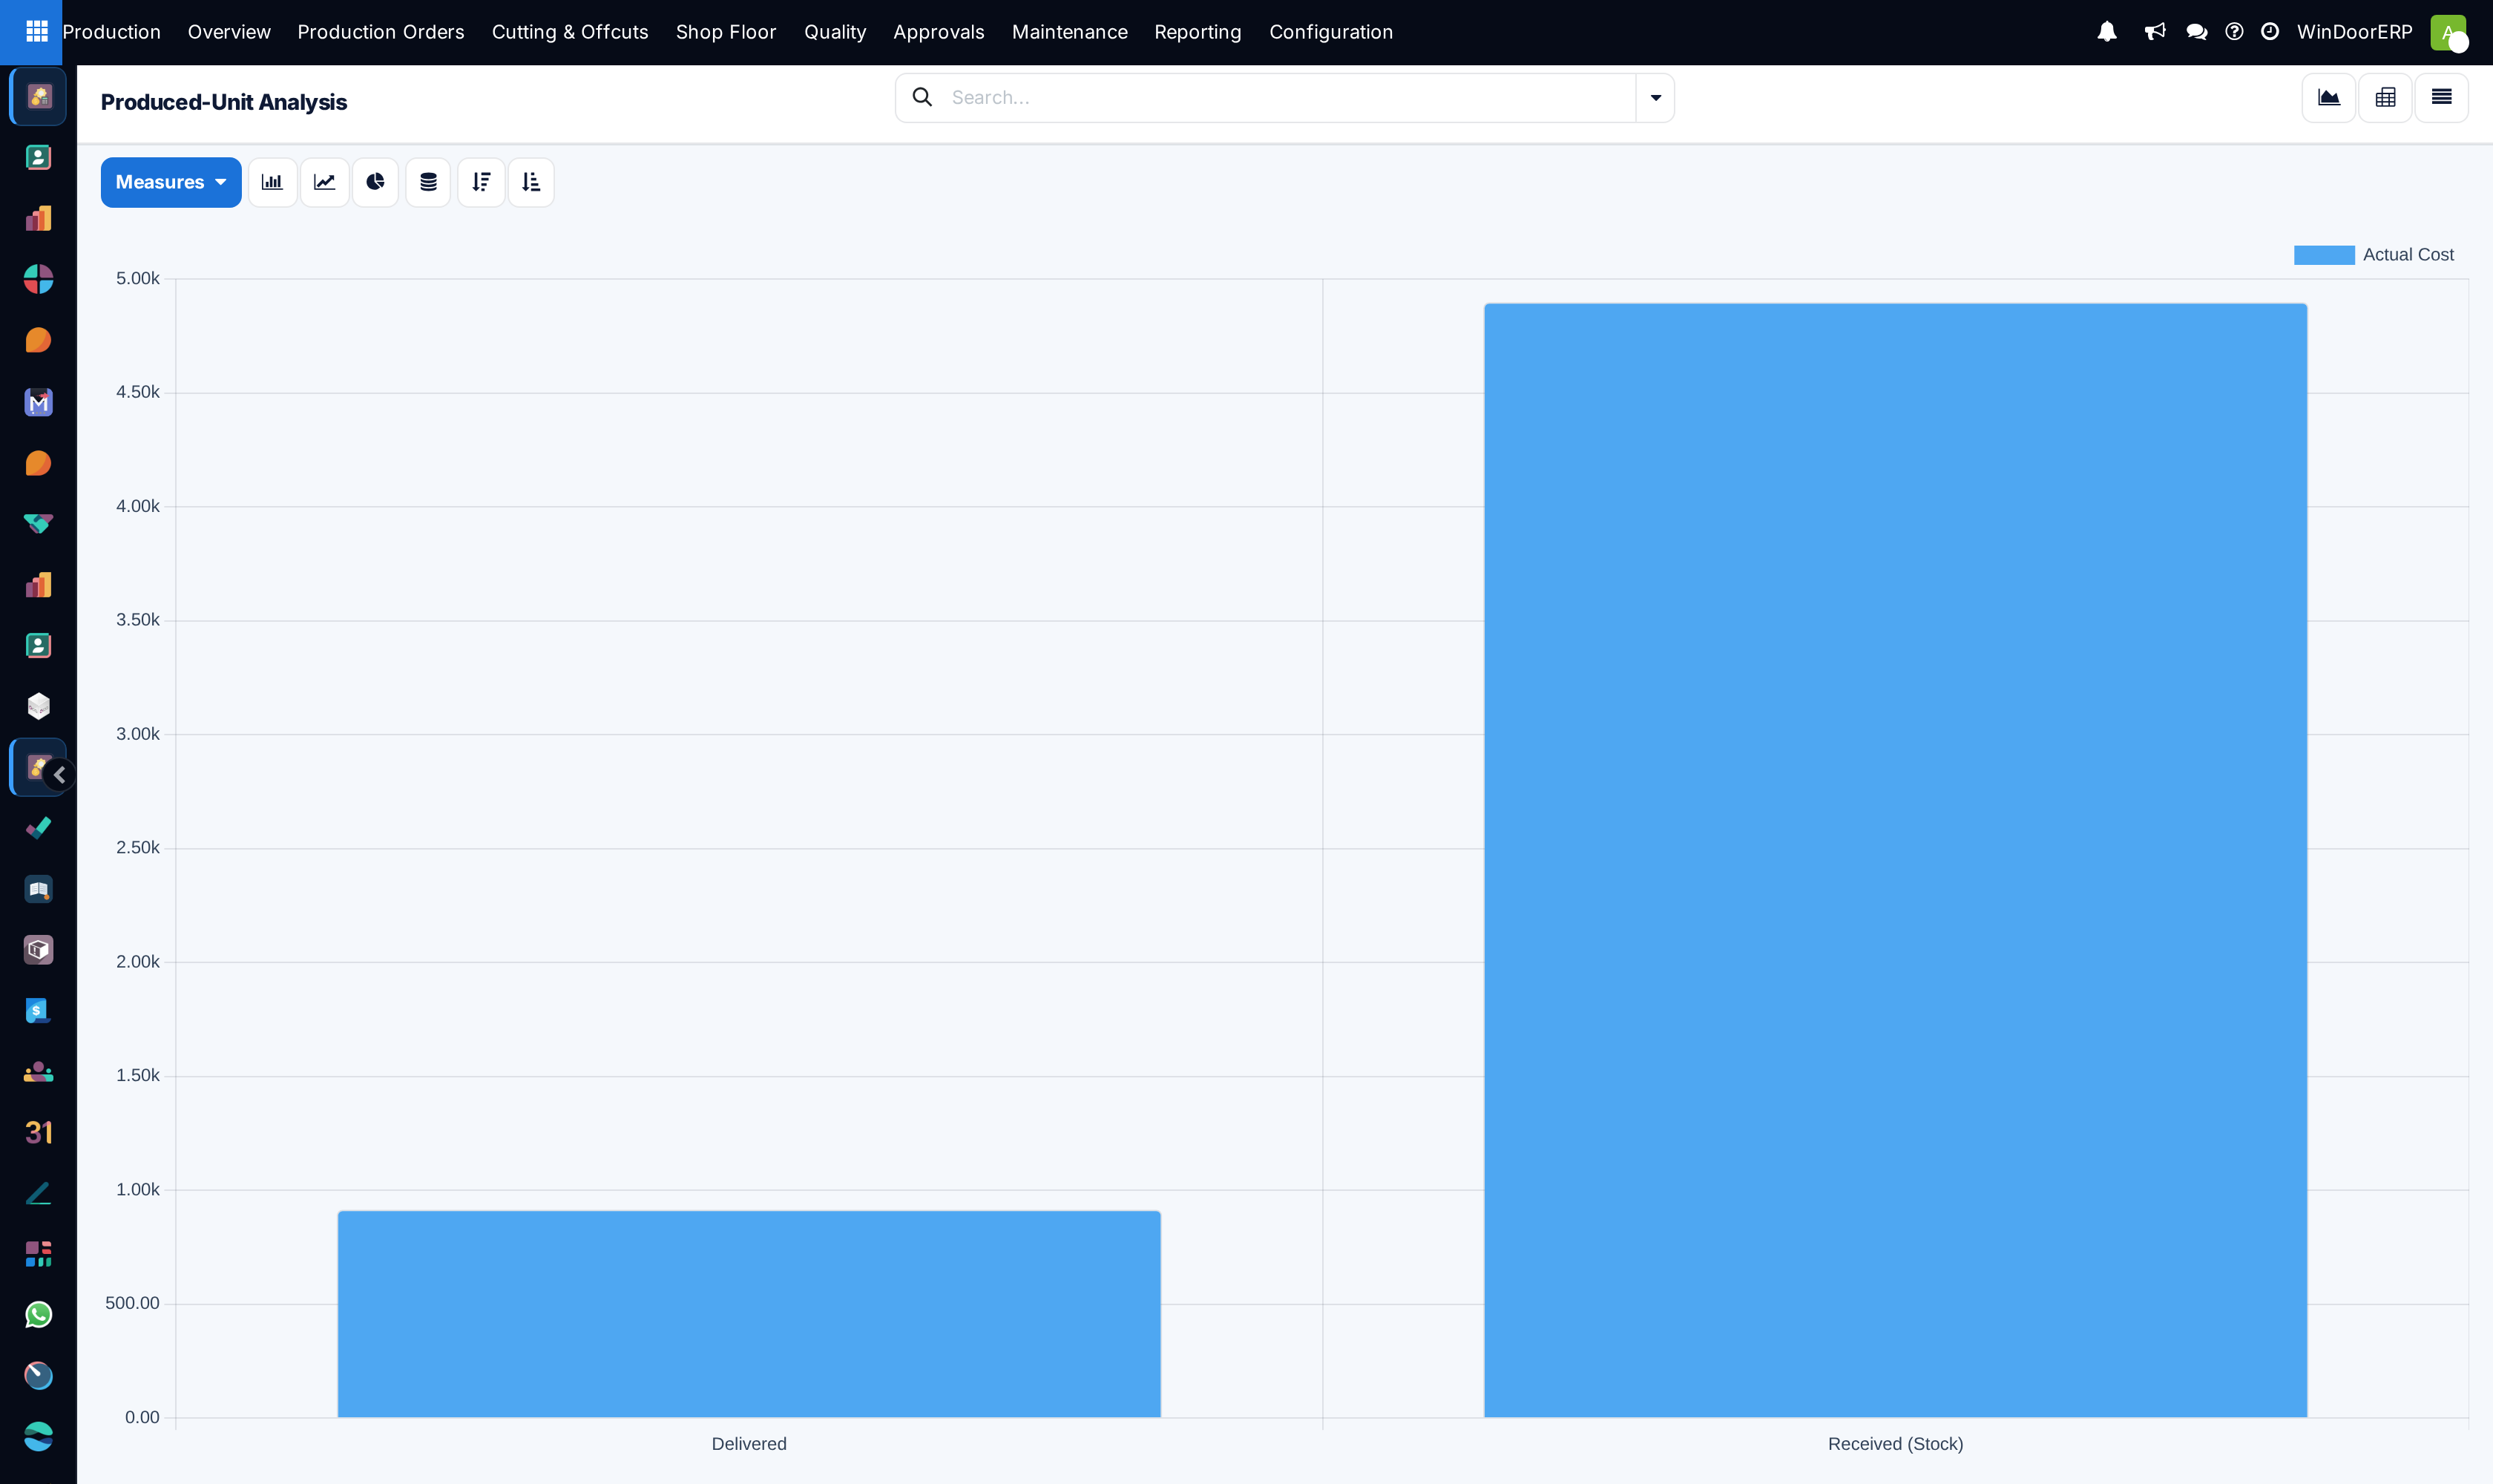
Inspect the default bar chart displaying completed unit counts grouped by month and product category.
-
03
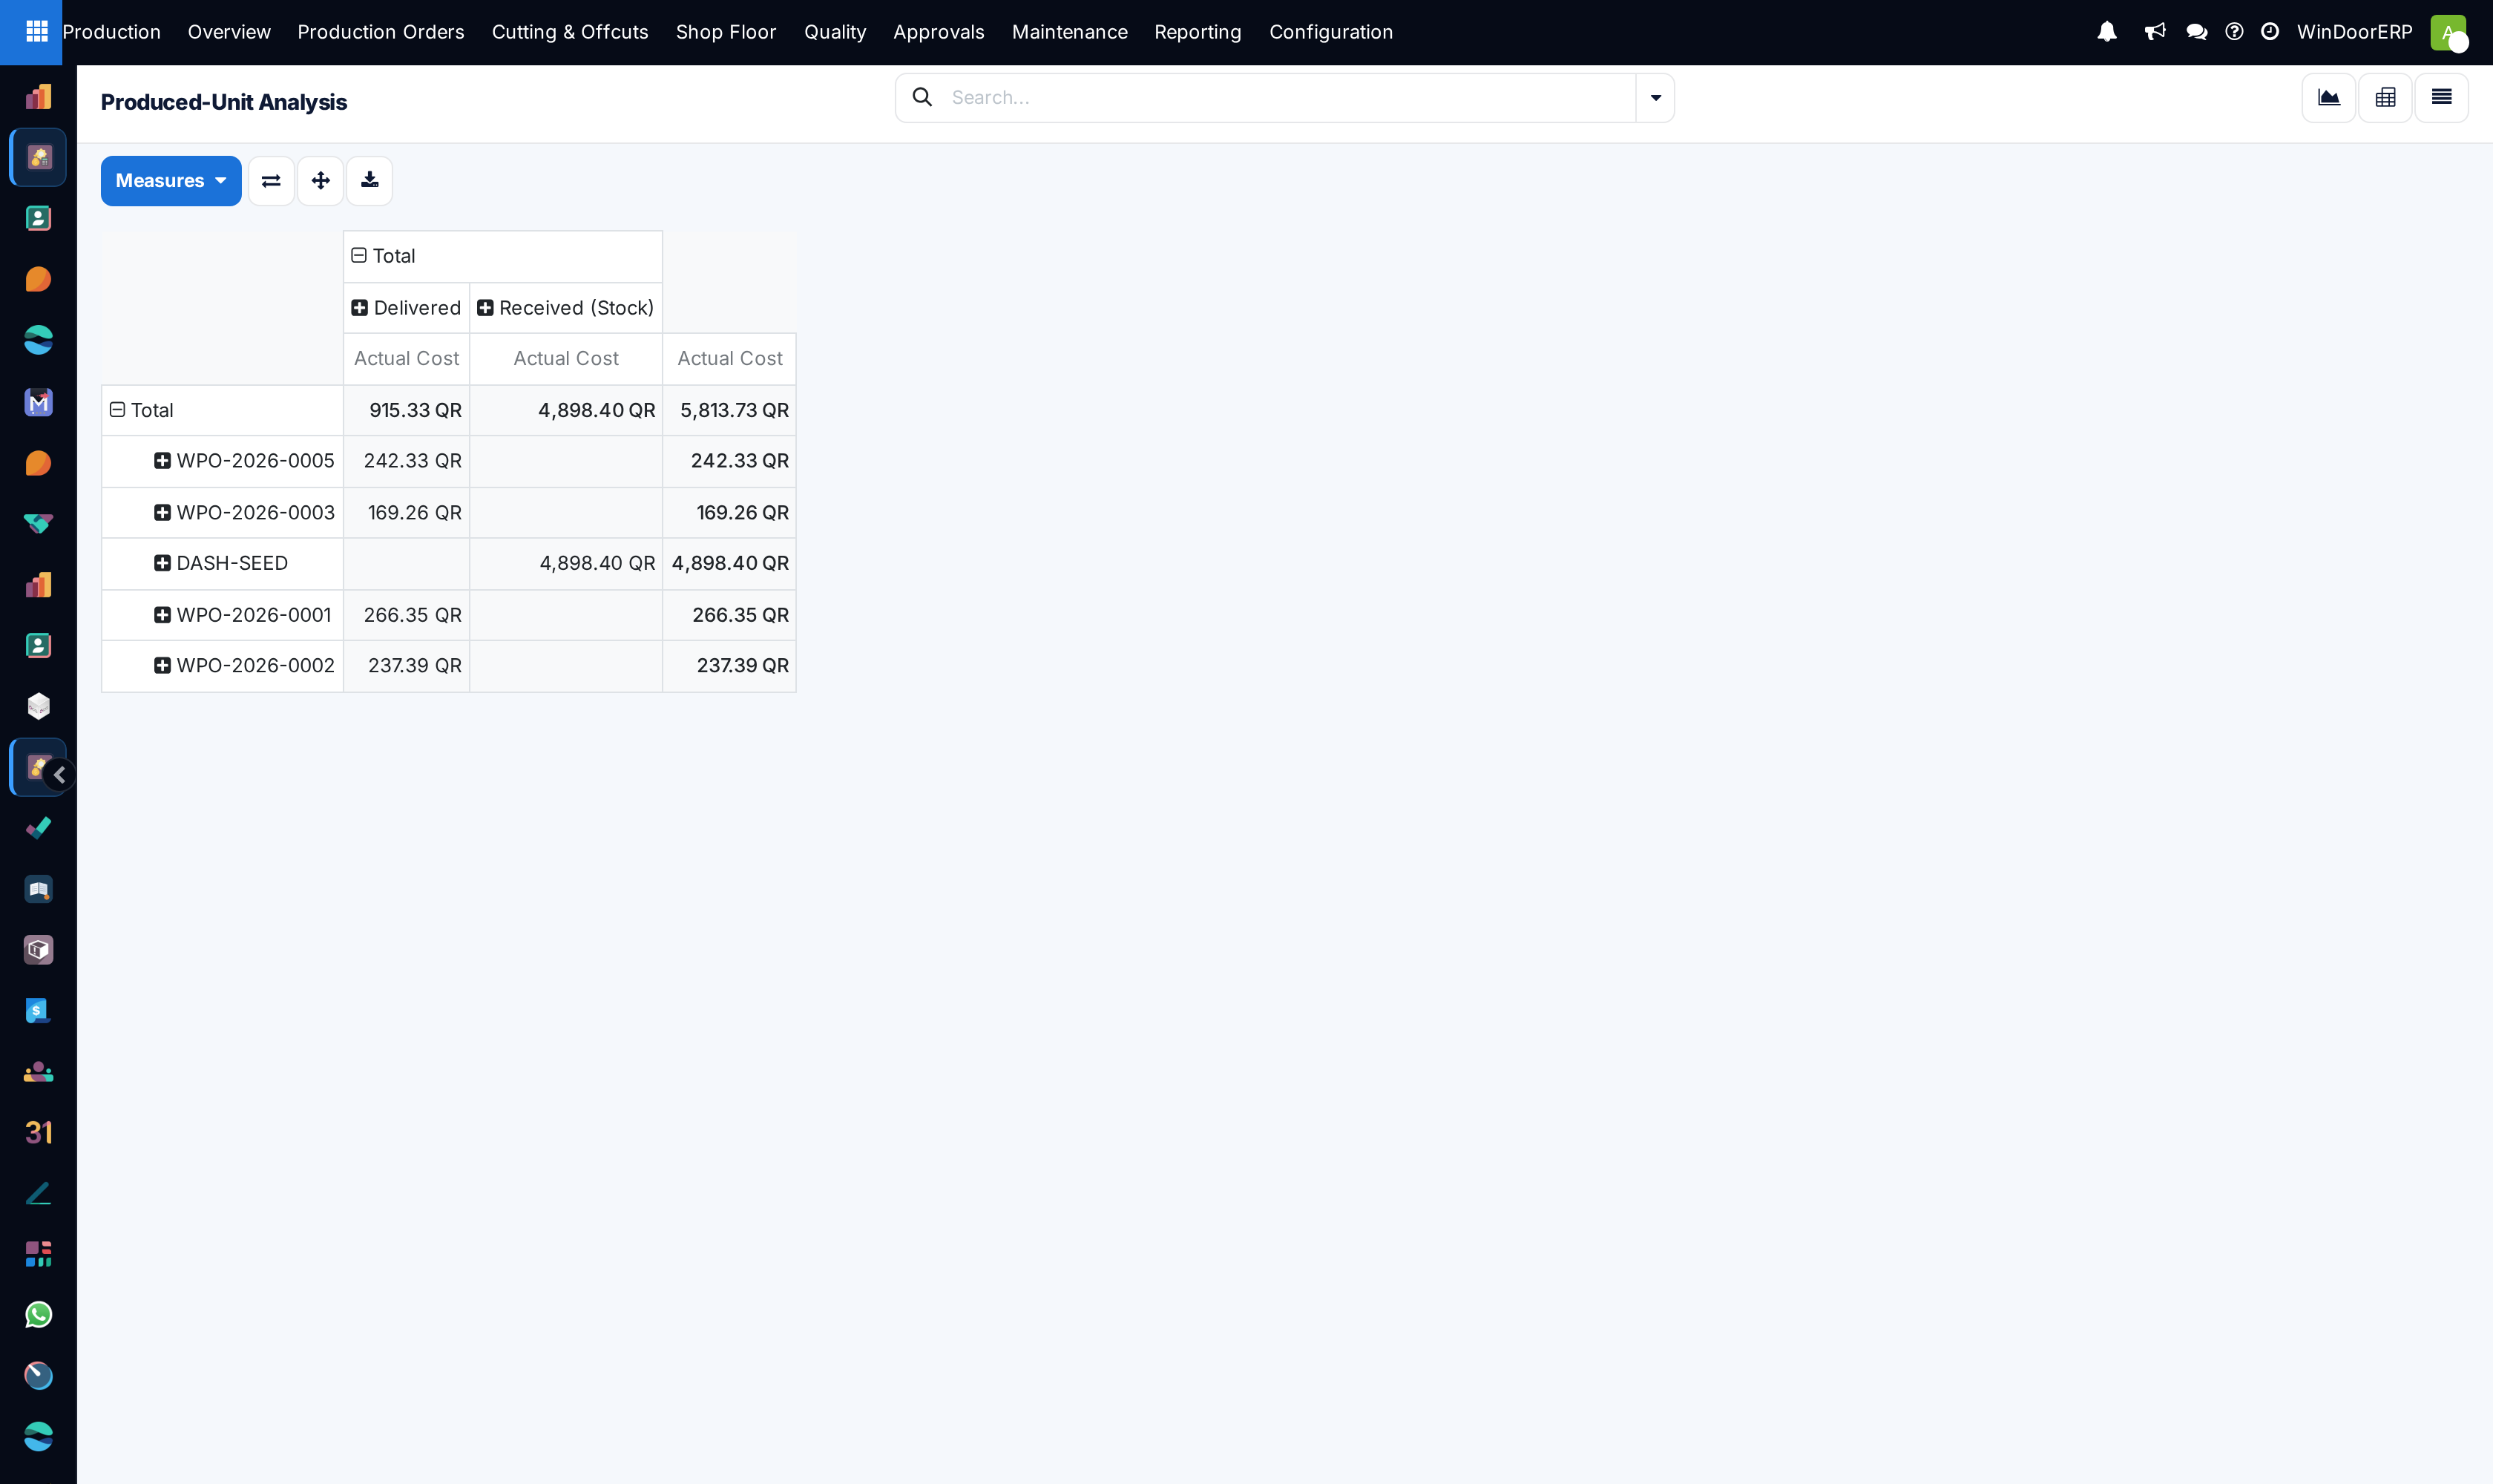
Switch to the Pivot view to cross-tabulate square meters produced by project and sales team.
-
04
Filter by Fabricated Product Template to discover your factory's highest-volume window systems.
Common mistakes
- Evaluating factory capacity solely on unit count without factoring in structural curtain wall complexity.
- Failing to filter out cancelled or scrapped test prototypes from monthly production volume reports.
Was this article helpful?
Thanks — your feedback helps.
Running a window or door factory?
Ask for a demo