Analyze expected revenue, stage probabilities, and prorated manufacturing pipeline
What this does
Evaluates pipeline financial value by calculating Expected Revenue and Prorated Revenue (Expected Revenue × Probability %), enabling executive management to forecast cash flow and raw material procurement.
Before you start
- Sales Manager or Financial Analyst privileges.
Steps
Important
Prorated Revenue automatically adjusts as opportunities move into higher-probability stages (e.g. 20% in Qualification -> 80% in Contract Negotiation).
-
01
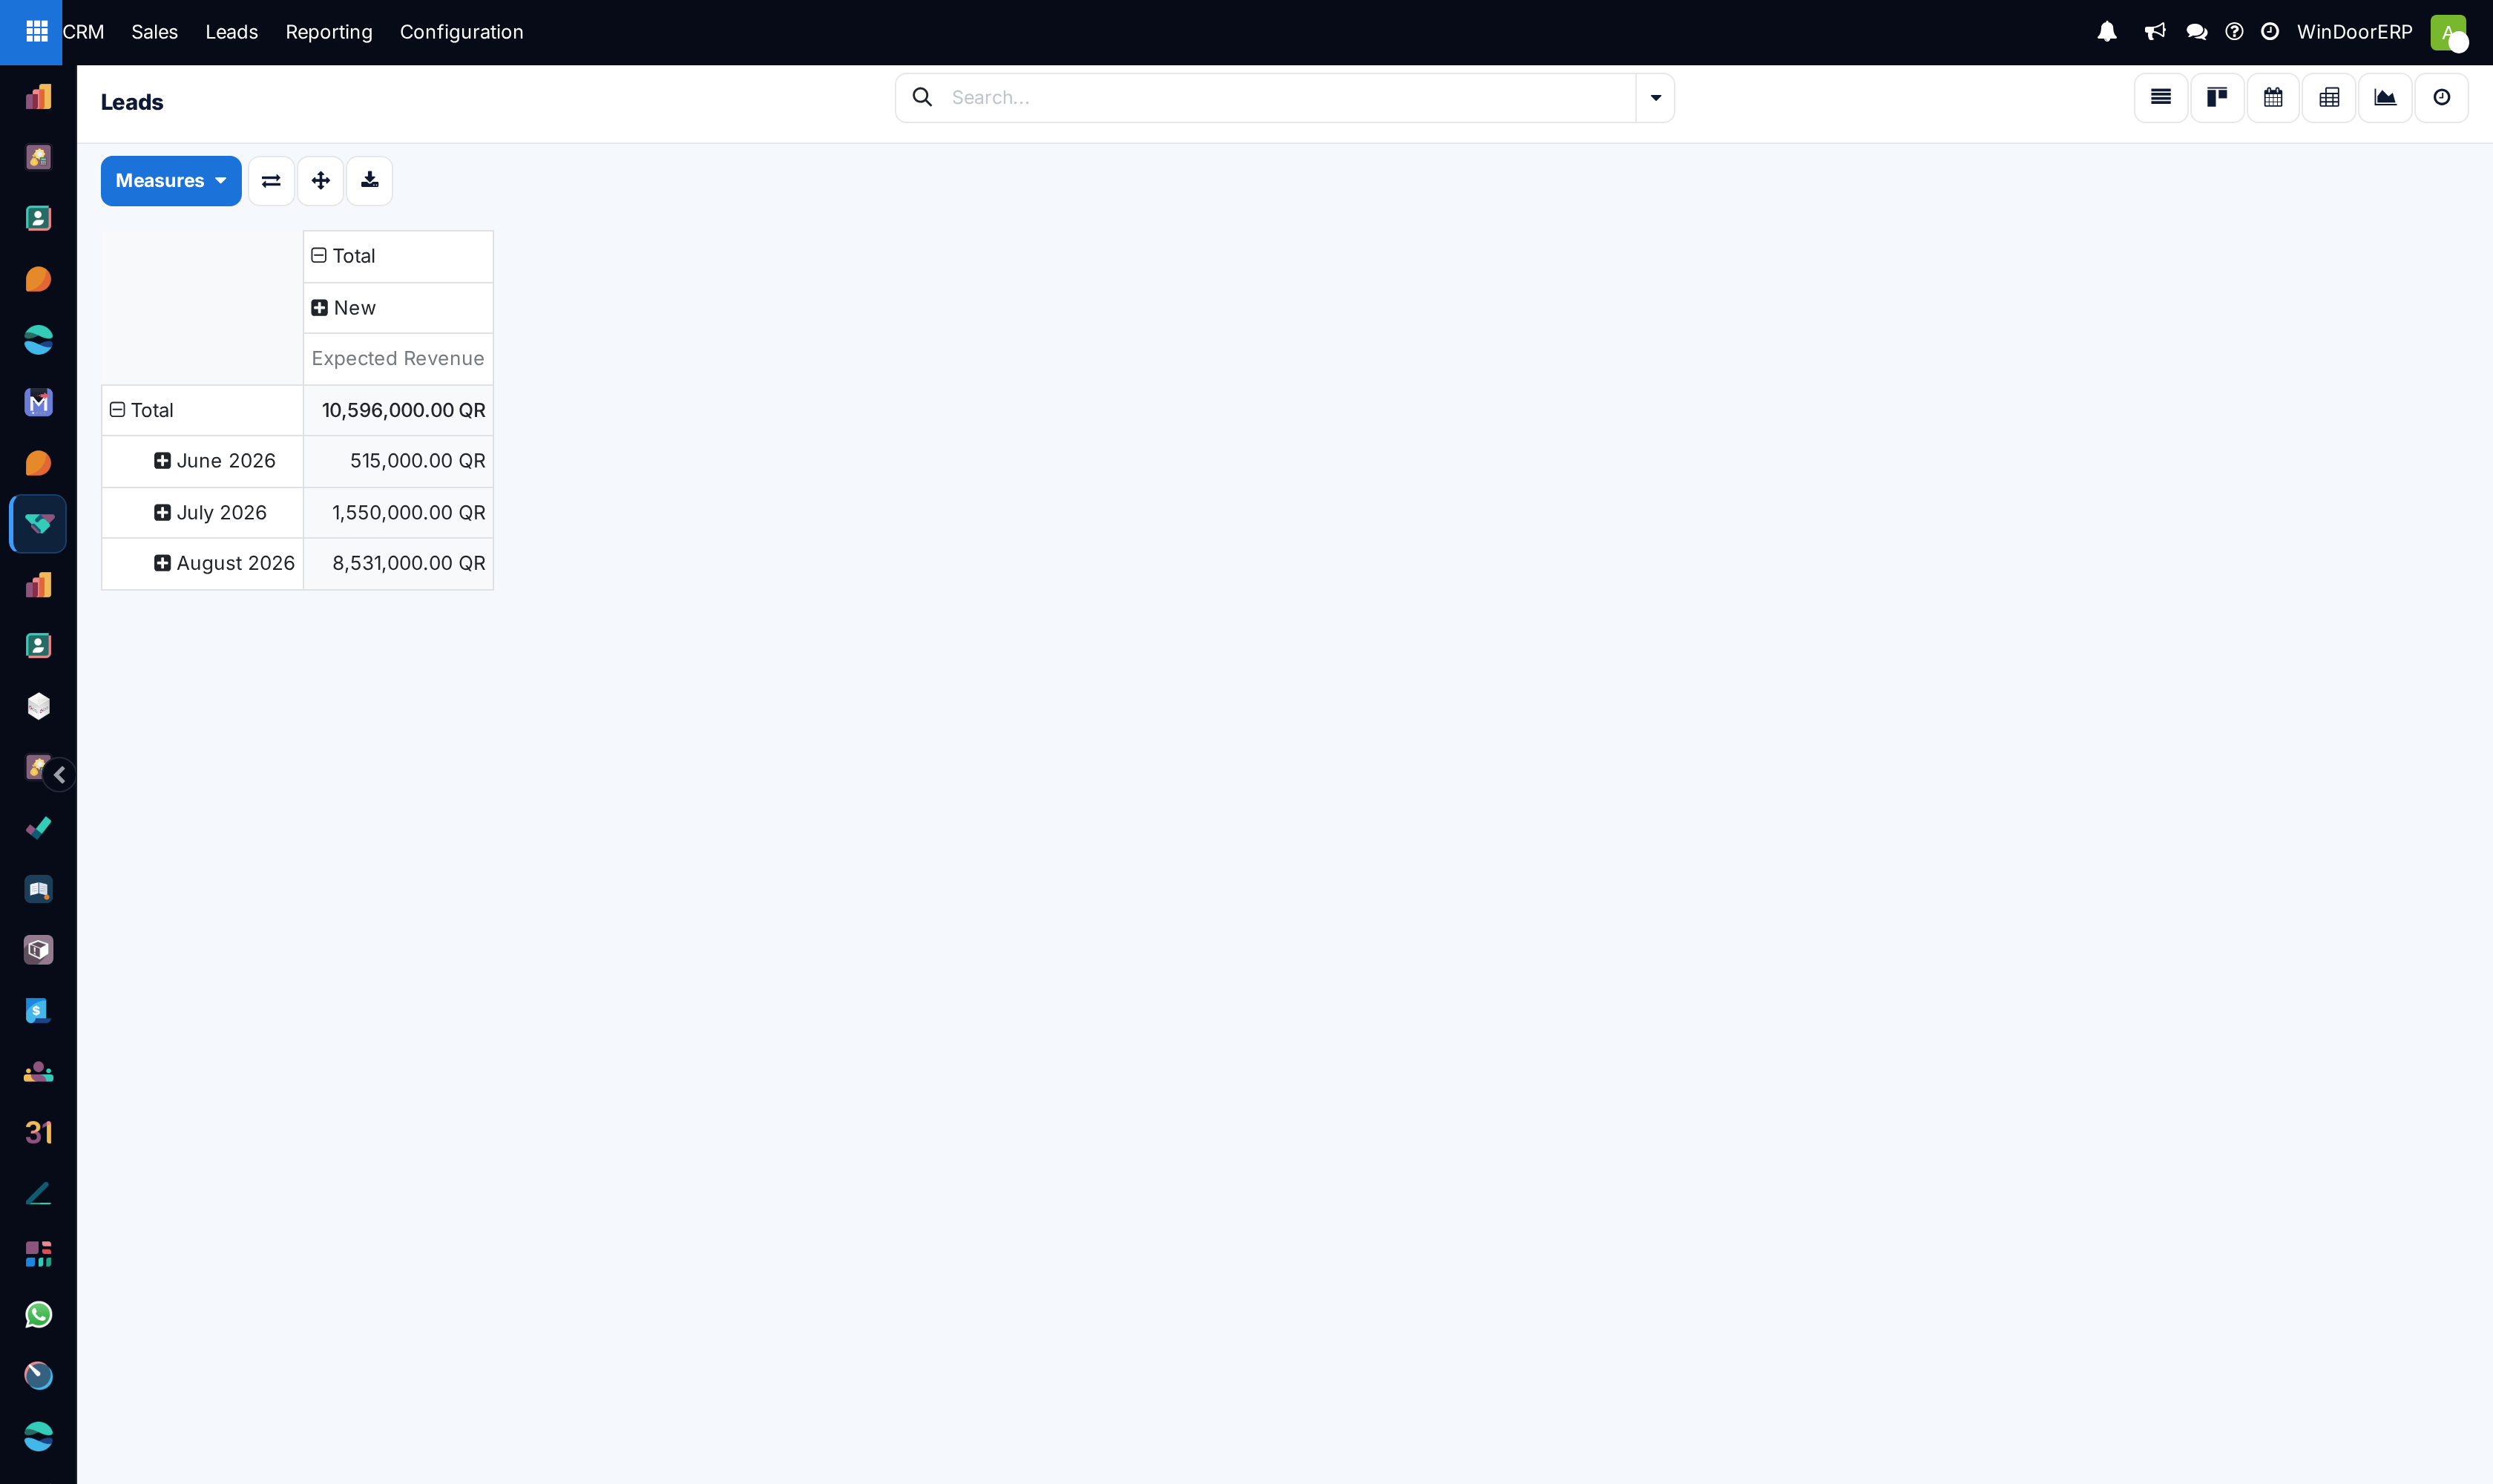
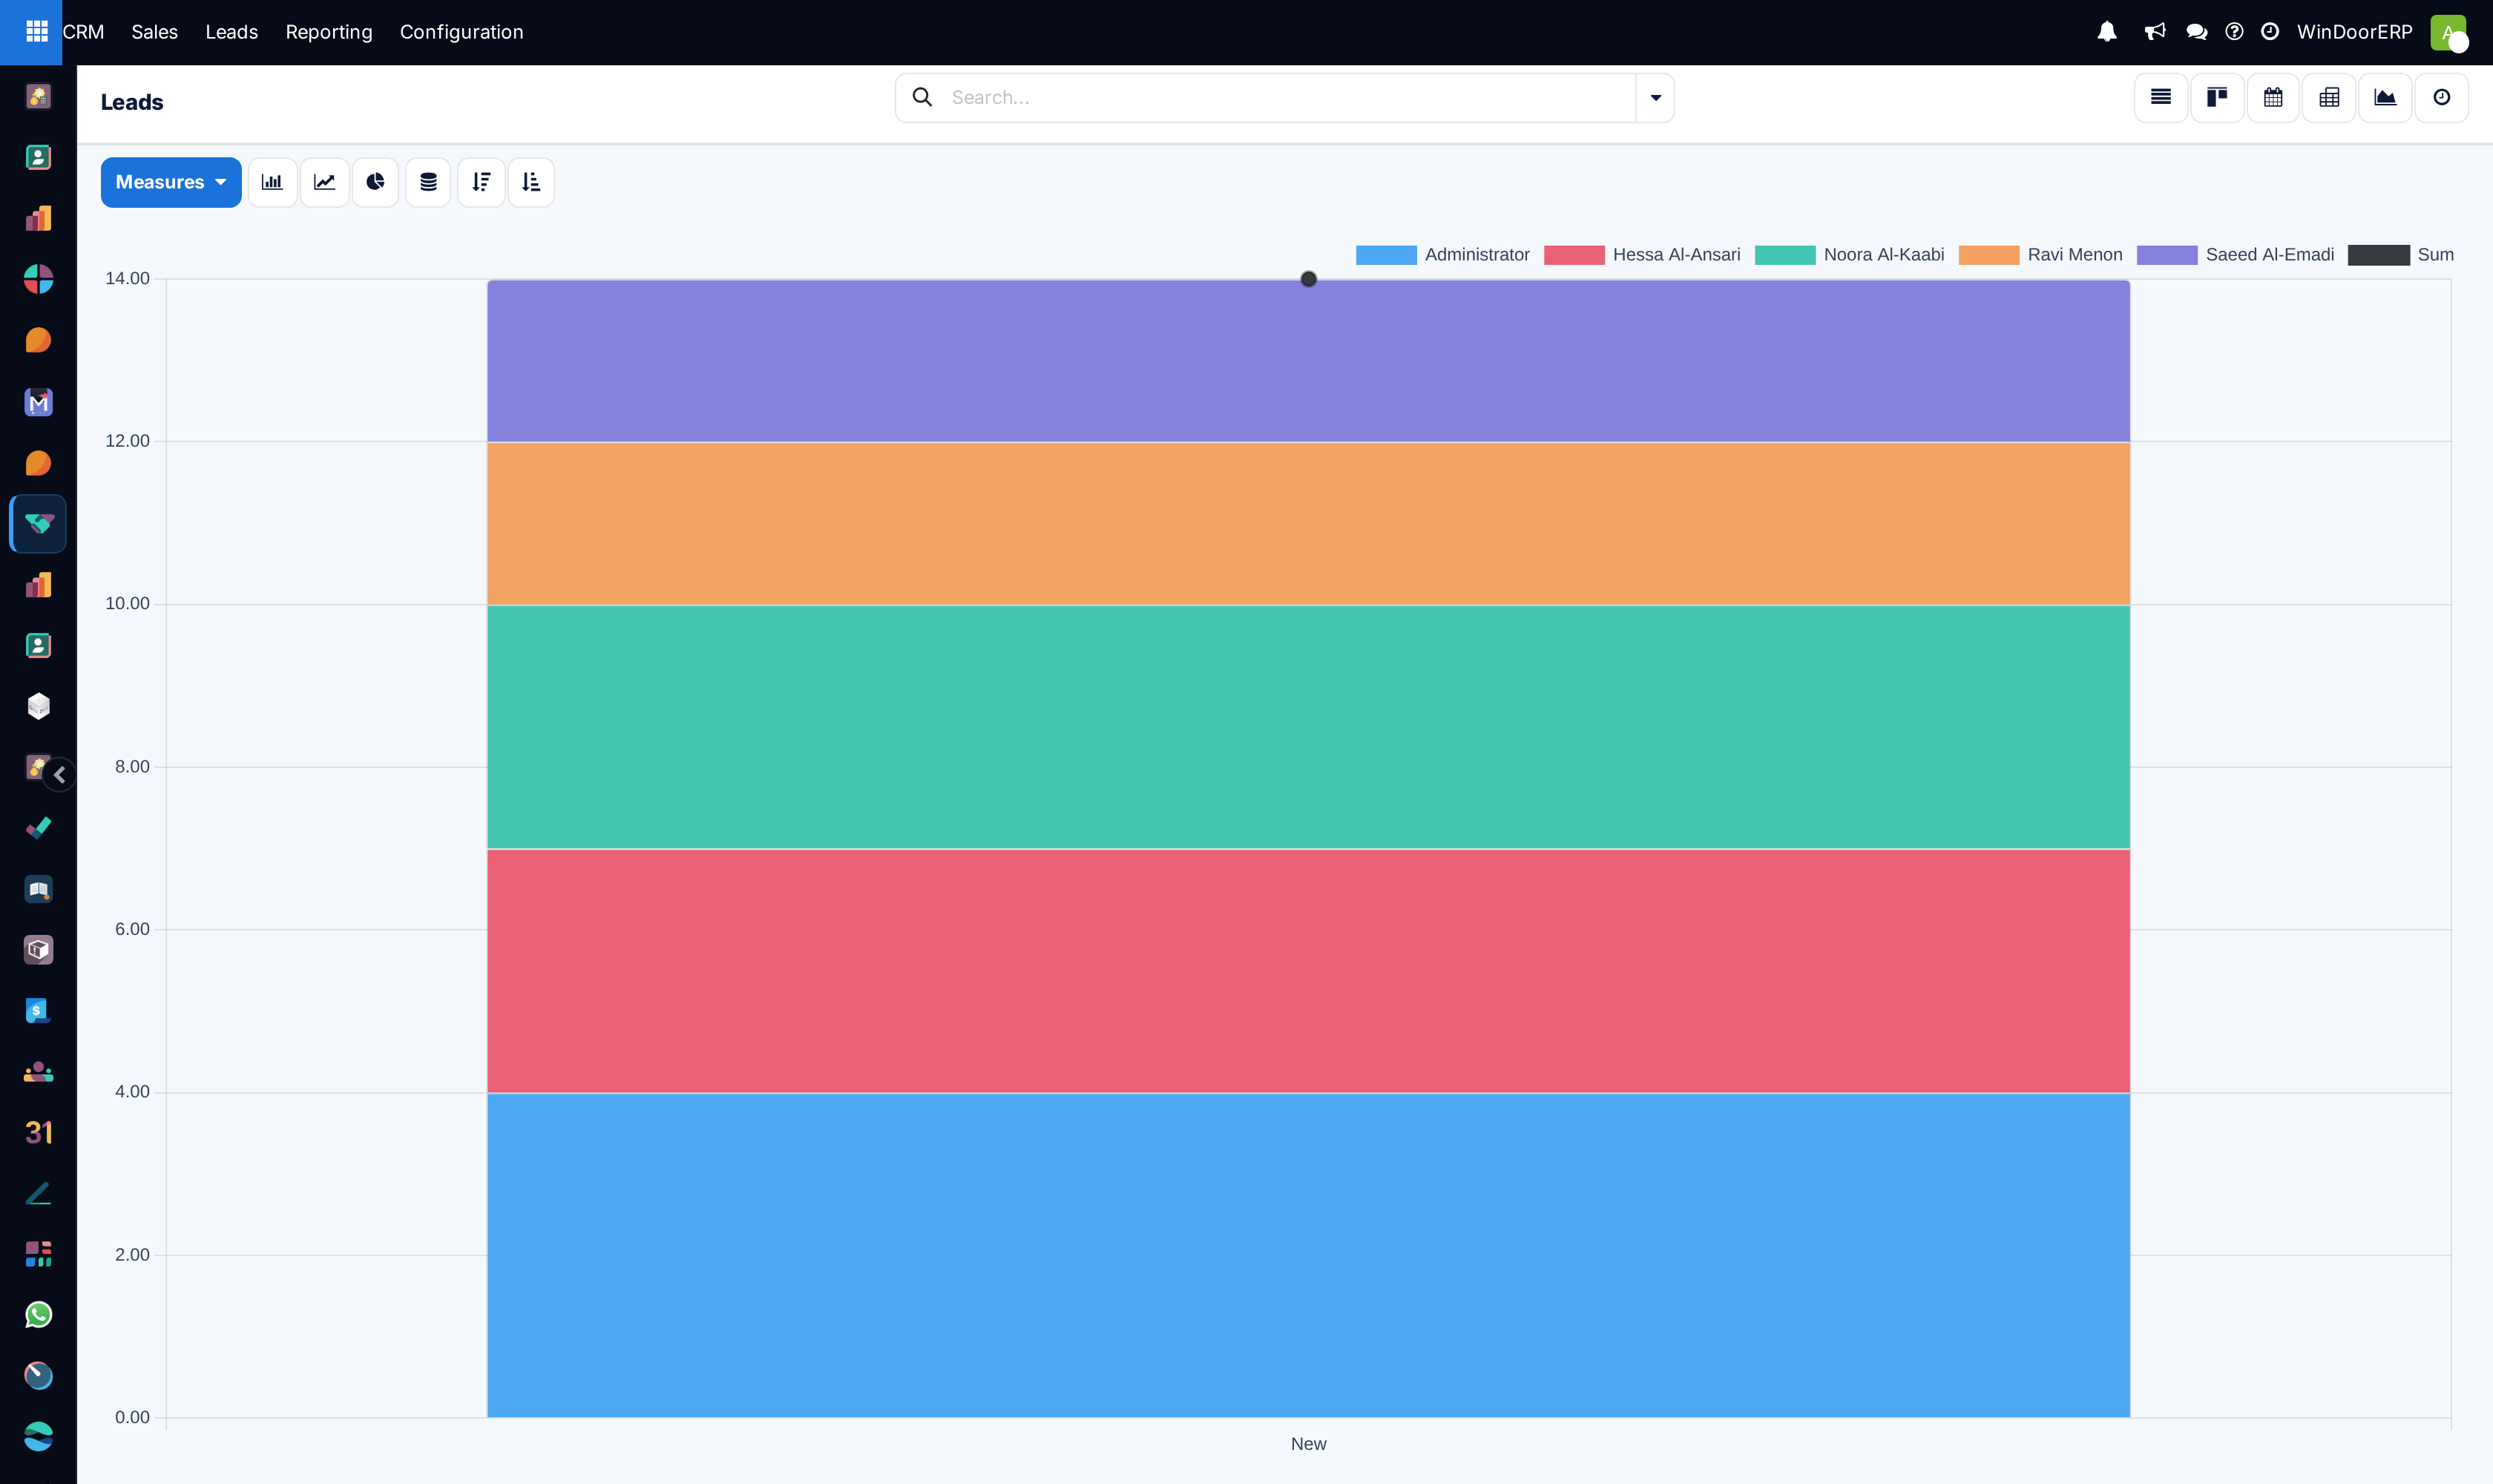
Open CRM › Reporting › Pipeline and switch to the Pivot view.
-
02
Select Measures: toggle between Expected Revenue and Prorated Revenue.
-
03
Group rows by Stage, Sales Team, or Salesperson.
-
04
Group columns by Expected Closing Date › Month to inspect quarterly revenue projections.
-
05
Drill down into individual stages to identify high-value commercial tenders requiring senior executive intervention.
Common mistakes
- Leaving probability at 0% or 100% on early-stage leads, distorting weighted pipeline revenue.
- Failing to update expected closing dates when commercial projects experience site readiness delays.
Was this article helpful?
Thanks — your feedback helps.
Running a window or door factory?
Ask for a demo