Perform deep order lines analytics across product categories, profile finishes, and margins
What this does
Analyzes order lines data across multi-dimensional pivot tables and charts to reveal which aluminium profile series, glass layups, and accessory combinations generate the highest sales volume and gross profit.
Before you start
- Sales Manager or Cost Controller privileges.
Steps

Important
Drilling down into product line margins identifies low-margin items that require engineering cost optimization or vendor renegotiation.
-
01
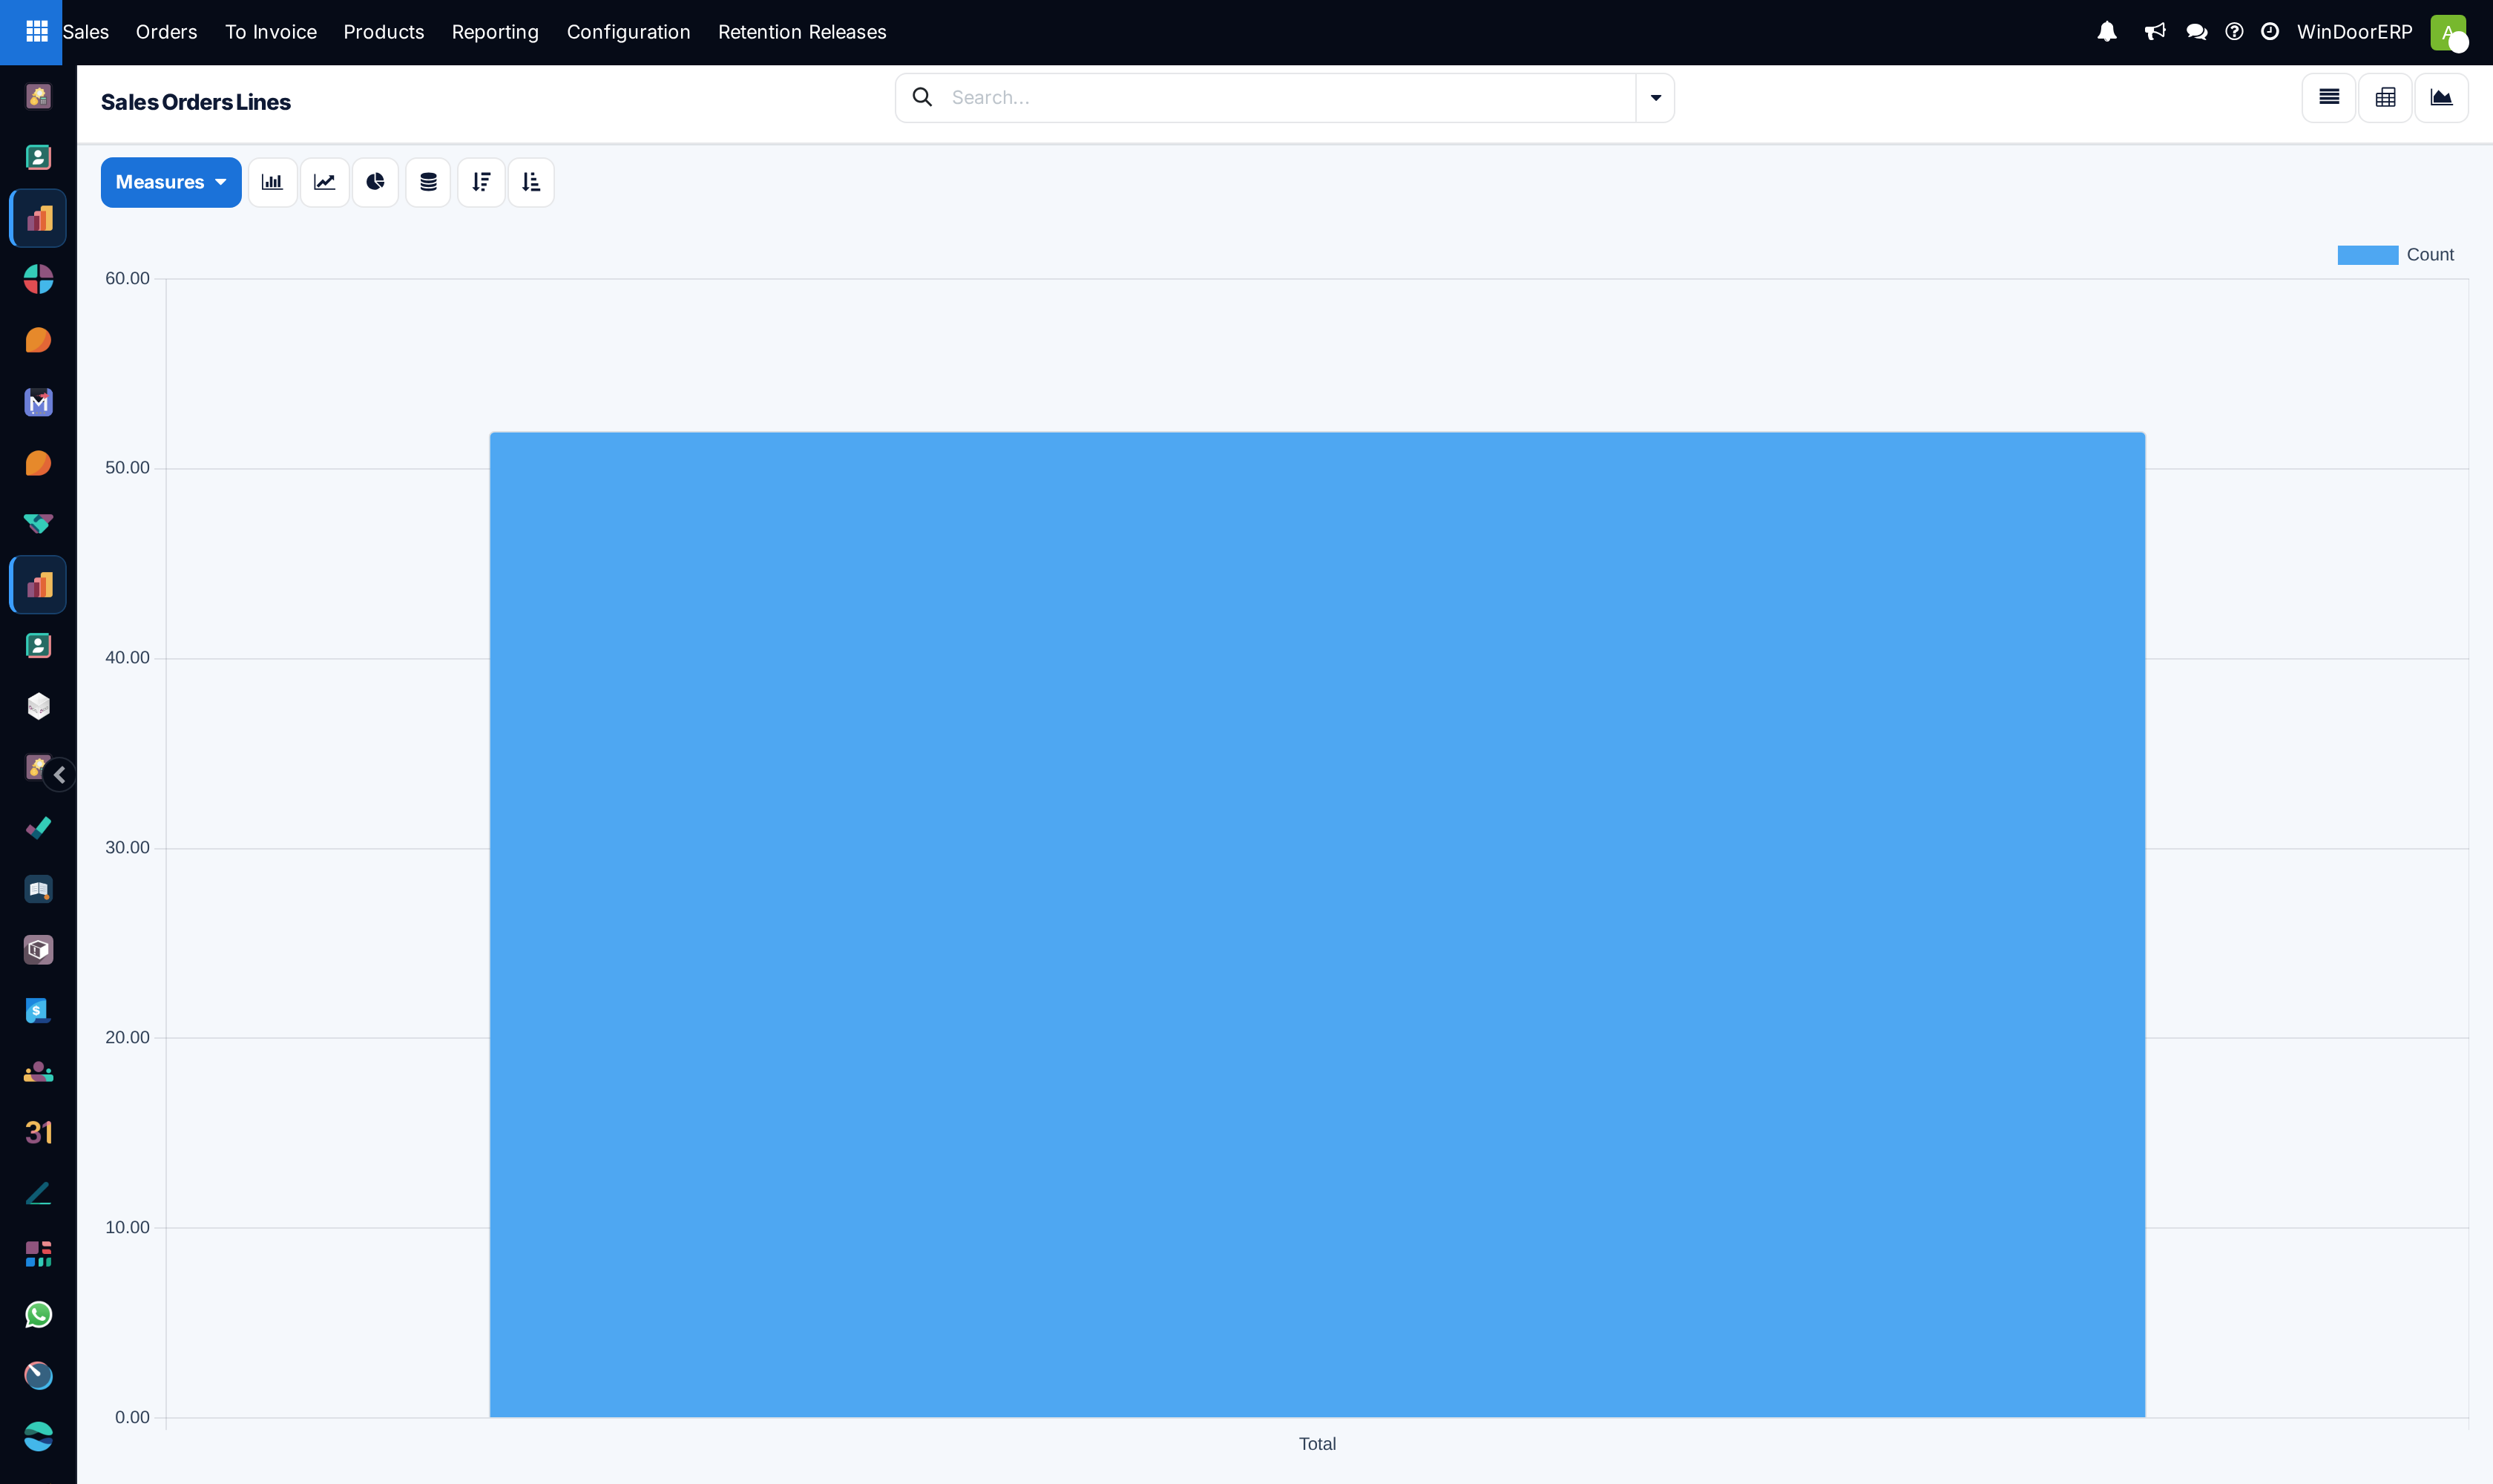
Open Sales › Orders › Sales Order Lines and switch to the Pivot or Graph view.
-
02
Select Measures: analyze Quantity Invoiced, Subtotal Untaxed, and Margin.
-
03
Group by Product Category (e.g. Curtain Walls, Thermal Break Sliding Doors, Frameless Glass).
-
04
Group by Order Date › Quarter to track demand trends across different architectural specifications.
Common mistakes
- Analyzing product line sales without factoring in scrap remnant and cutting waste percentages.
- Evaluating sales volume alone without filtering by net profit margin.
Was this article helpful?
Thanks — your feedback helps.
Running a window or door factory?
Ask for a demo