Analyze stock movements and material consumption trends
What this does
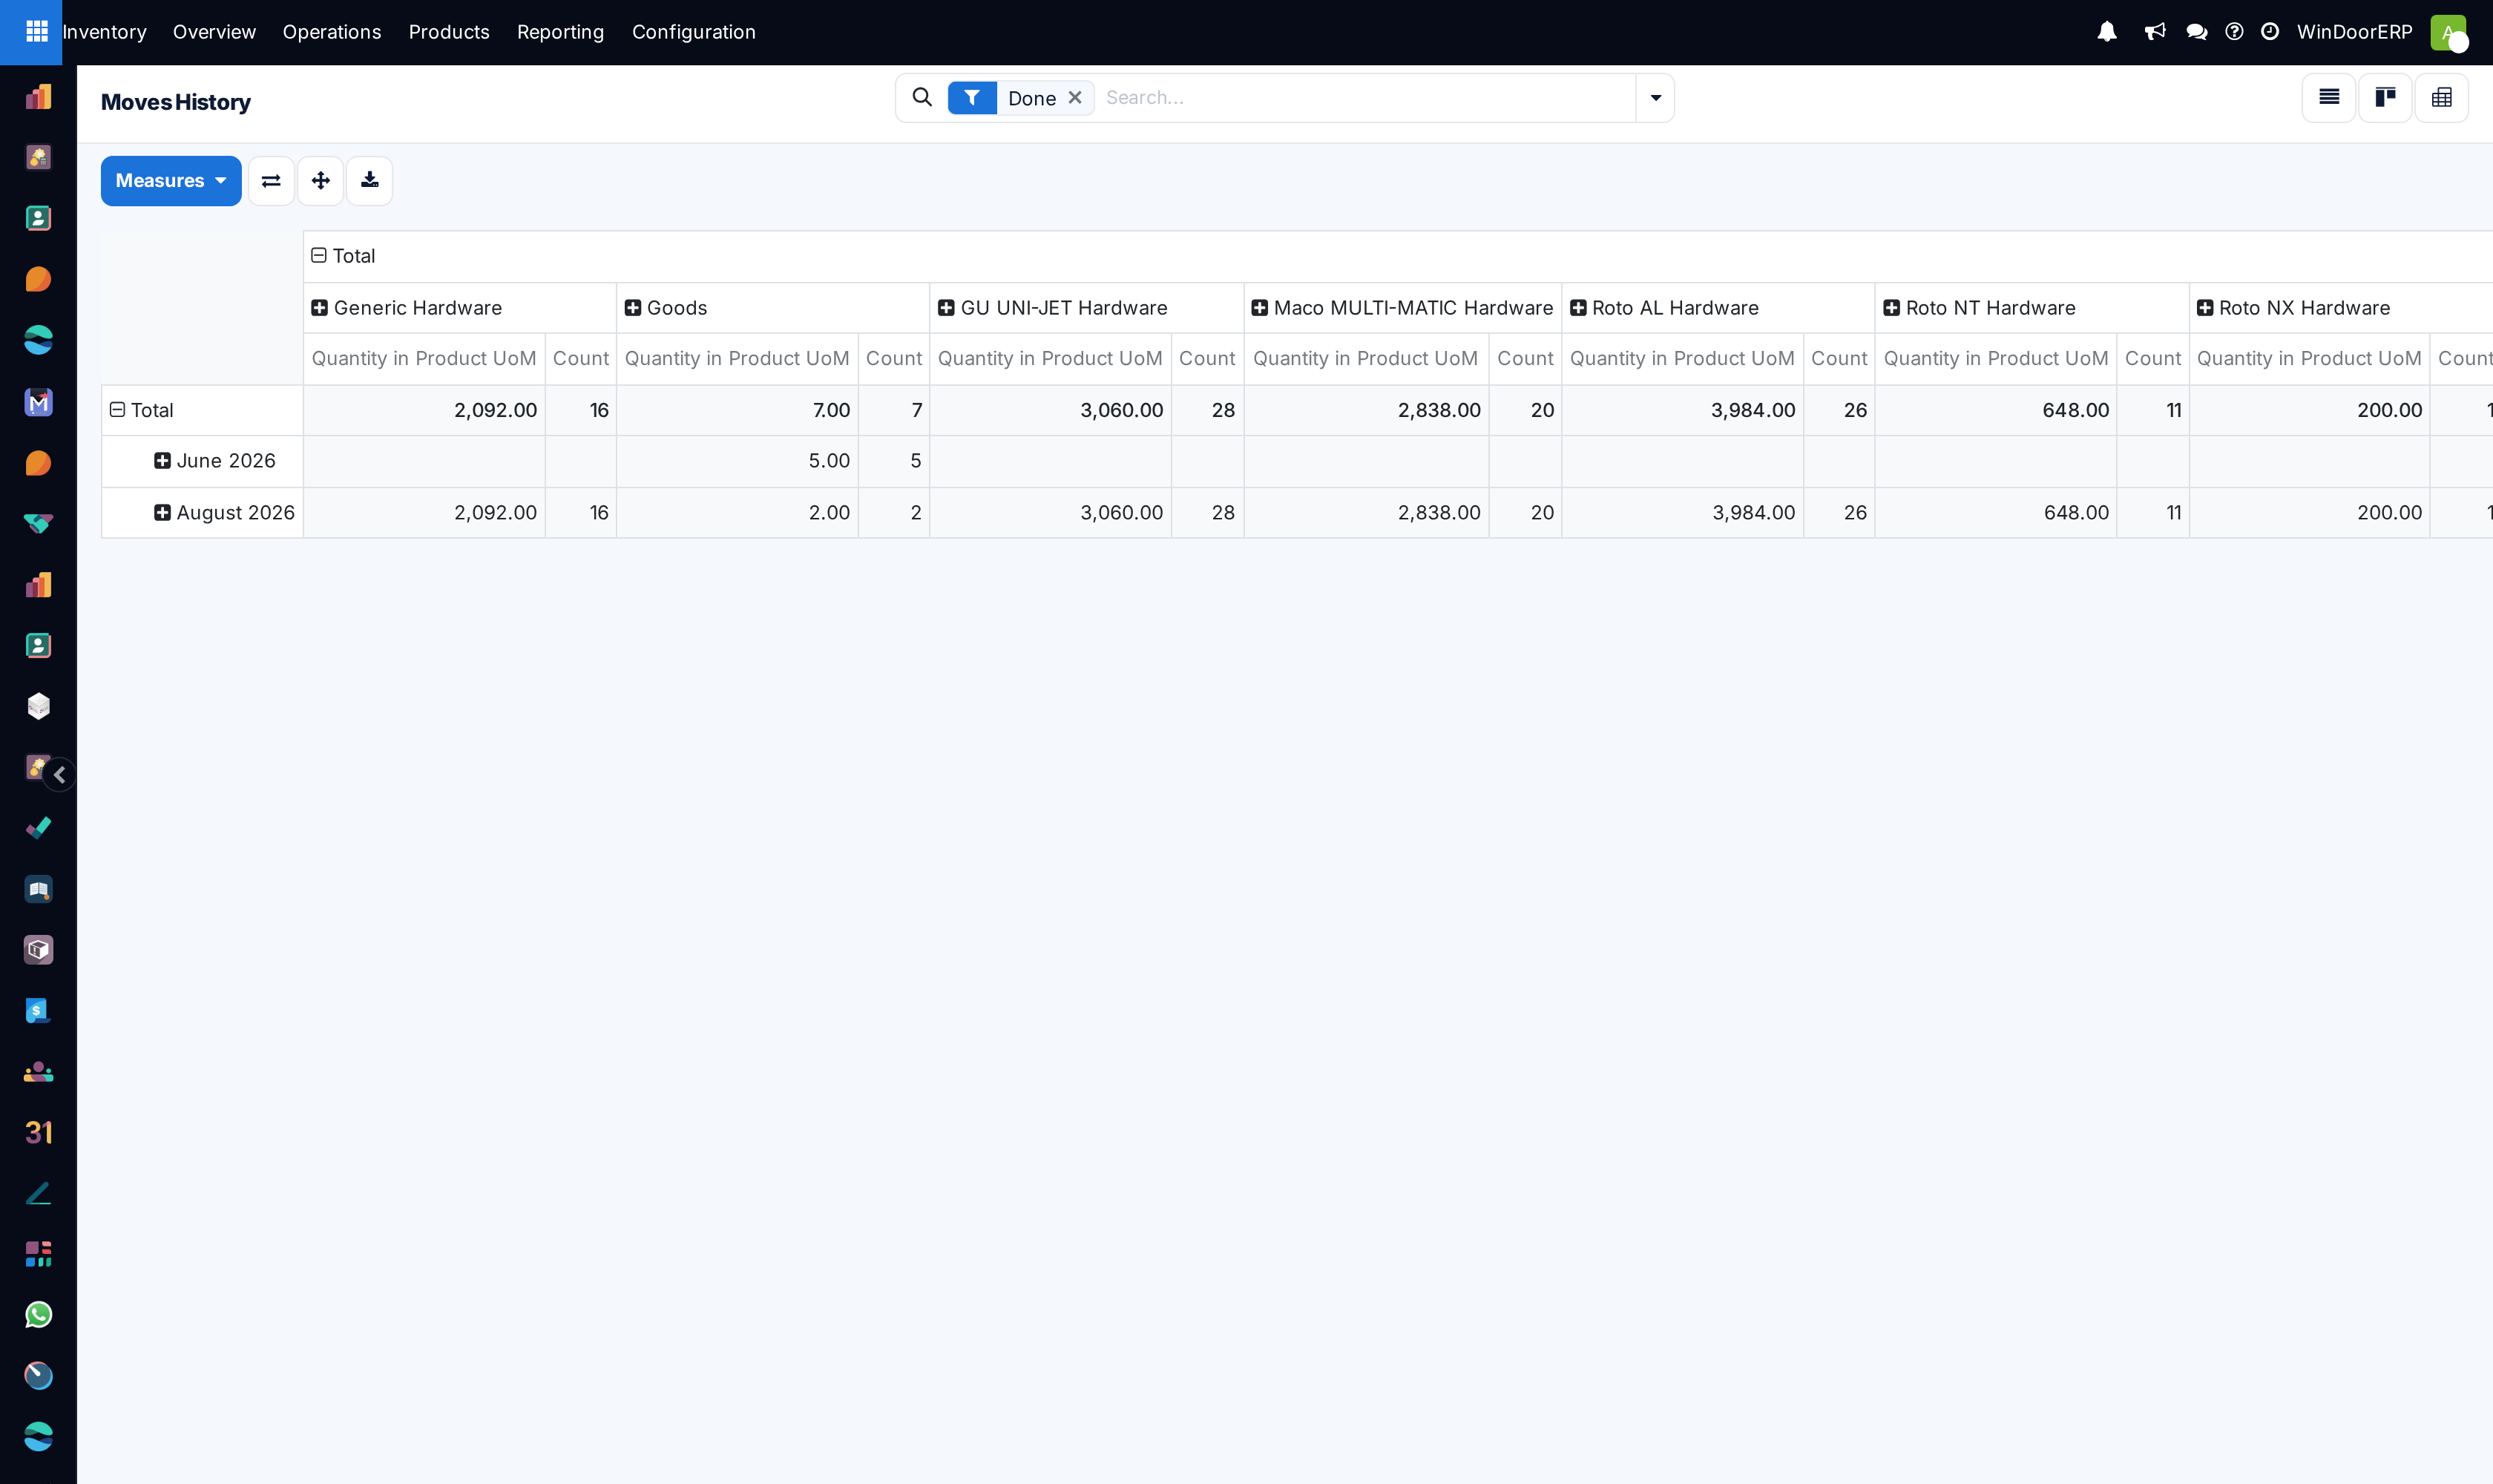
Provides multidimensional analysis of historical stock movements across warehouses, production lines, and delivery routes. You can cross-tabulate quantities moved, source/destination locations, and monthly consumption volumes by product family.
Before you start
- Understand the distinction between stock moves (planned transfers) and stock move lines (actual physical units moved).
Steps
-
01
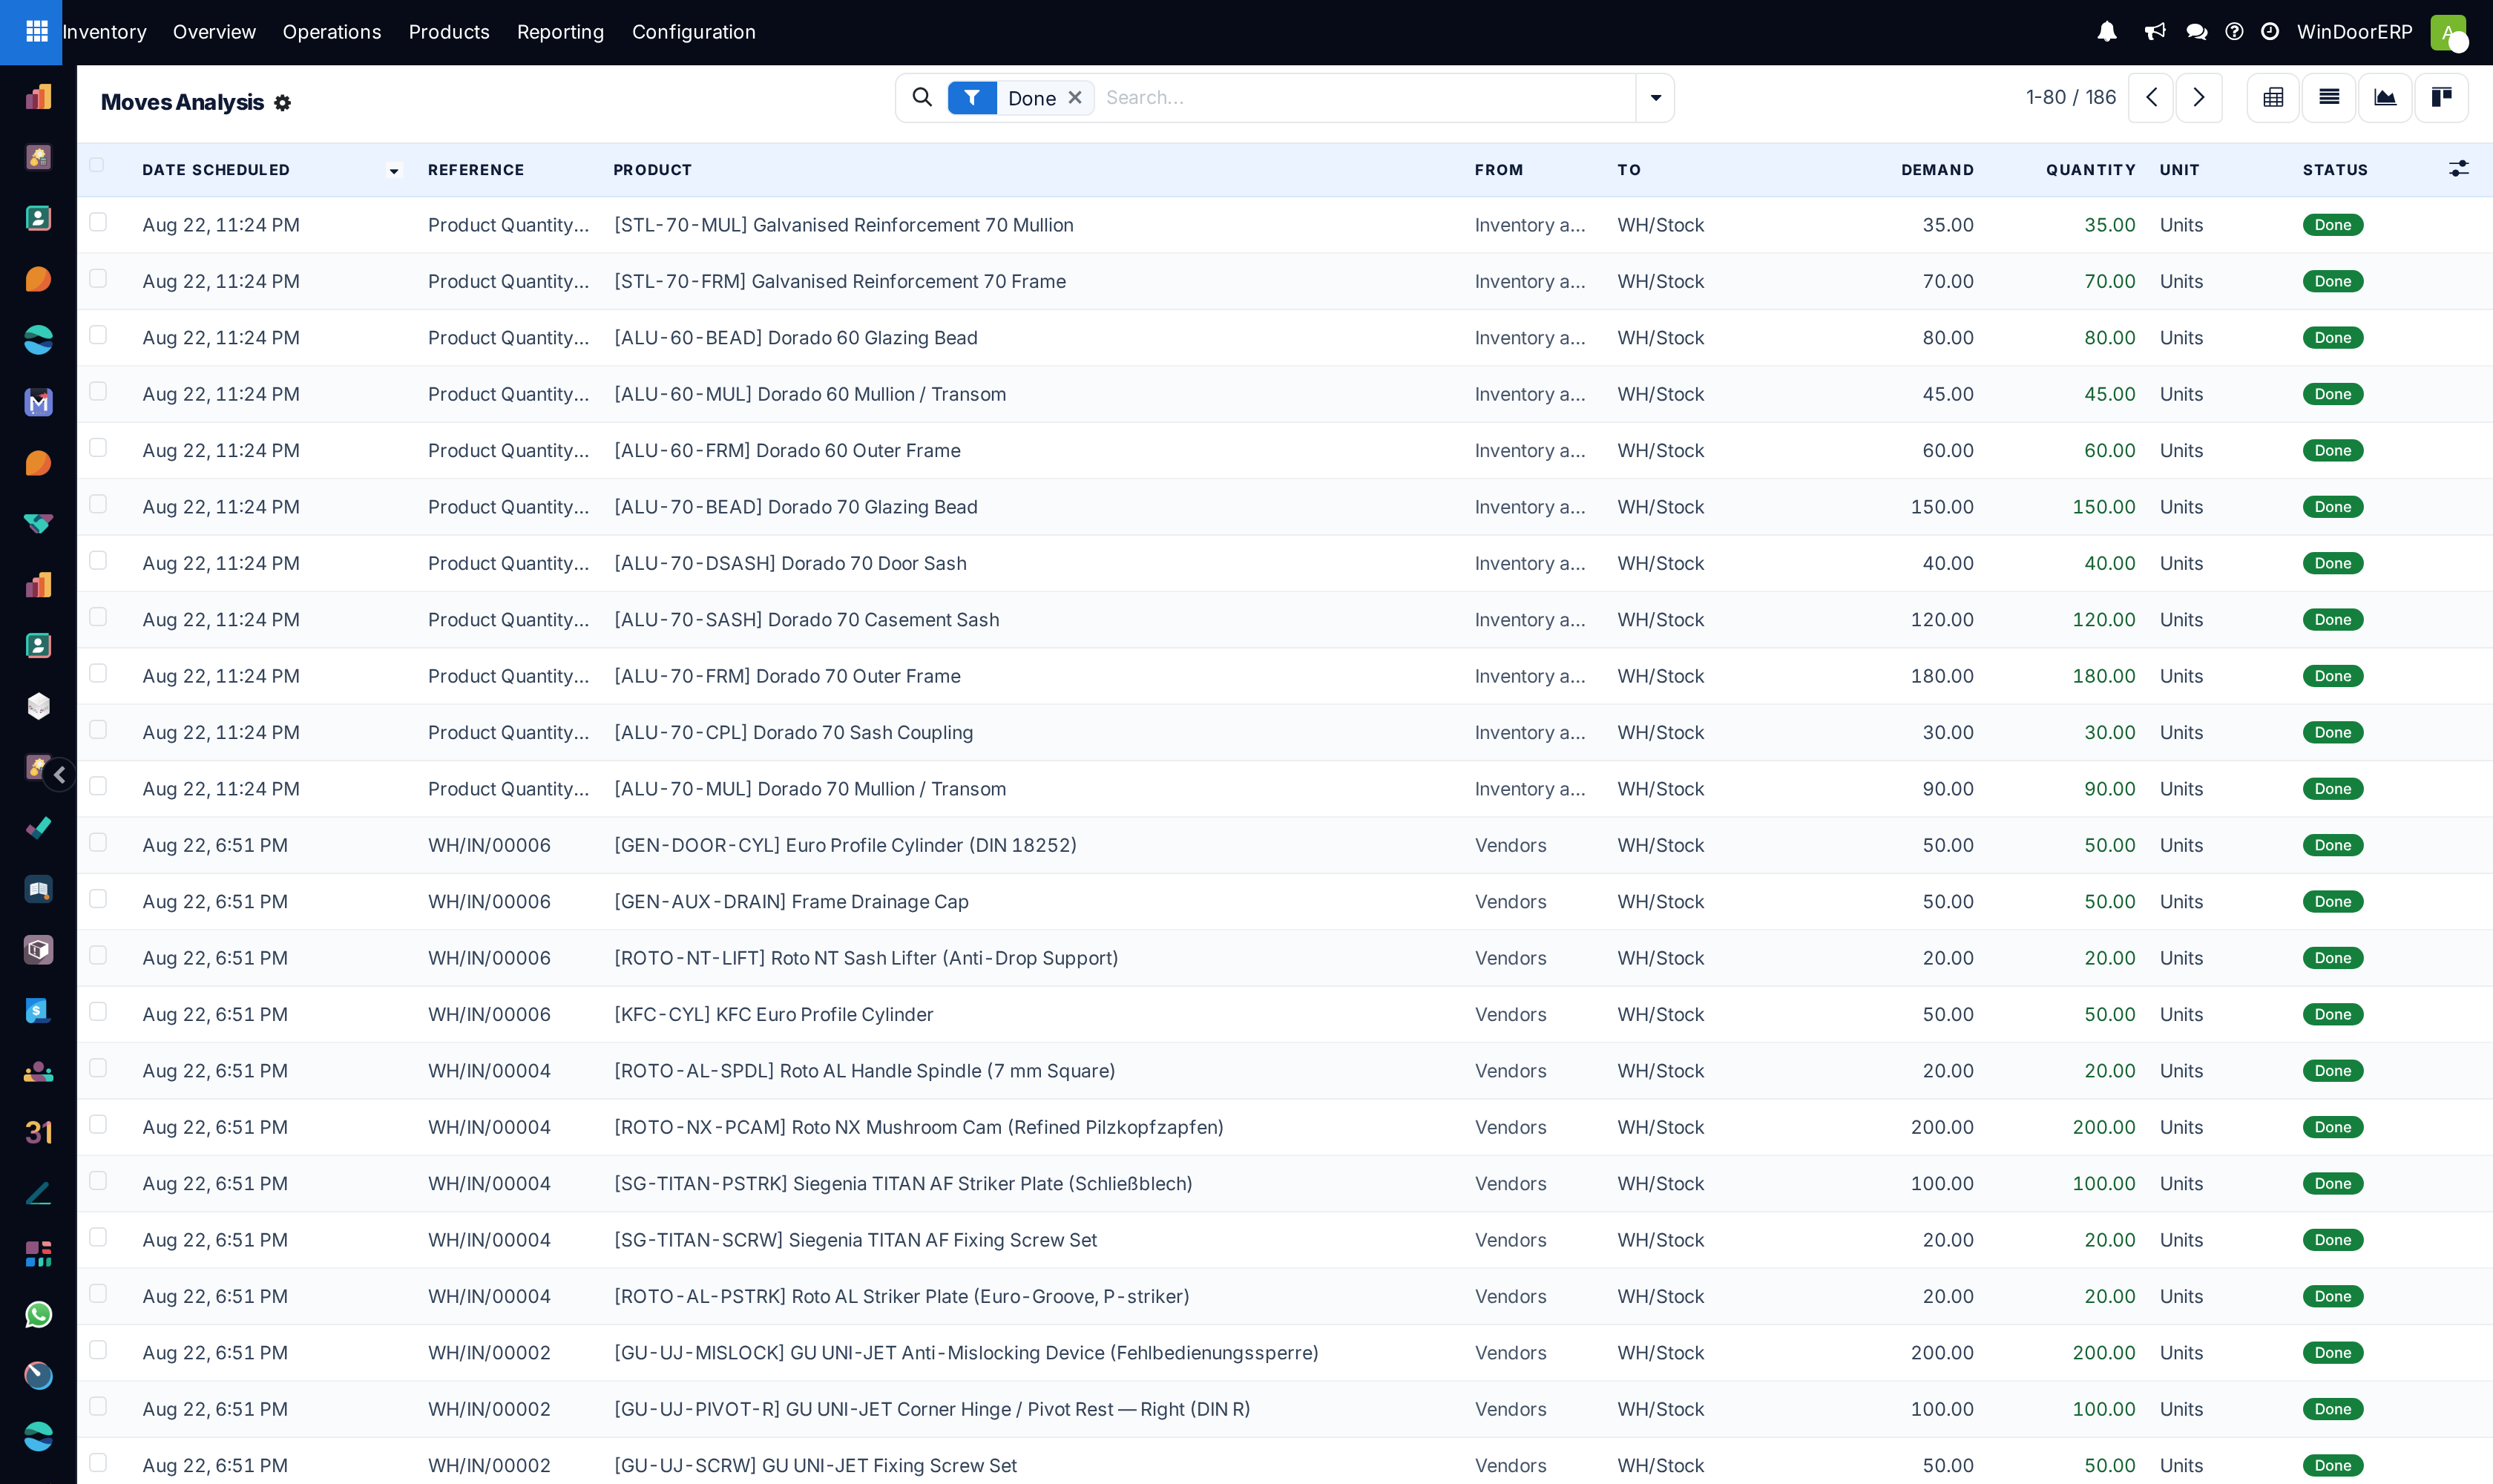
Open Inventory › Reporting › Moves Analysis.
-
02
Click the Pivot or Graph view icon in the top-right toolbar.
-
03
Click Measures and choose Quantity Done, Value, or Line Count.
-
04
Group rows by Product Category or Product, and columns by Date (Month) or Operation Type.
-
05
Export to spreadsheet or save the search as a Favourite for monthly management reviews.
Common mistakes
- Analyzing cancelled or draft moves alongside done moves: always filter by Status: Done for accurate historical consumption figures.
Was this article helpful?
Thanks — your feedback helps.
Running a window or door factory?
Ask for a demo