Analyze task velocity, project profitability, and customer satisfaction ratings
What this does
Delivers executive intelligence on task completion rates, engineering bottlenecks, planned versus actual project hours, and customer satisfaction ratings.
Before you start
- Tasks executed and customer milestone ratings received.
Steps
Important
Customer rating surveys triggered automatically upon milestone completion provide immediate early warnings before minor concerns become disputes.
-
01
Navigate to Project › Reporting › Tasks Analysis.
-
02
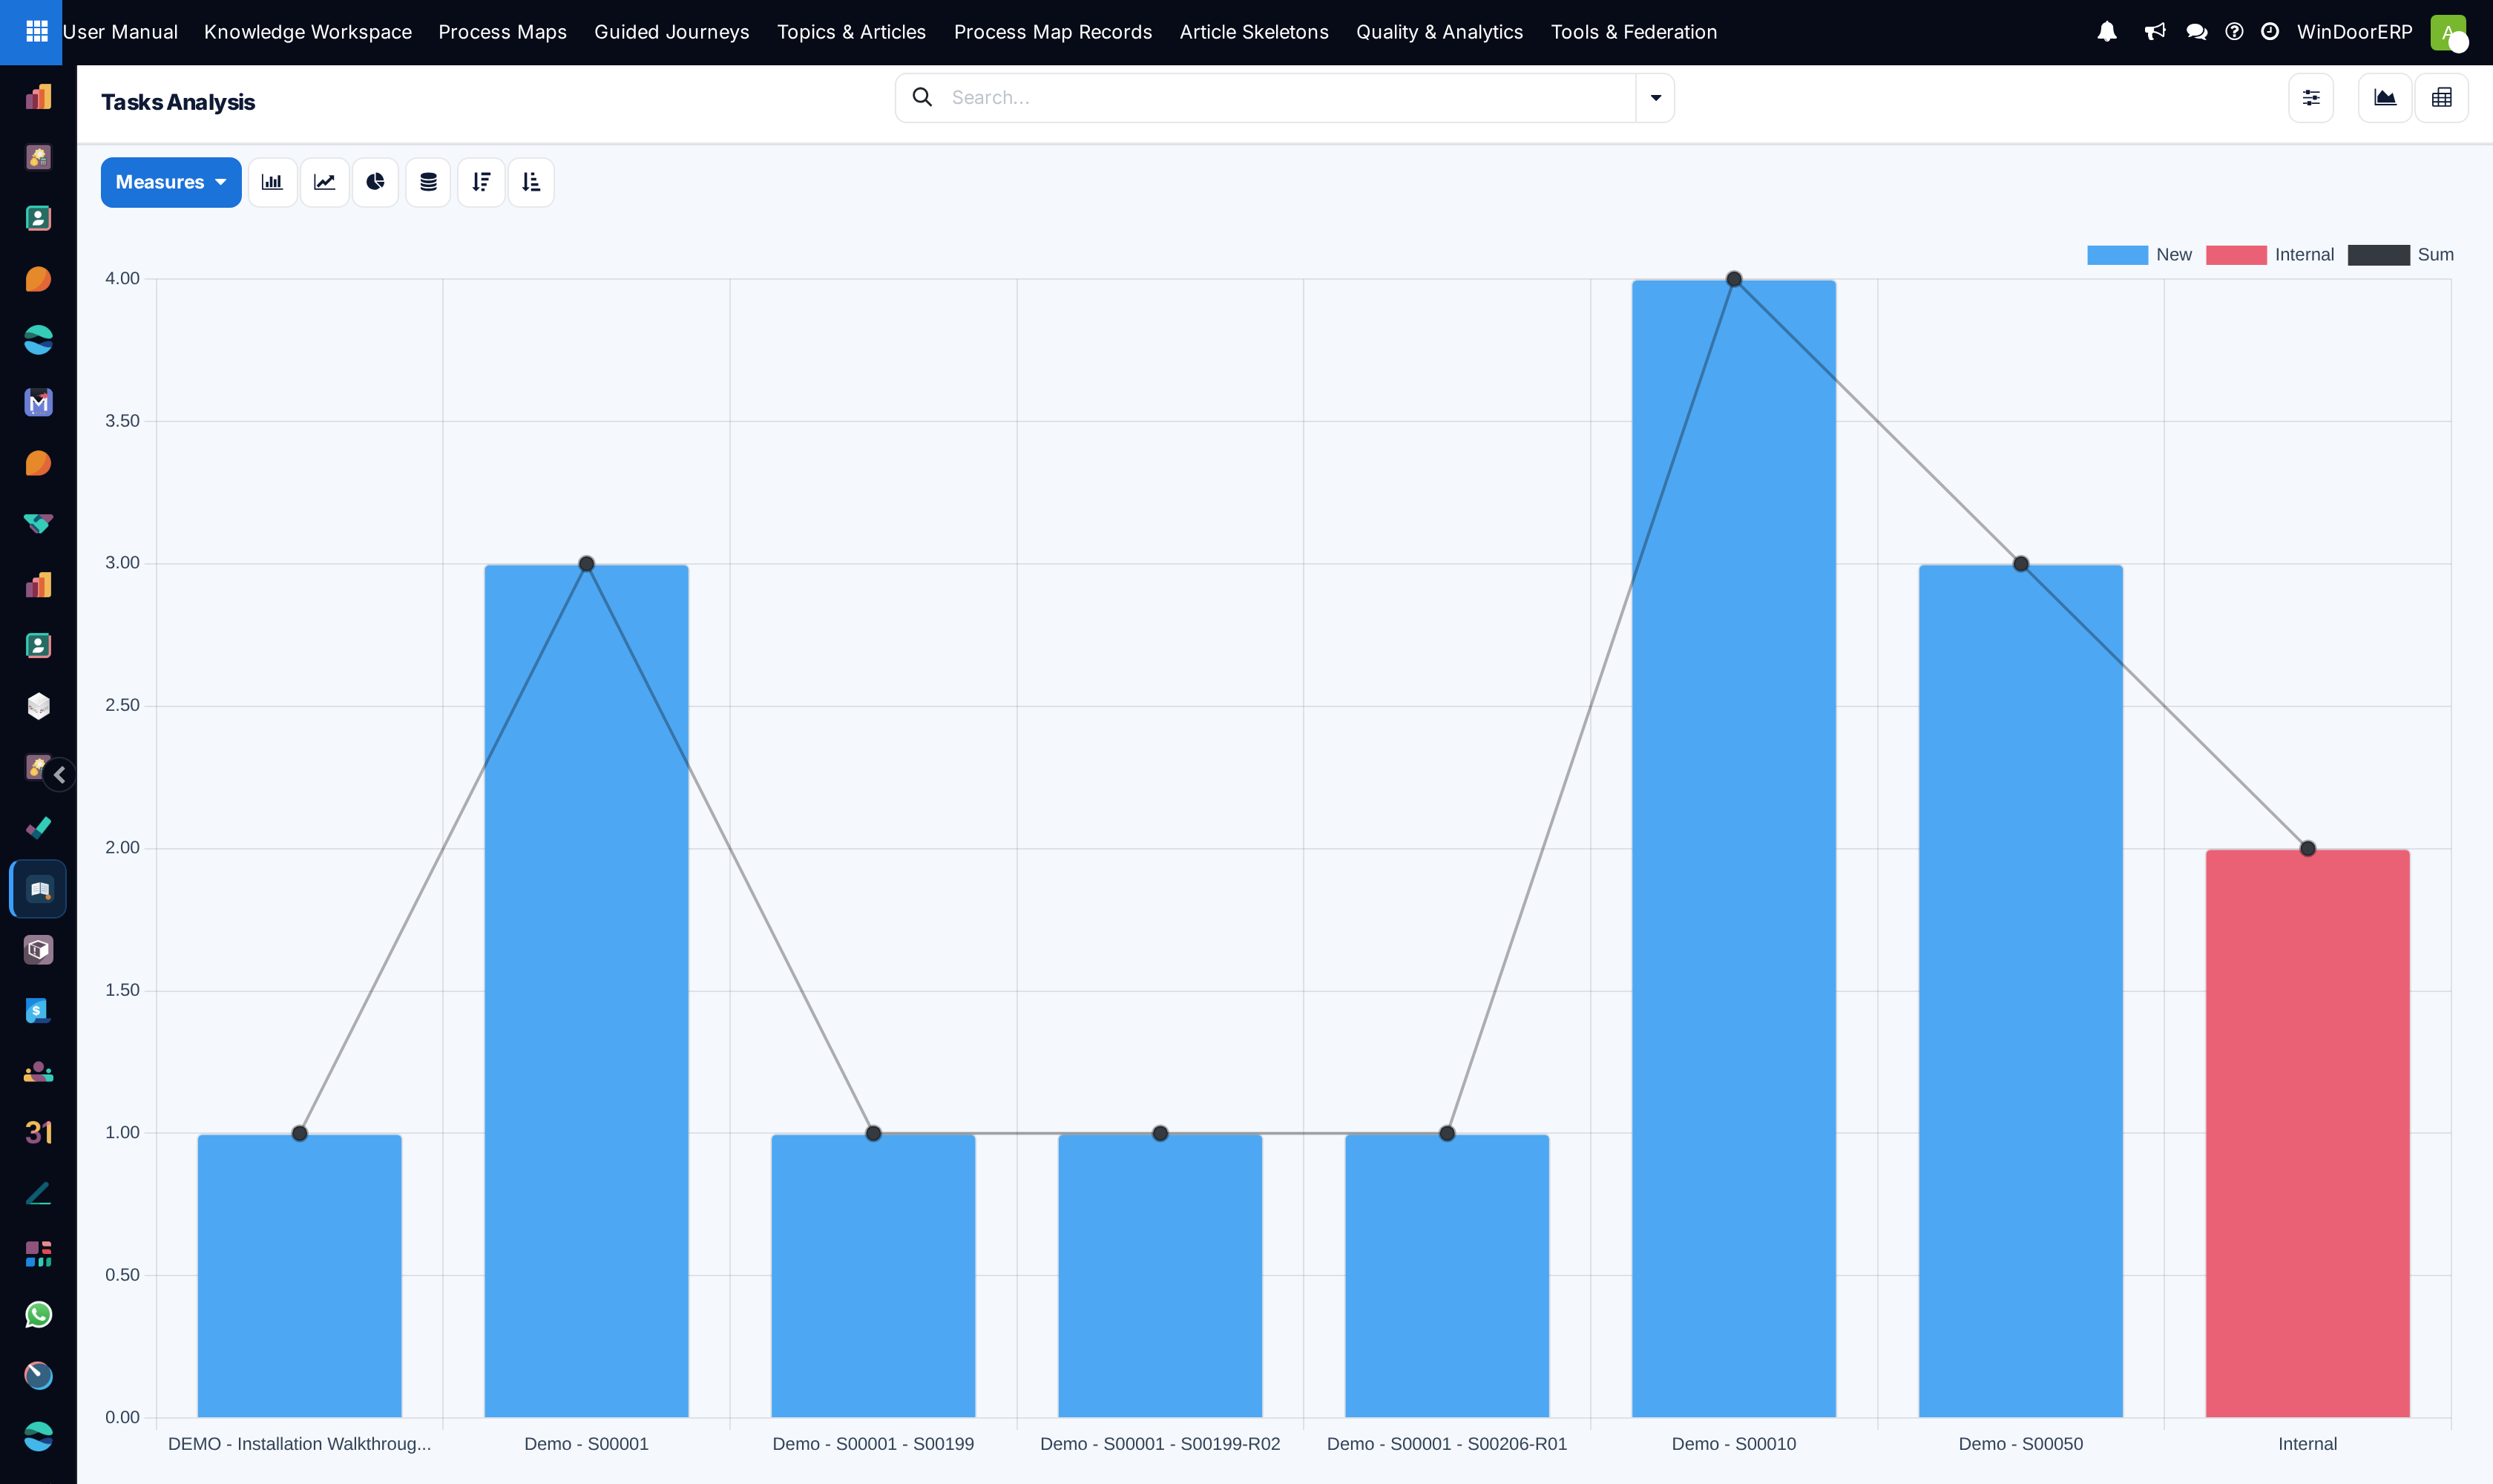
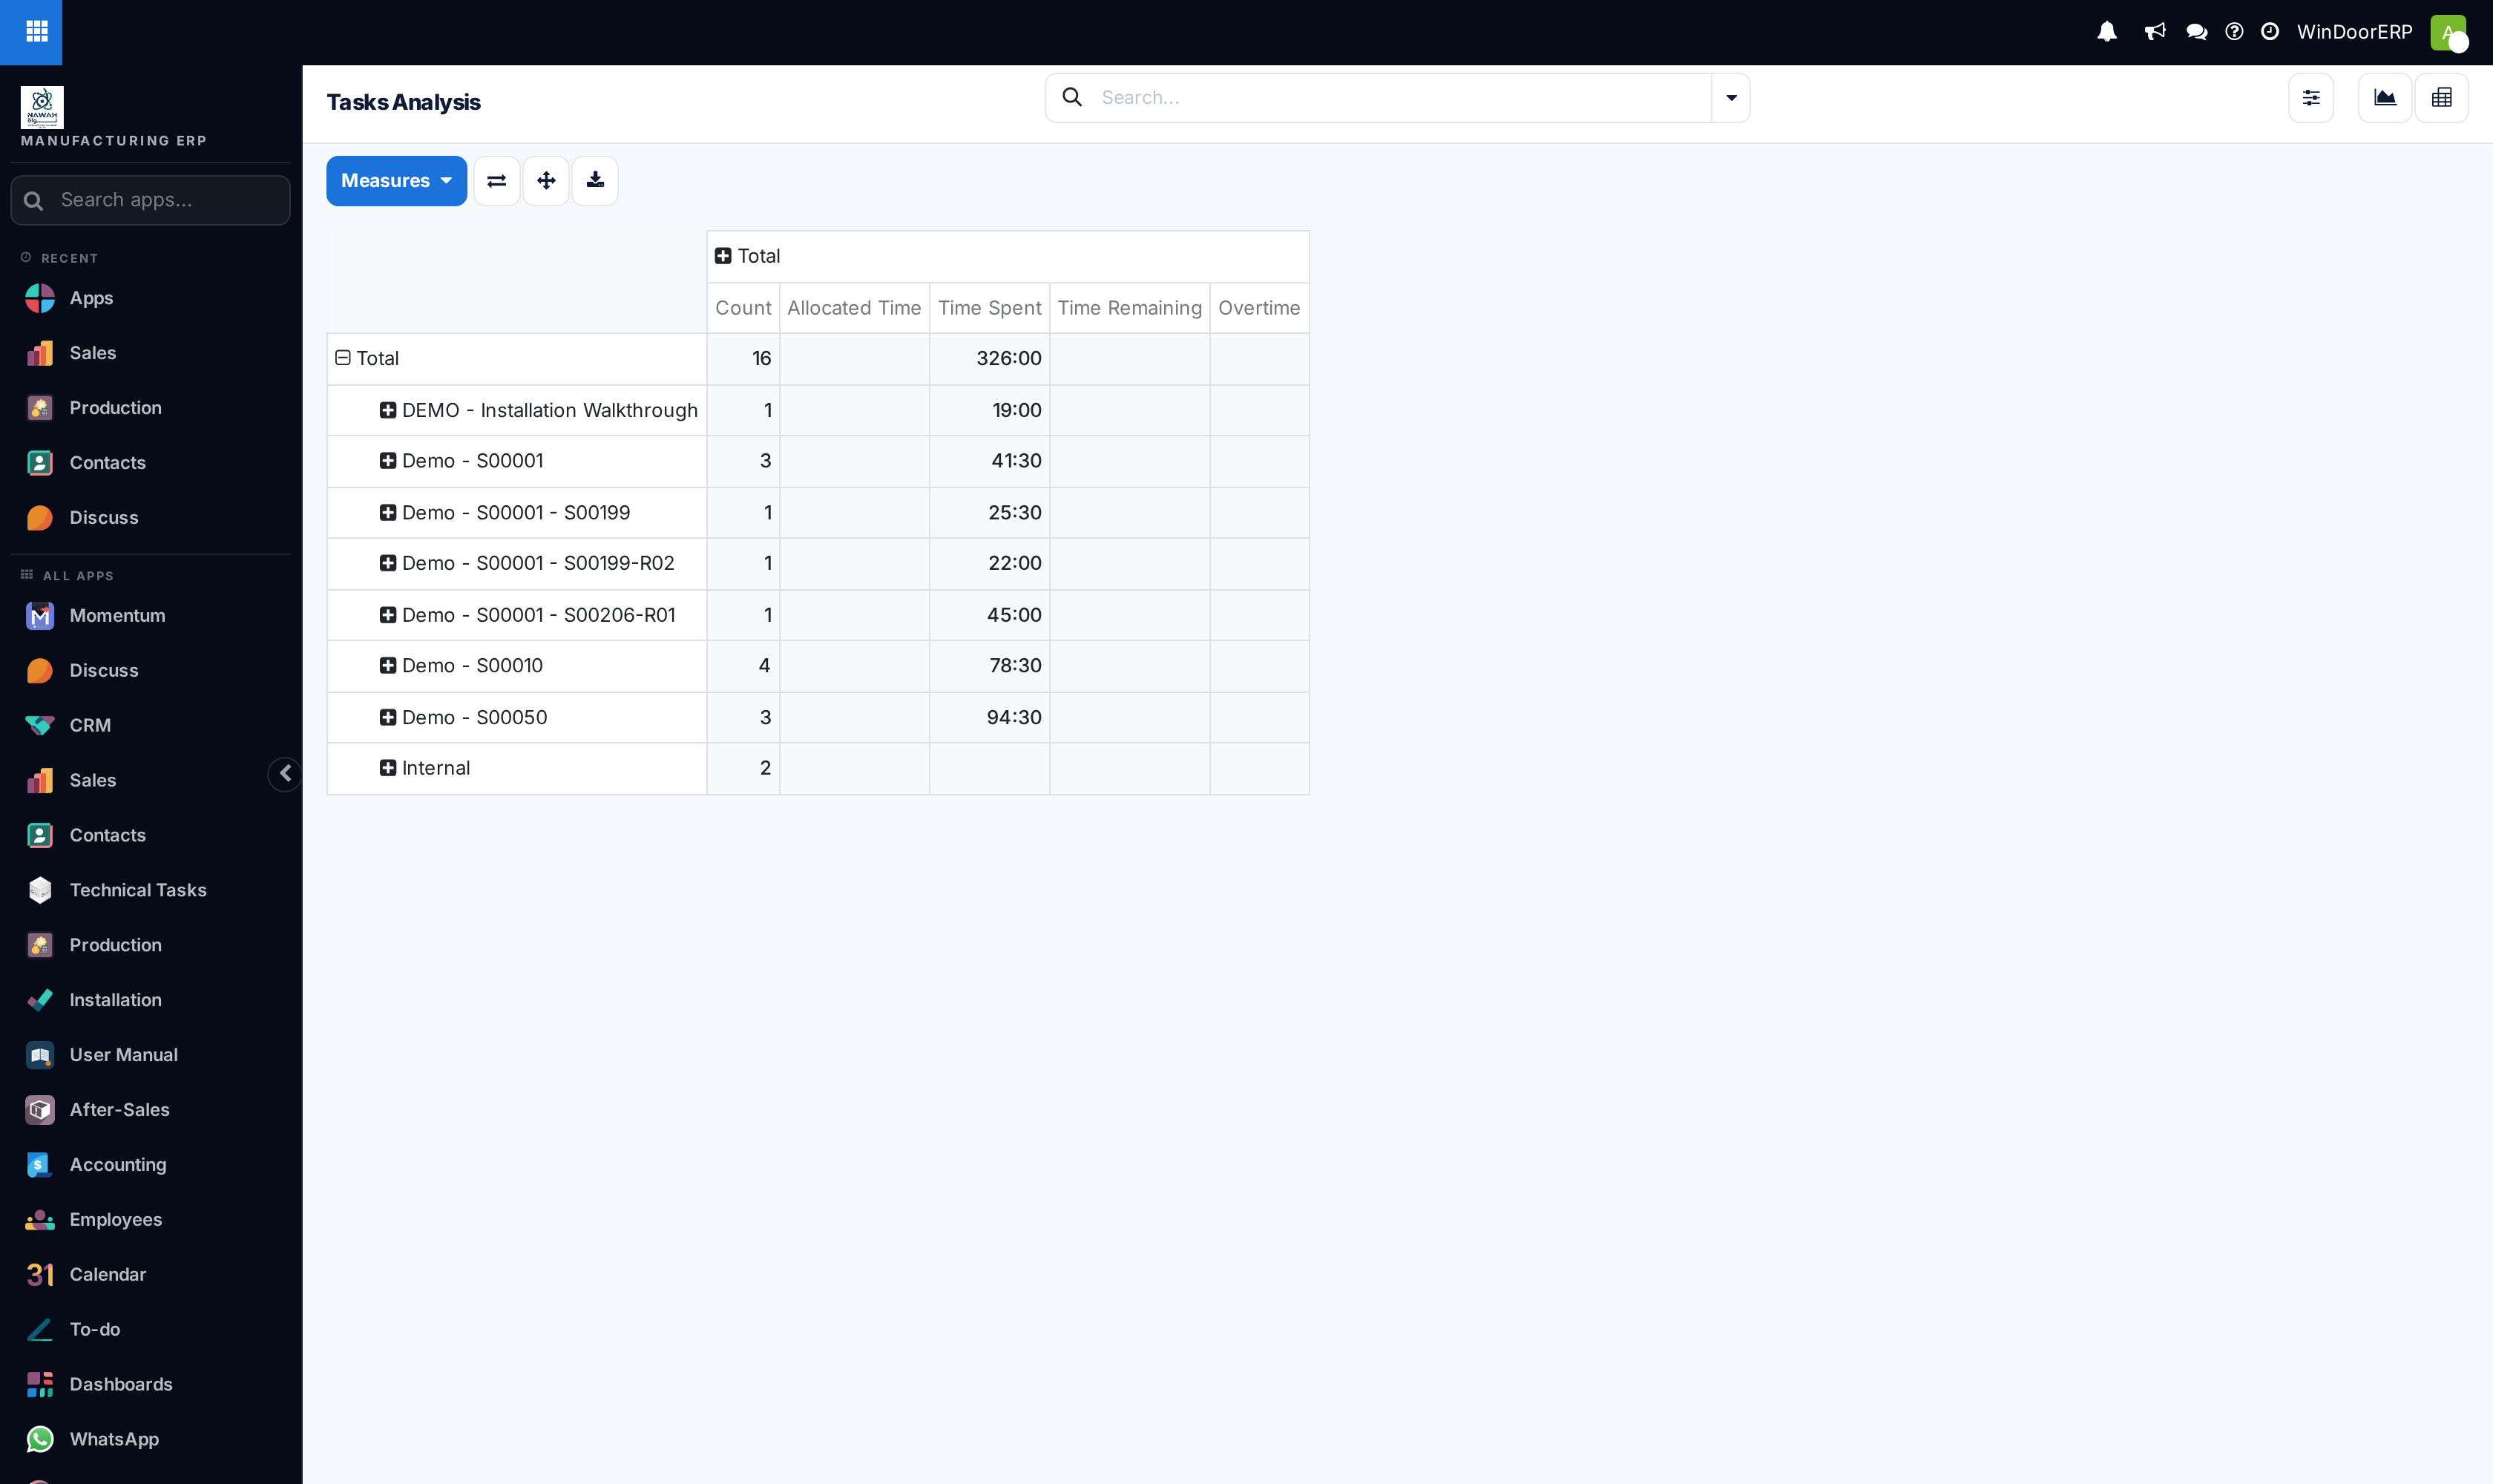
Analyze task completion velocity using the interactive Graph and Pivot matrix.
-
03
Open Project › Reporting › Customer Ratings.
-
04
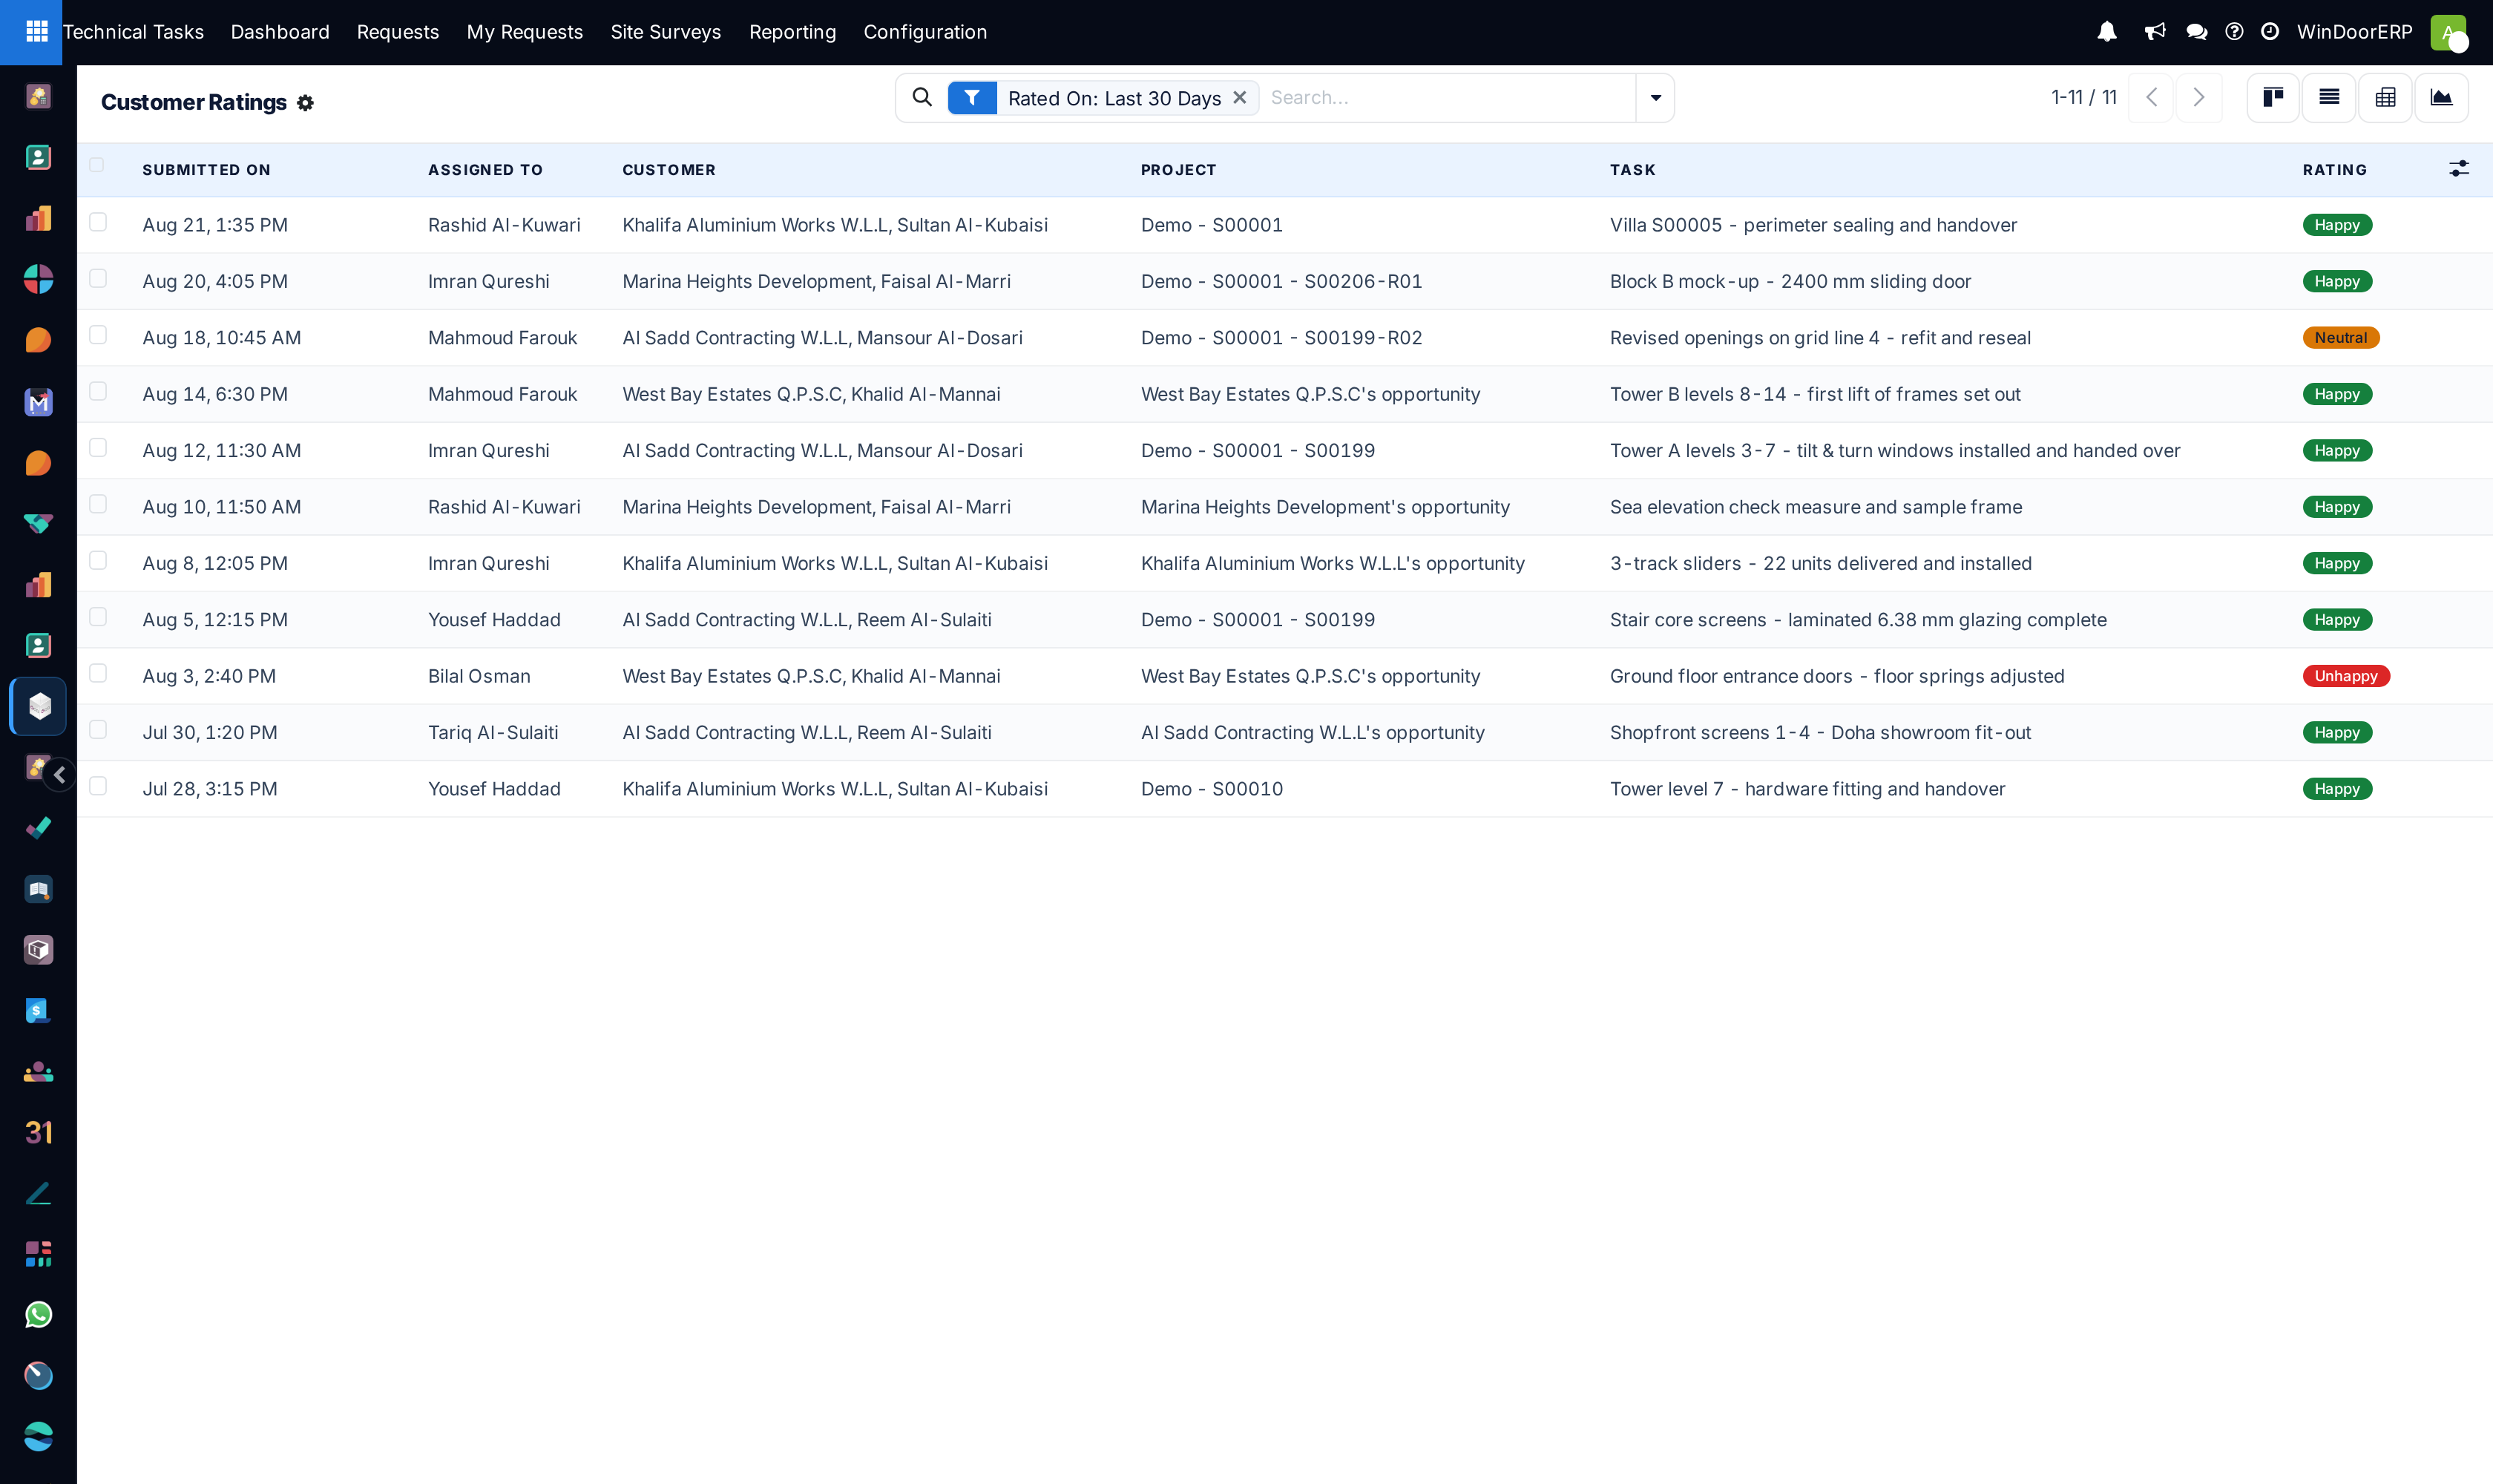
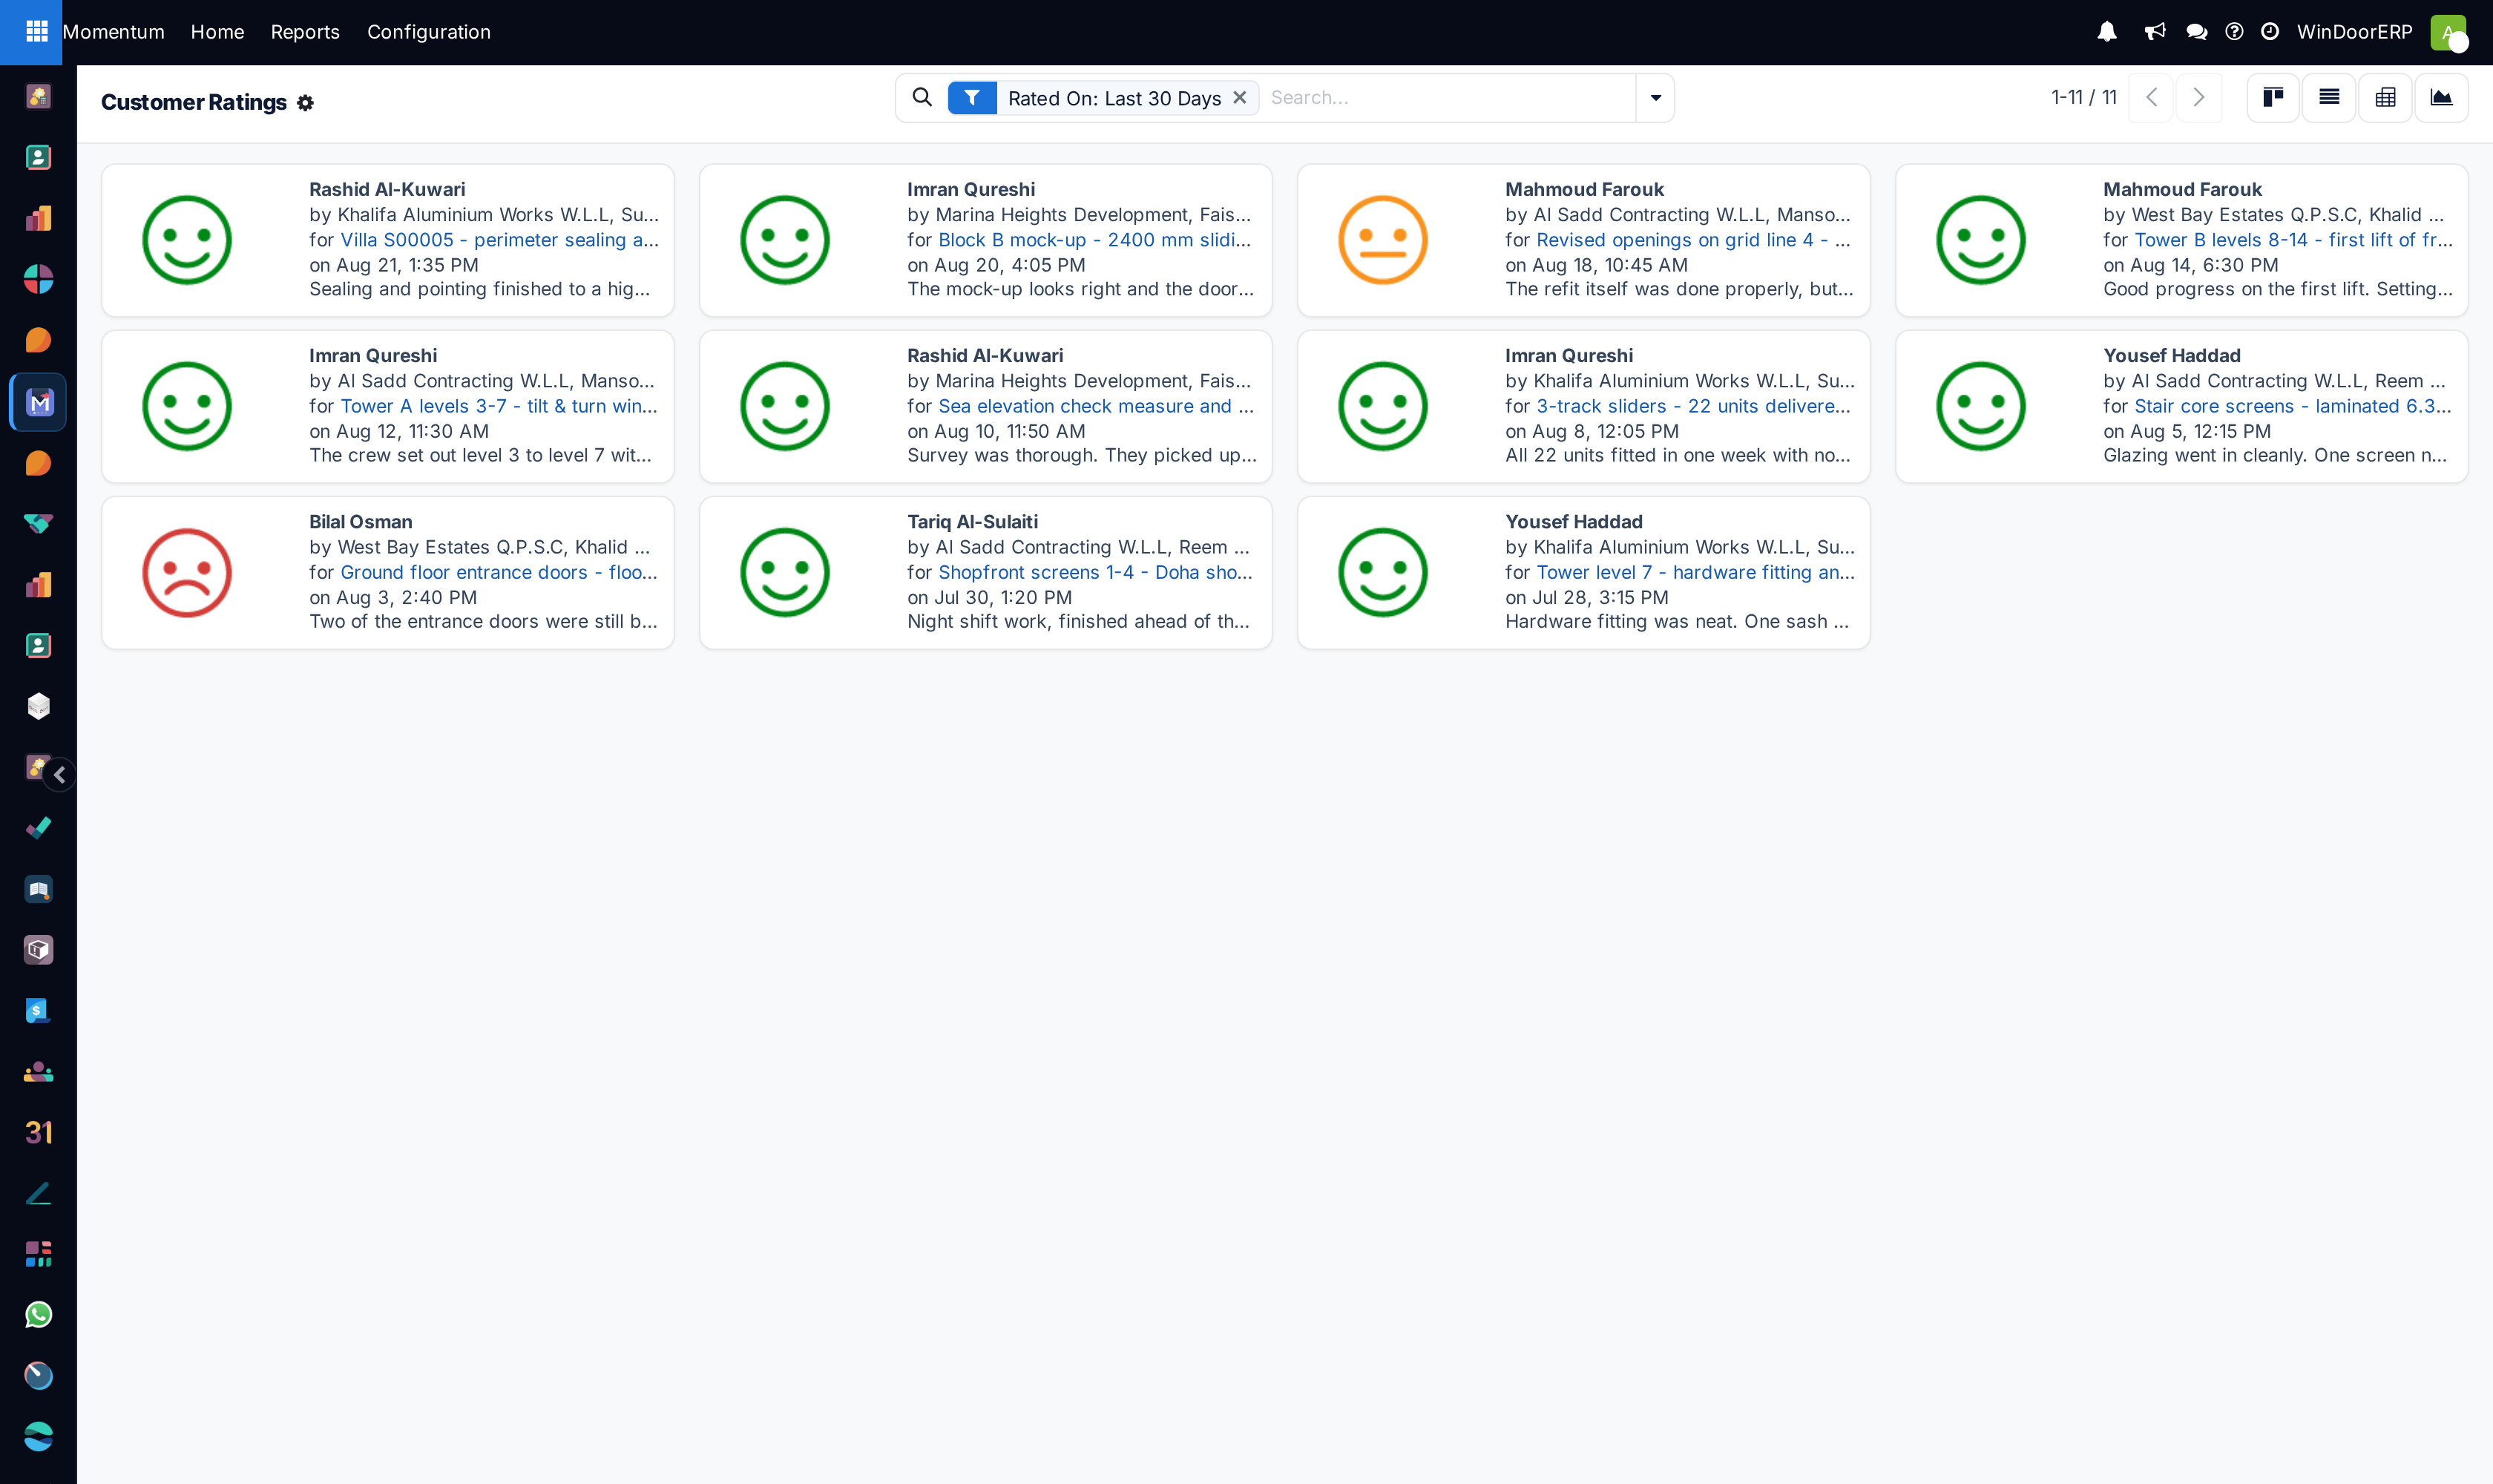
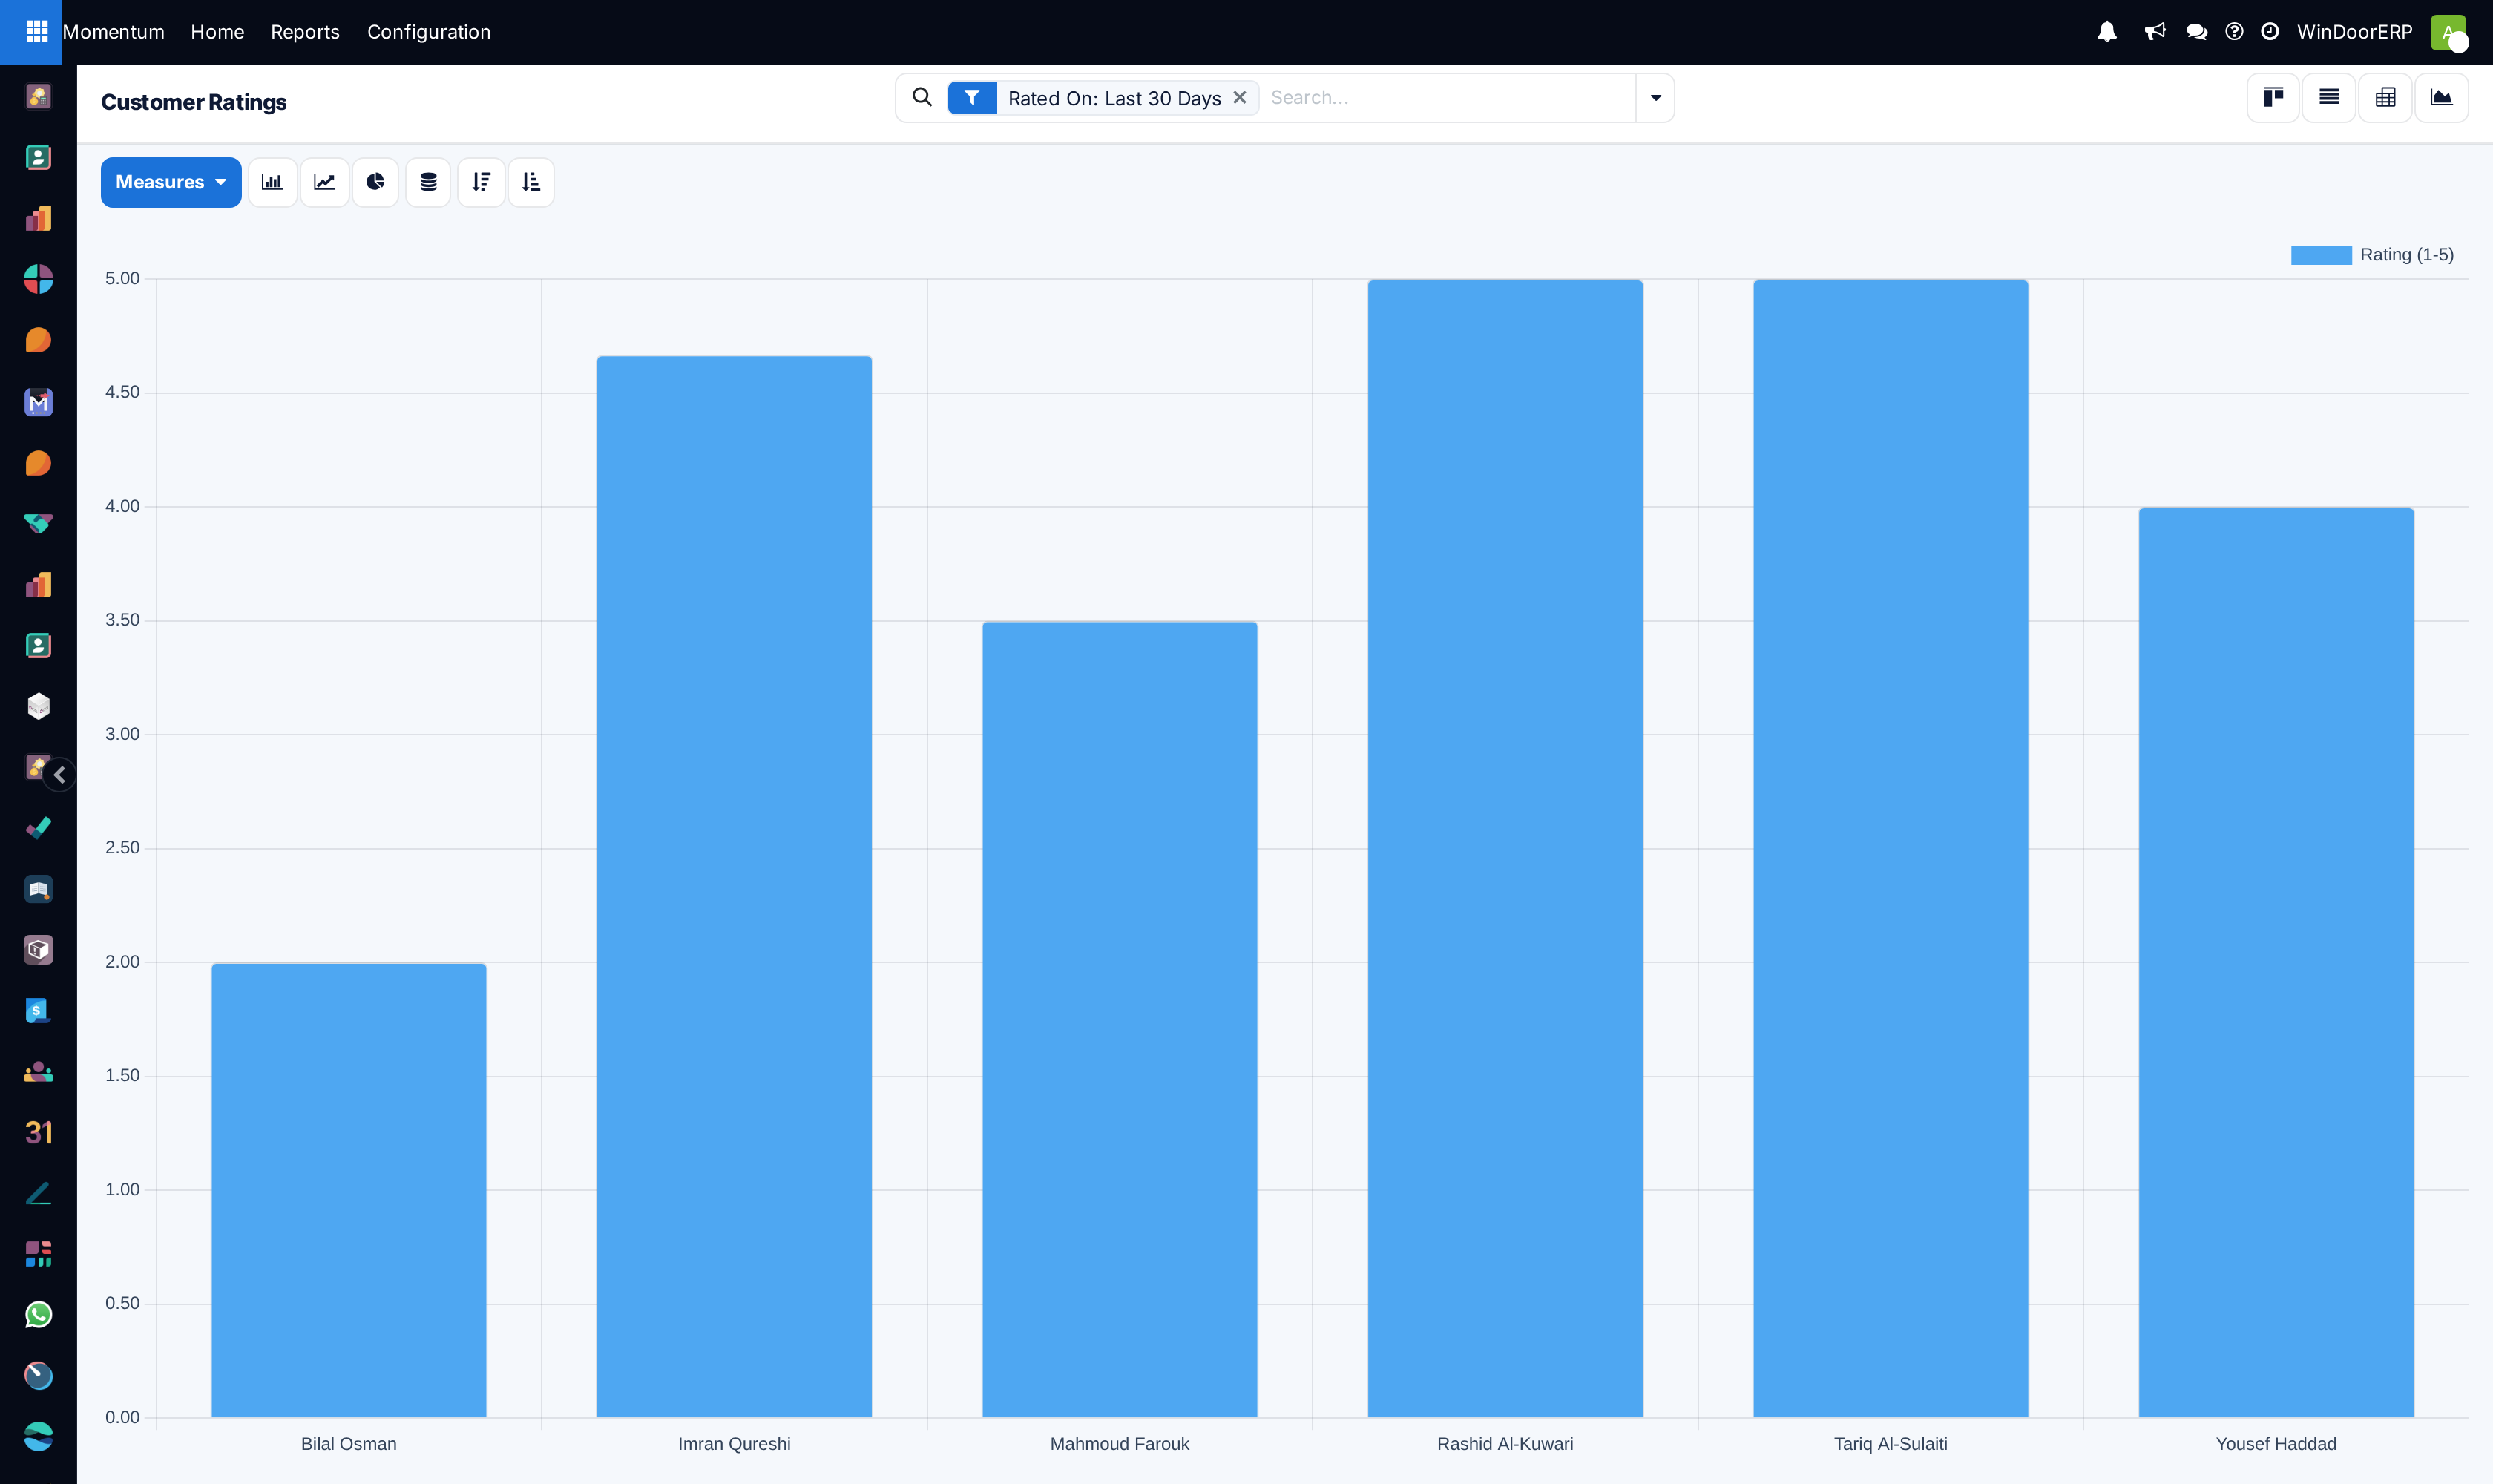
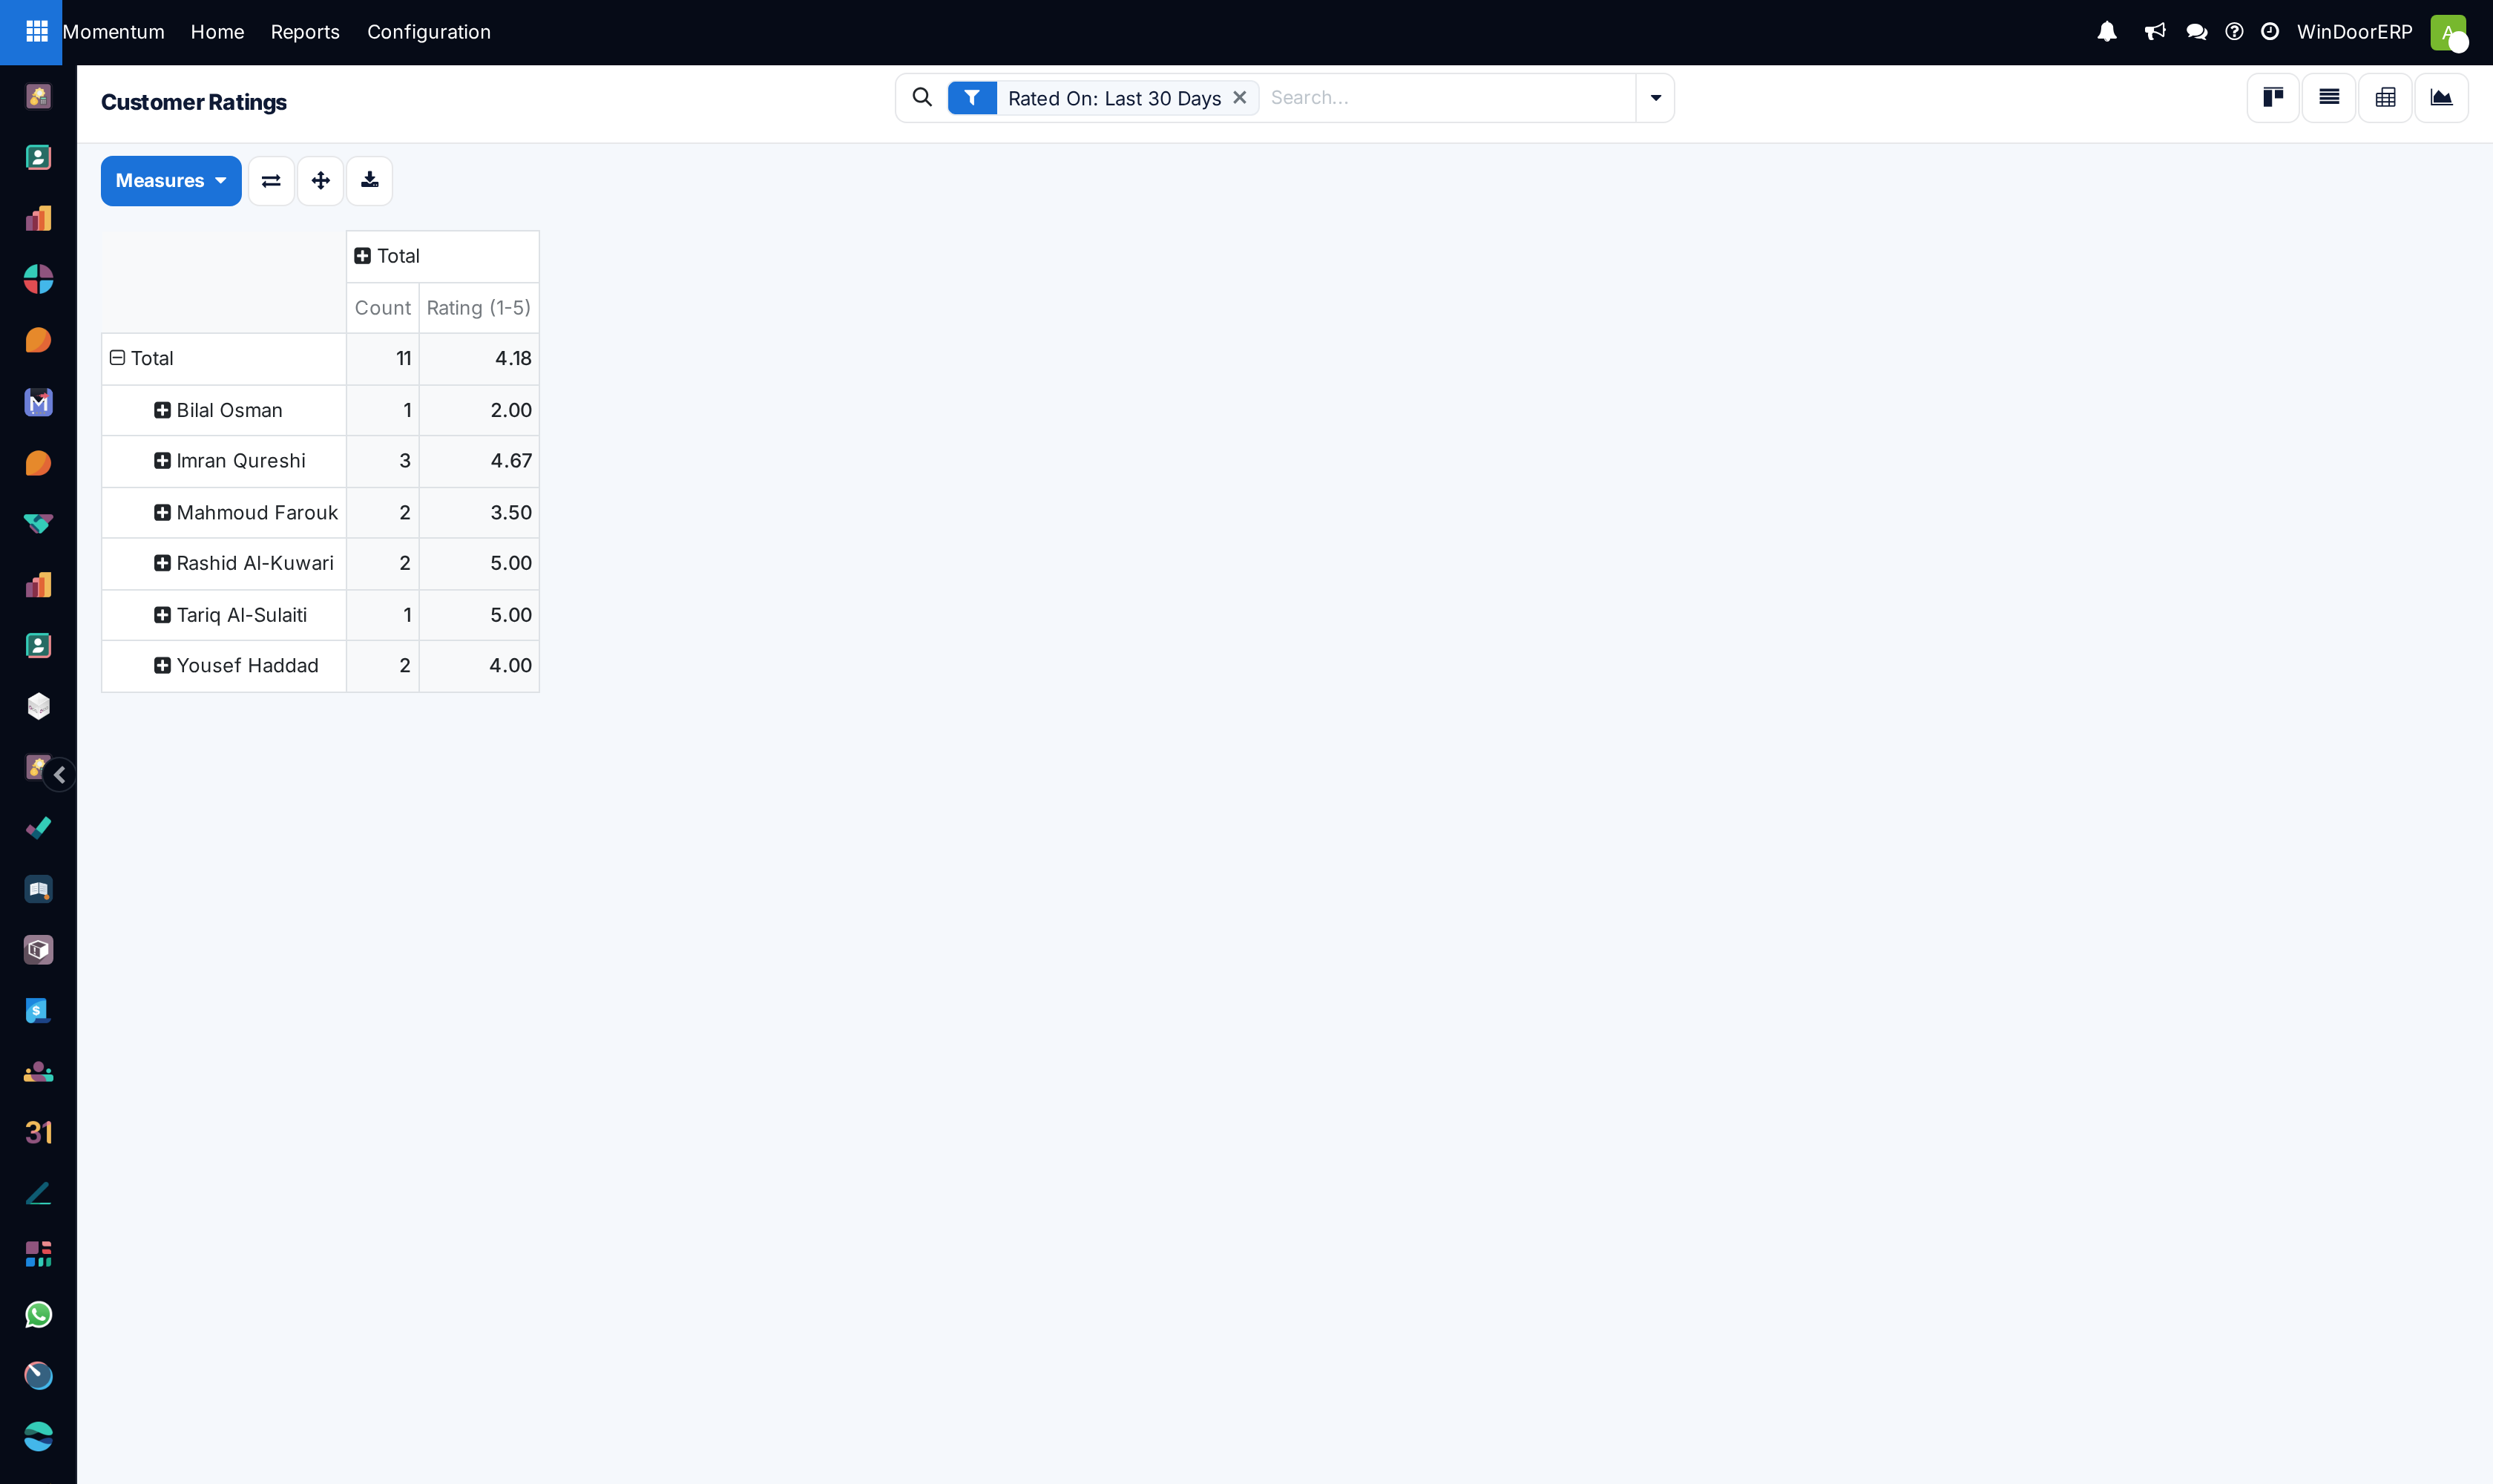
Review customer satisfaction scores across List, Kanban, Graph, and Pivot views to recognize high-performing project teams.
Common mistakes
- Reviewing task completion numbers without verifying deliverable quality acceptance.
- Ignoring negative customer ratings without initiating management follow-up calls.
Was this article helpful?
Thanks — your feedback helps.
Running a window or door factory?
Ask for a demo