Analyze quotation pipelines, stage velocity, and conversion pivot matrices
What this does
Provides visual pivot matrices and multi-dimensional graphs to track total quoted volumes, average quotation lifecycle days, and discount percentages across sales teams.
Before you start
- Sales Manager or Executive privileges.
Steps
Important
Comparing total quoted amounts against confirmed sales orders reveals conversion efficiency by sales representative.
-
01
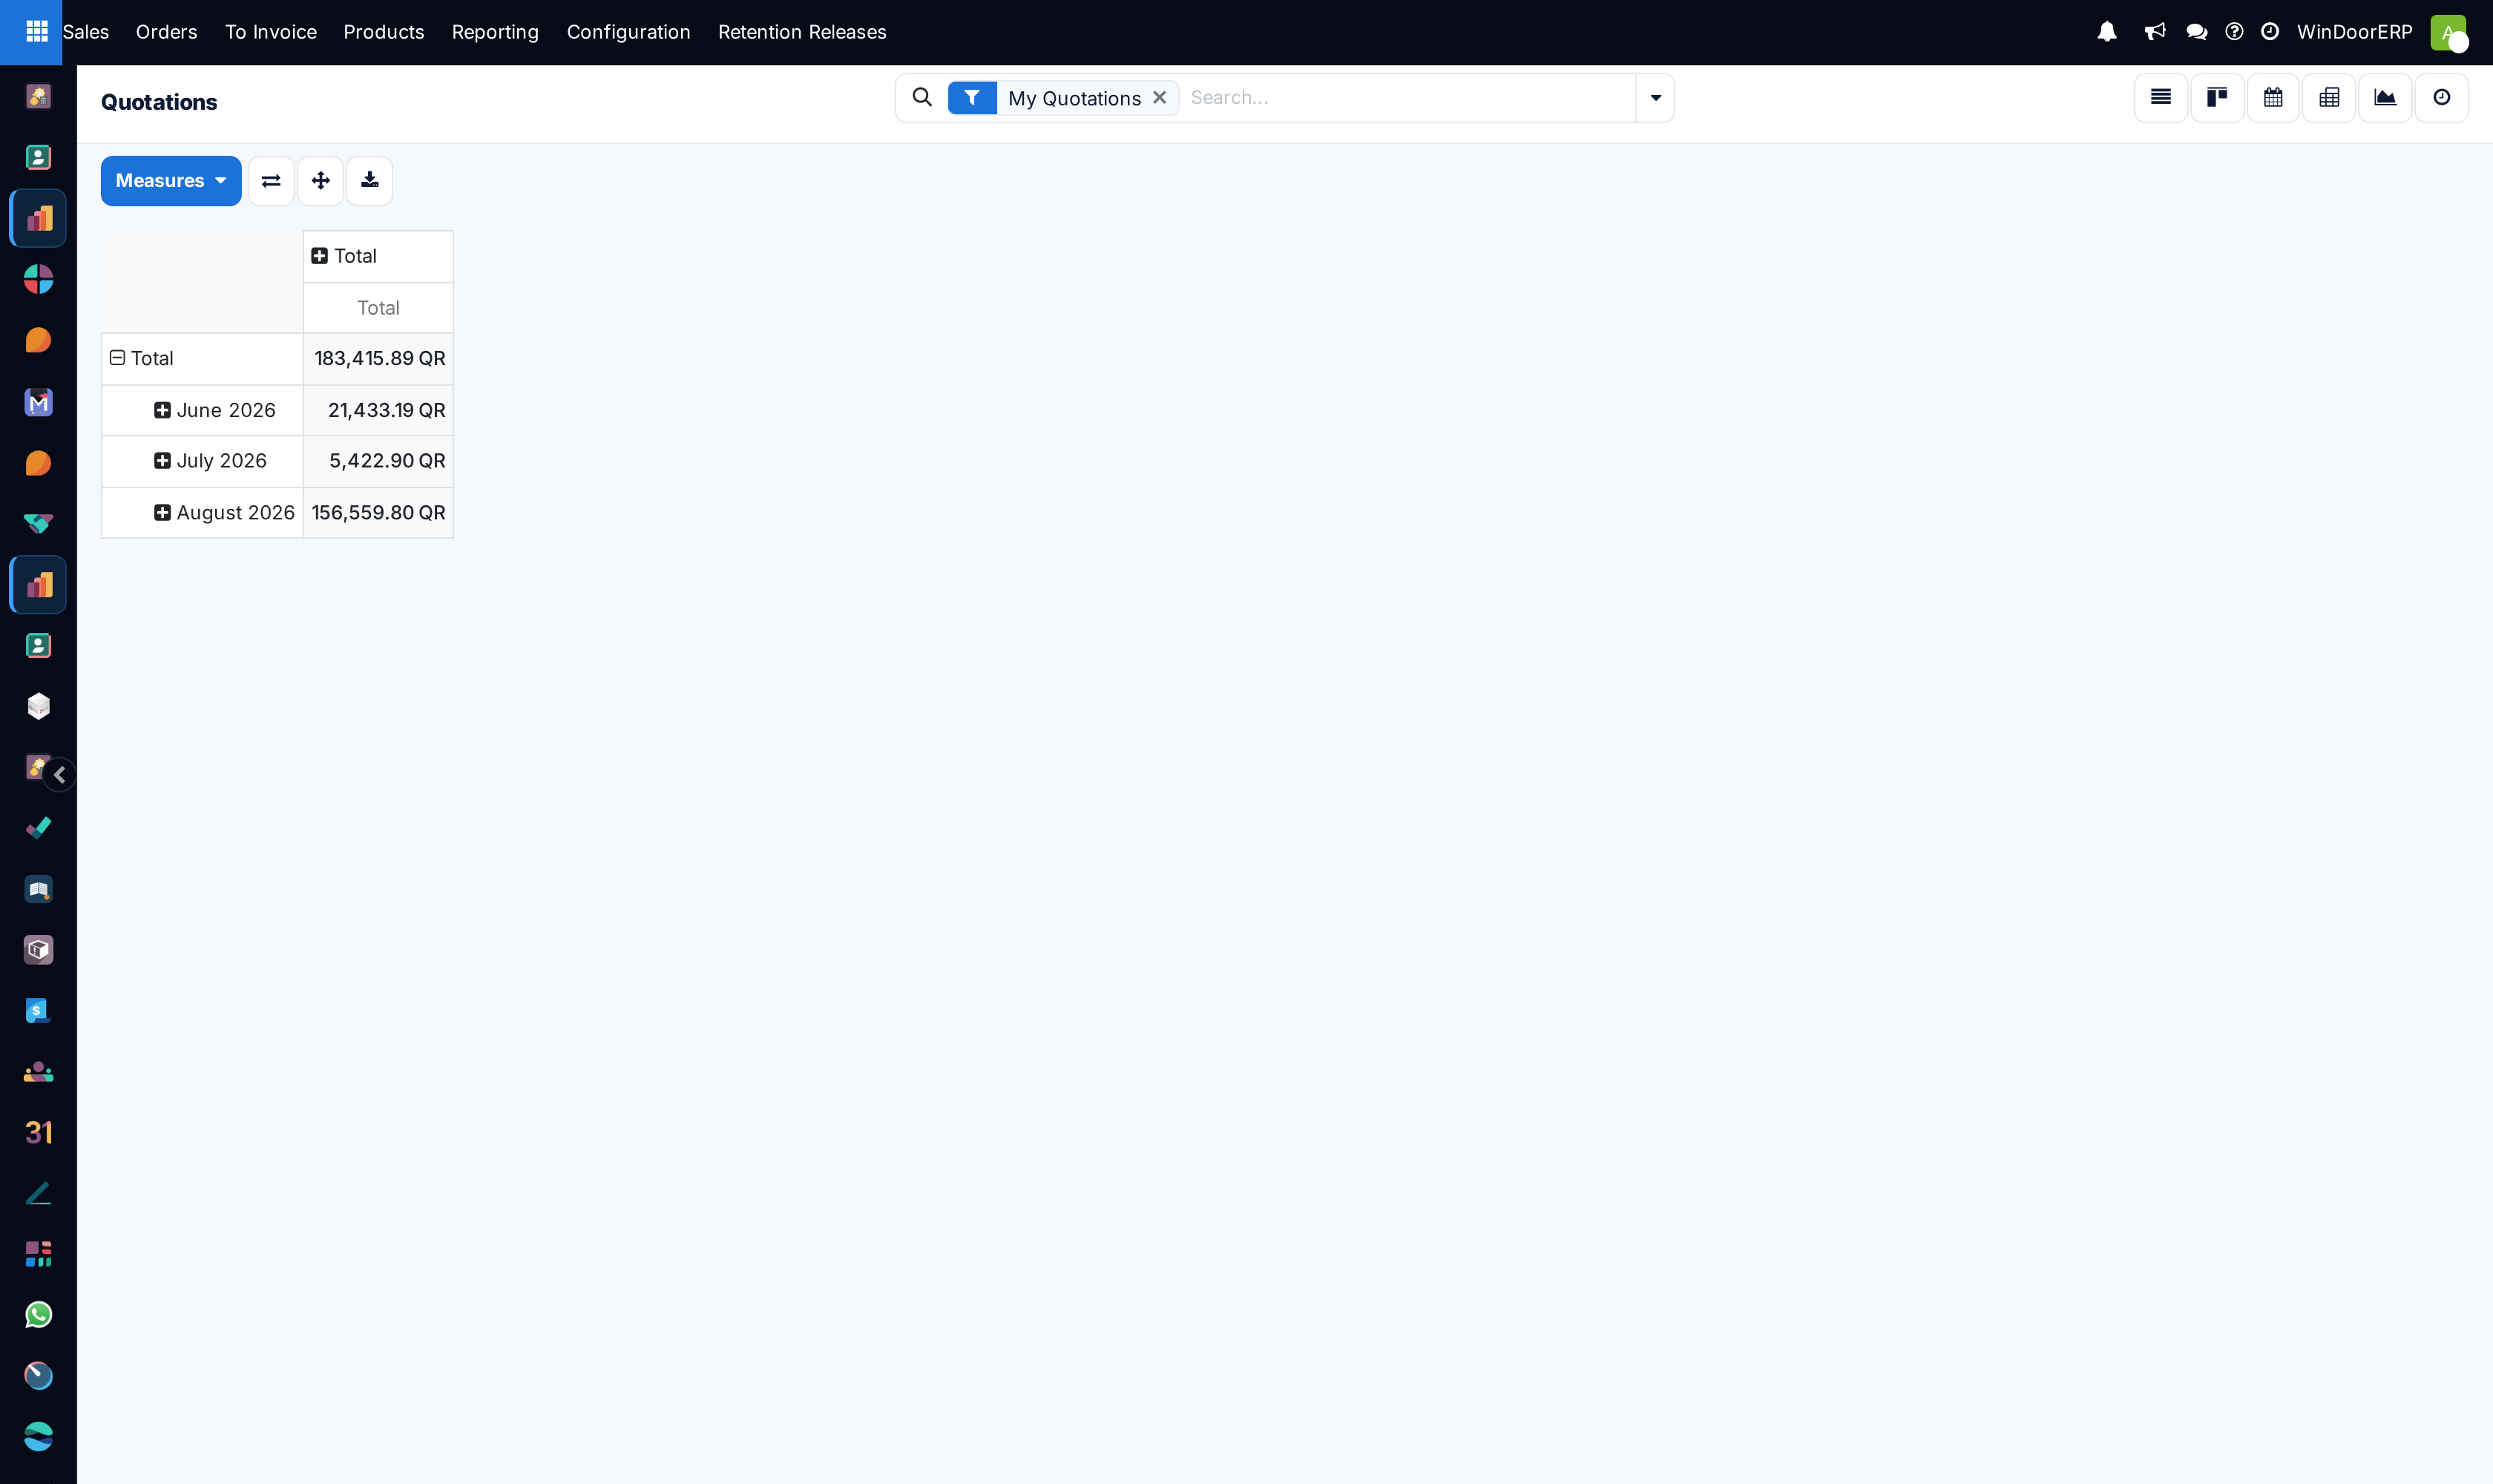
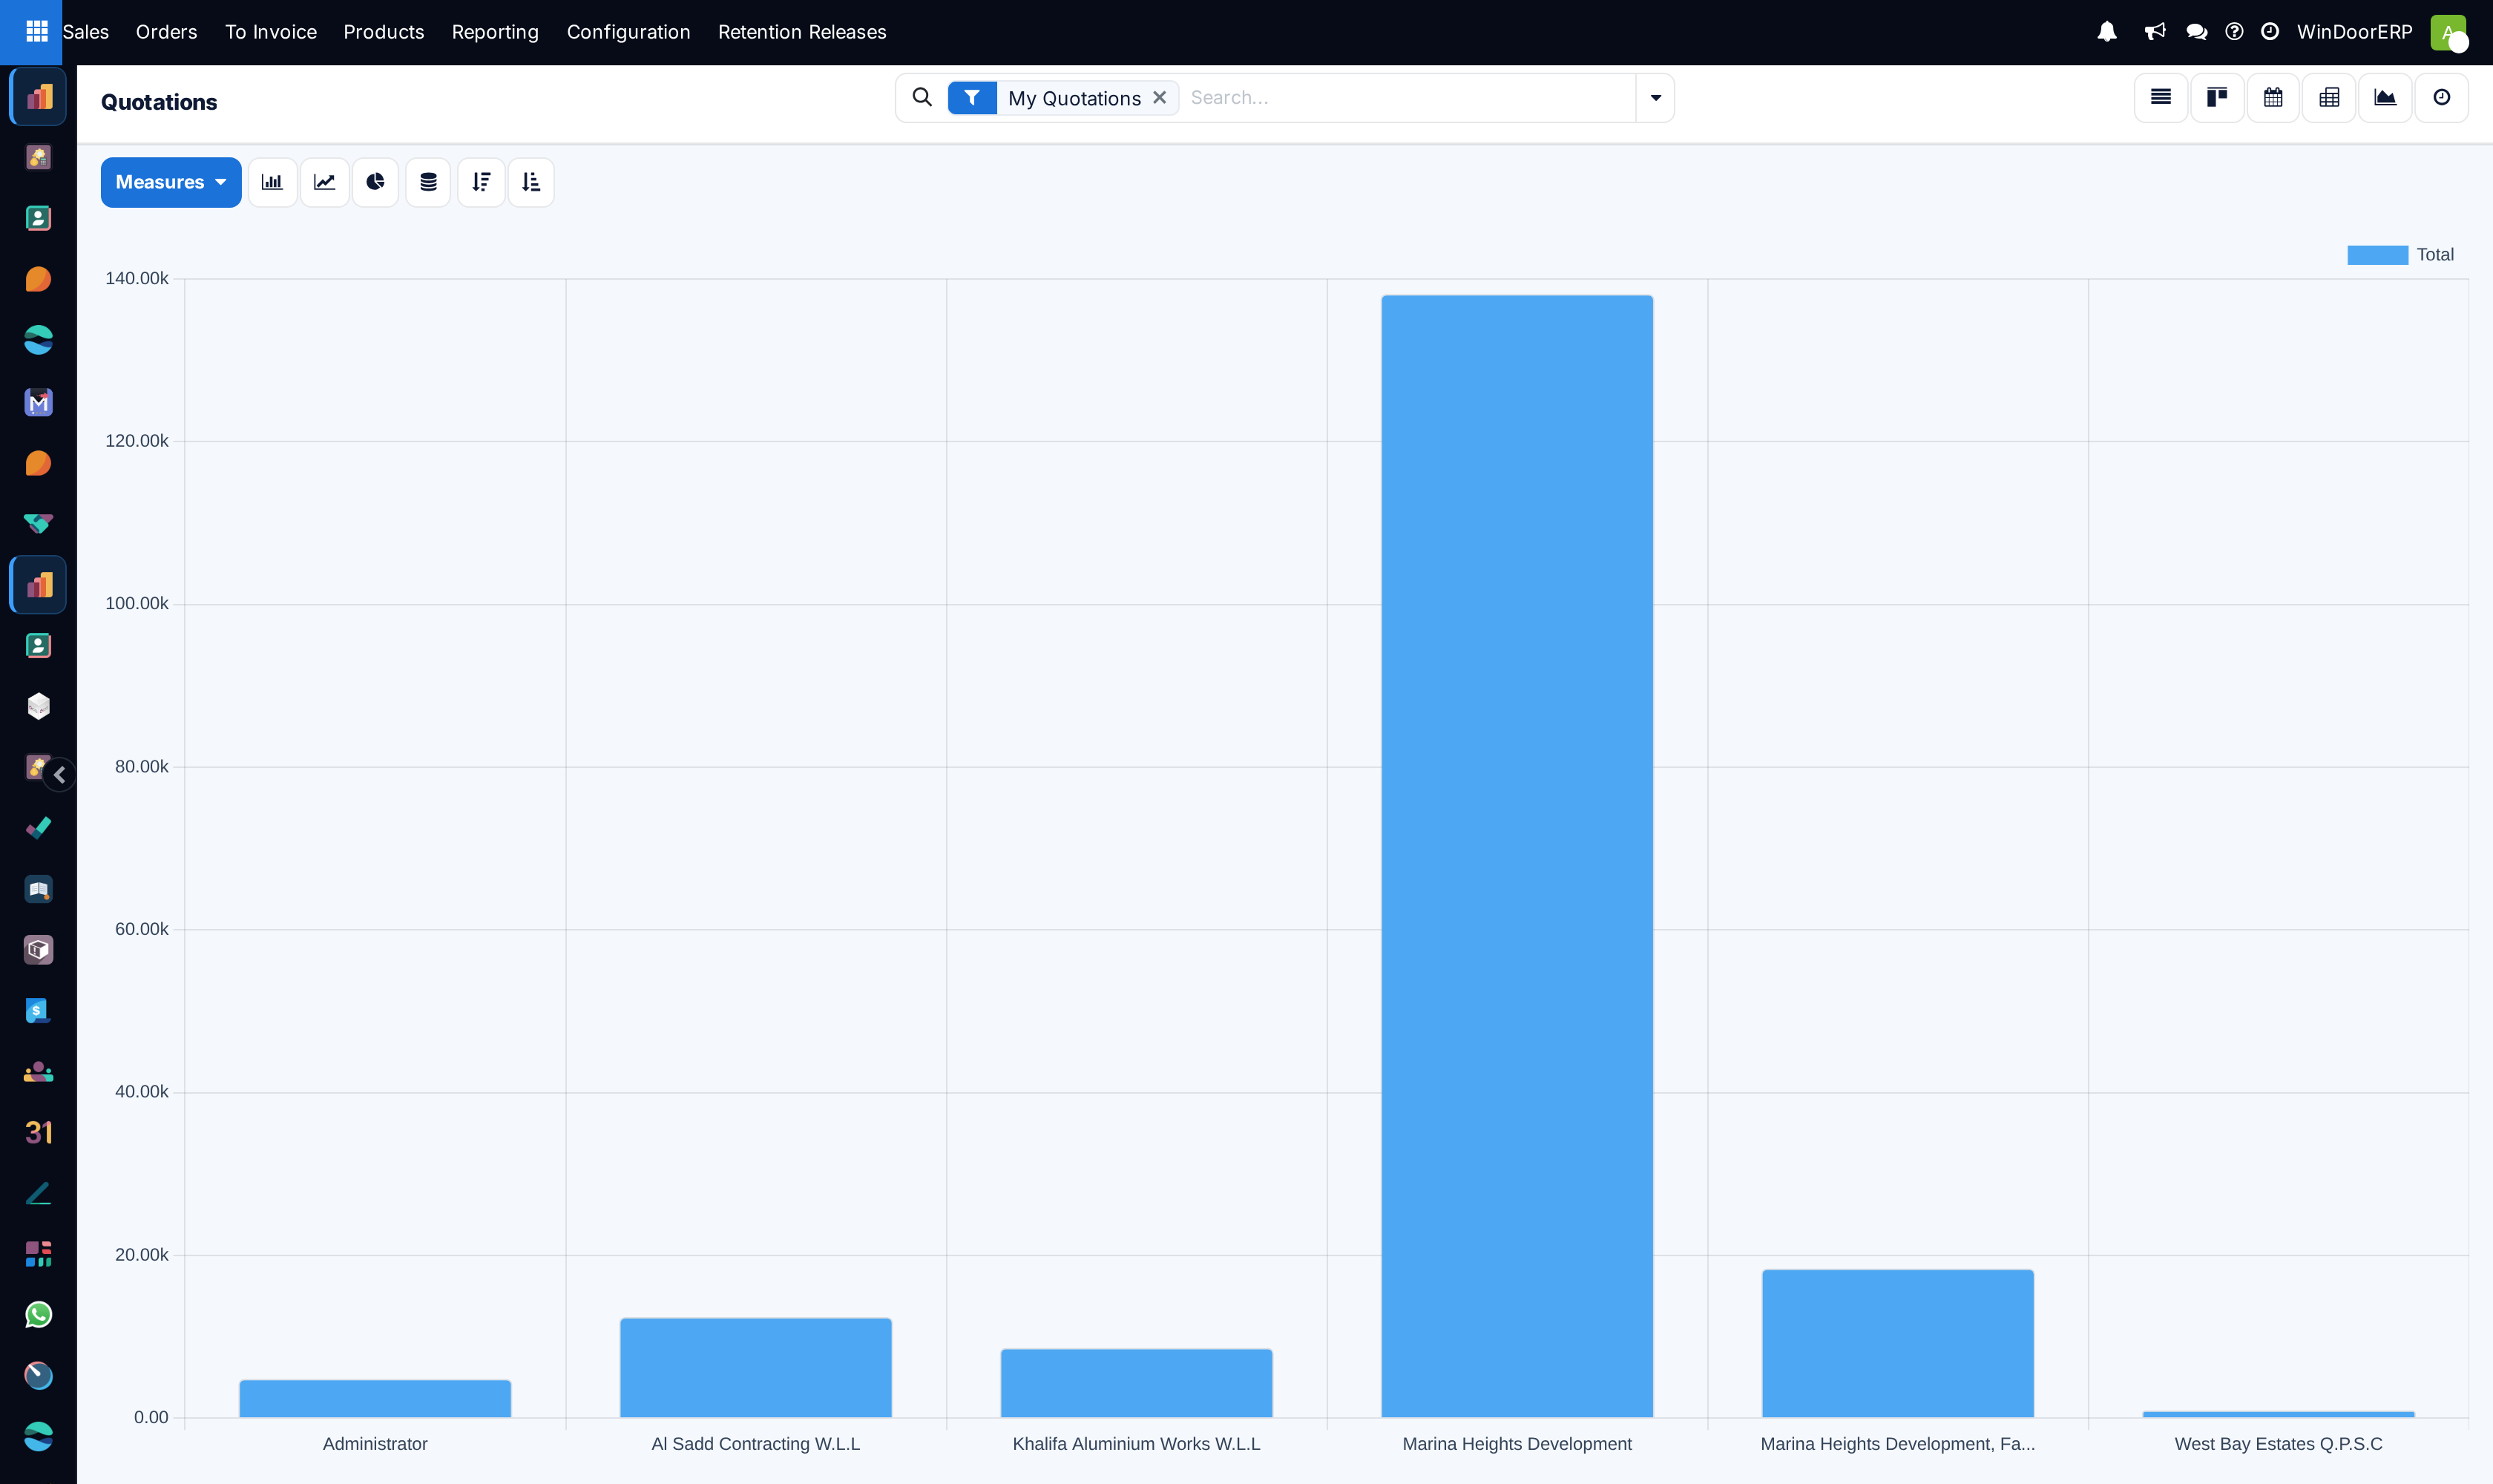
Open Sales › Orders › Quotations and switch to the Pivot or Graph view.
-
02
Select Measures: analyze Total Untaxed, Margin, and Count.
-
03
Group rows by Sales Team or Salesperson.
-
04
Group columns by Creation Date › Month to identify seasonal quotation spikes.
Common mistakes
- Focusing solely on quoted volume rather than actual gross margin profitability.
- Overlooking dormant draft quotations that skew conversion timelines.
Was this article helpful?
Thanks — your feedback helps.
Running a window or door factory?
Ask for a demo