Monitor site installation KPIs, team velocity, and project milestones
What this does
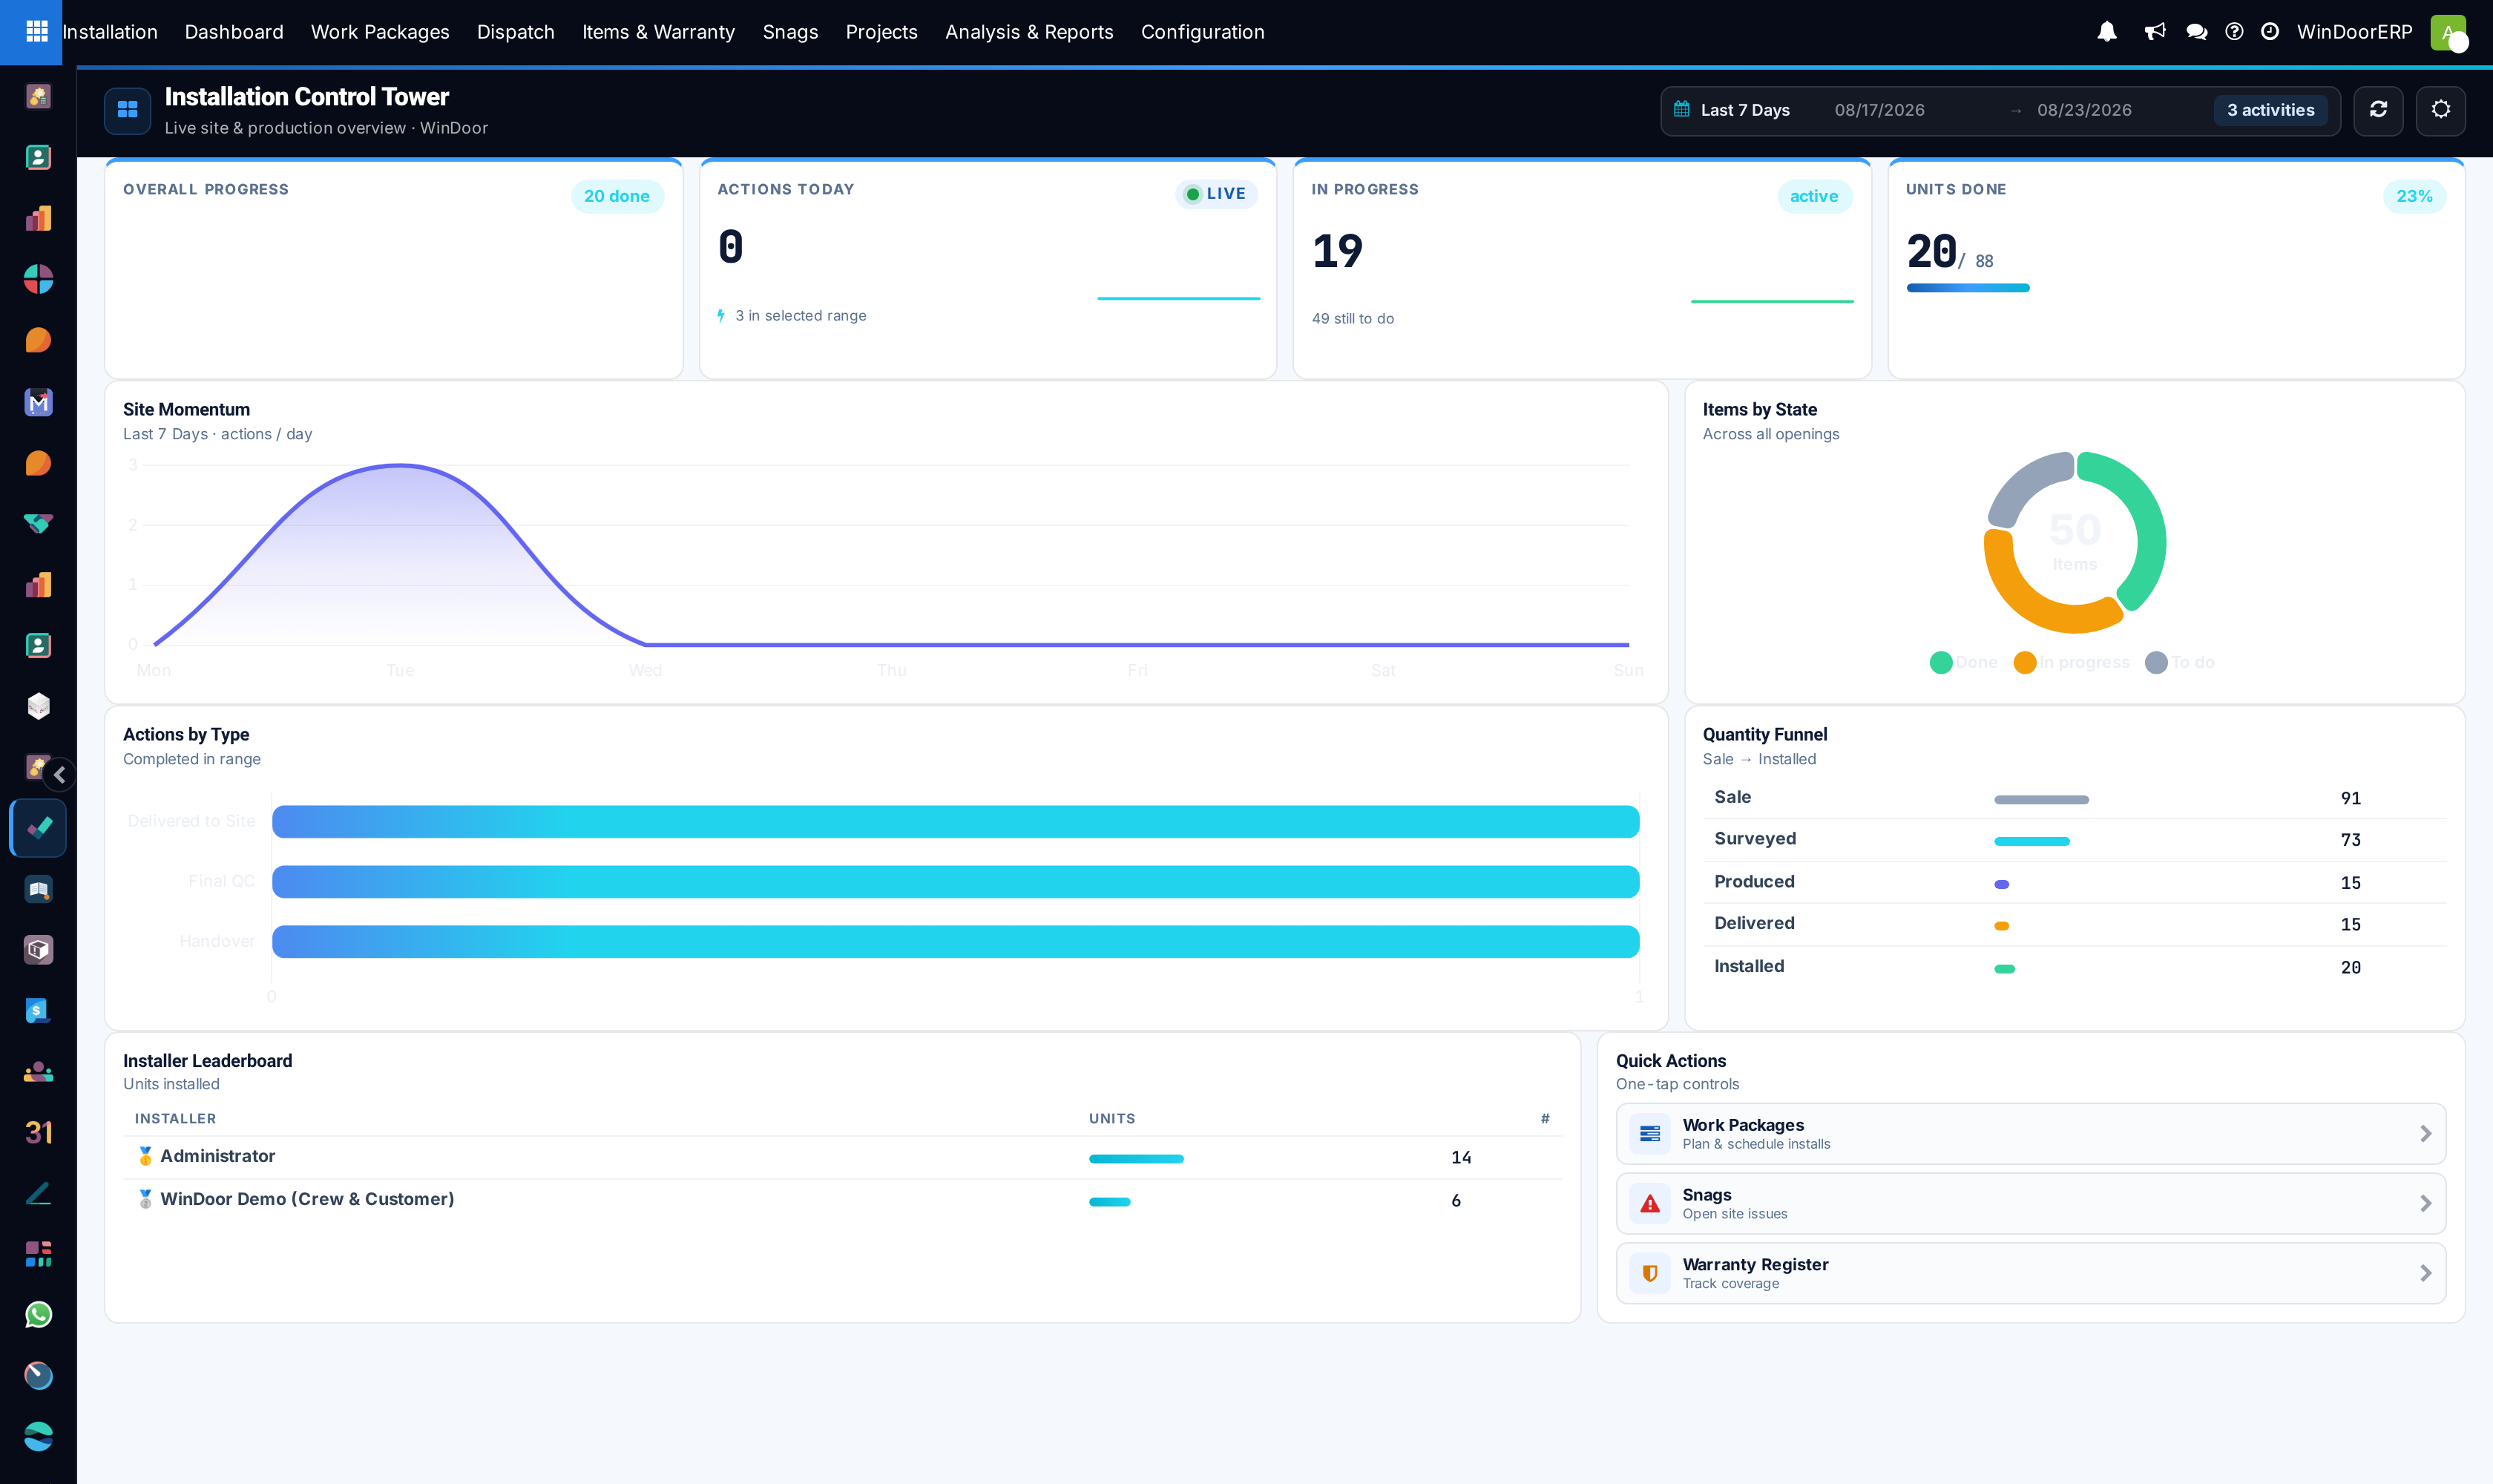
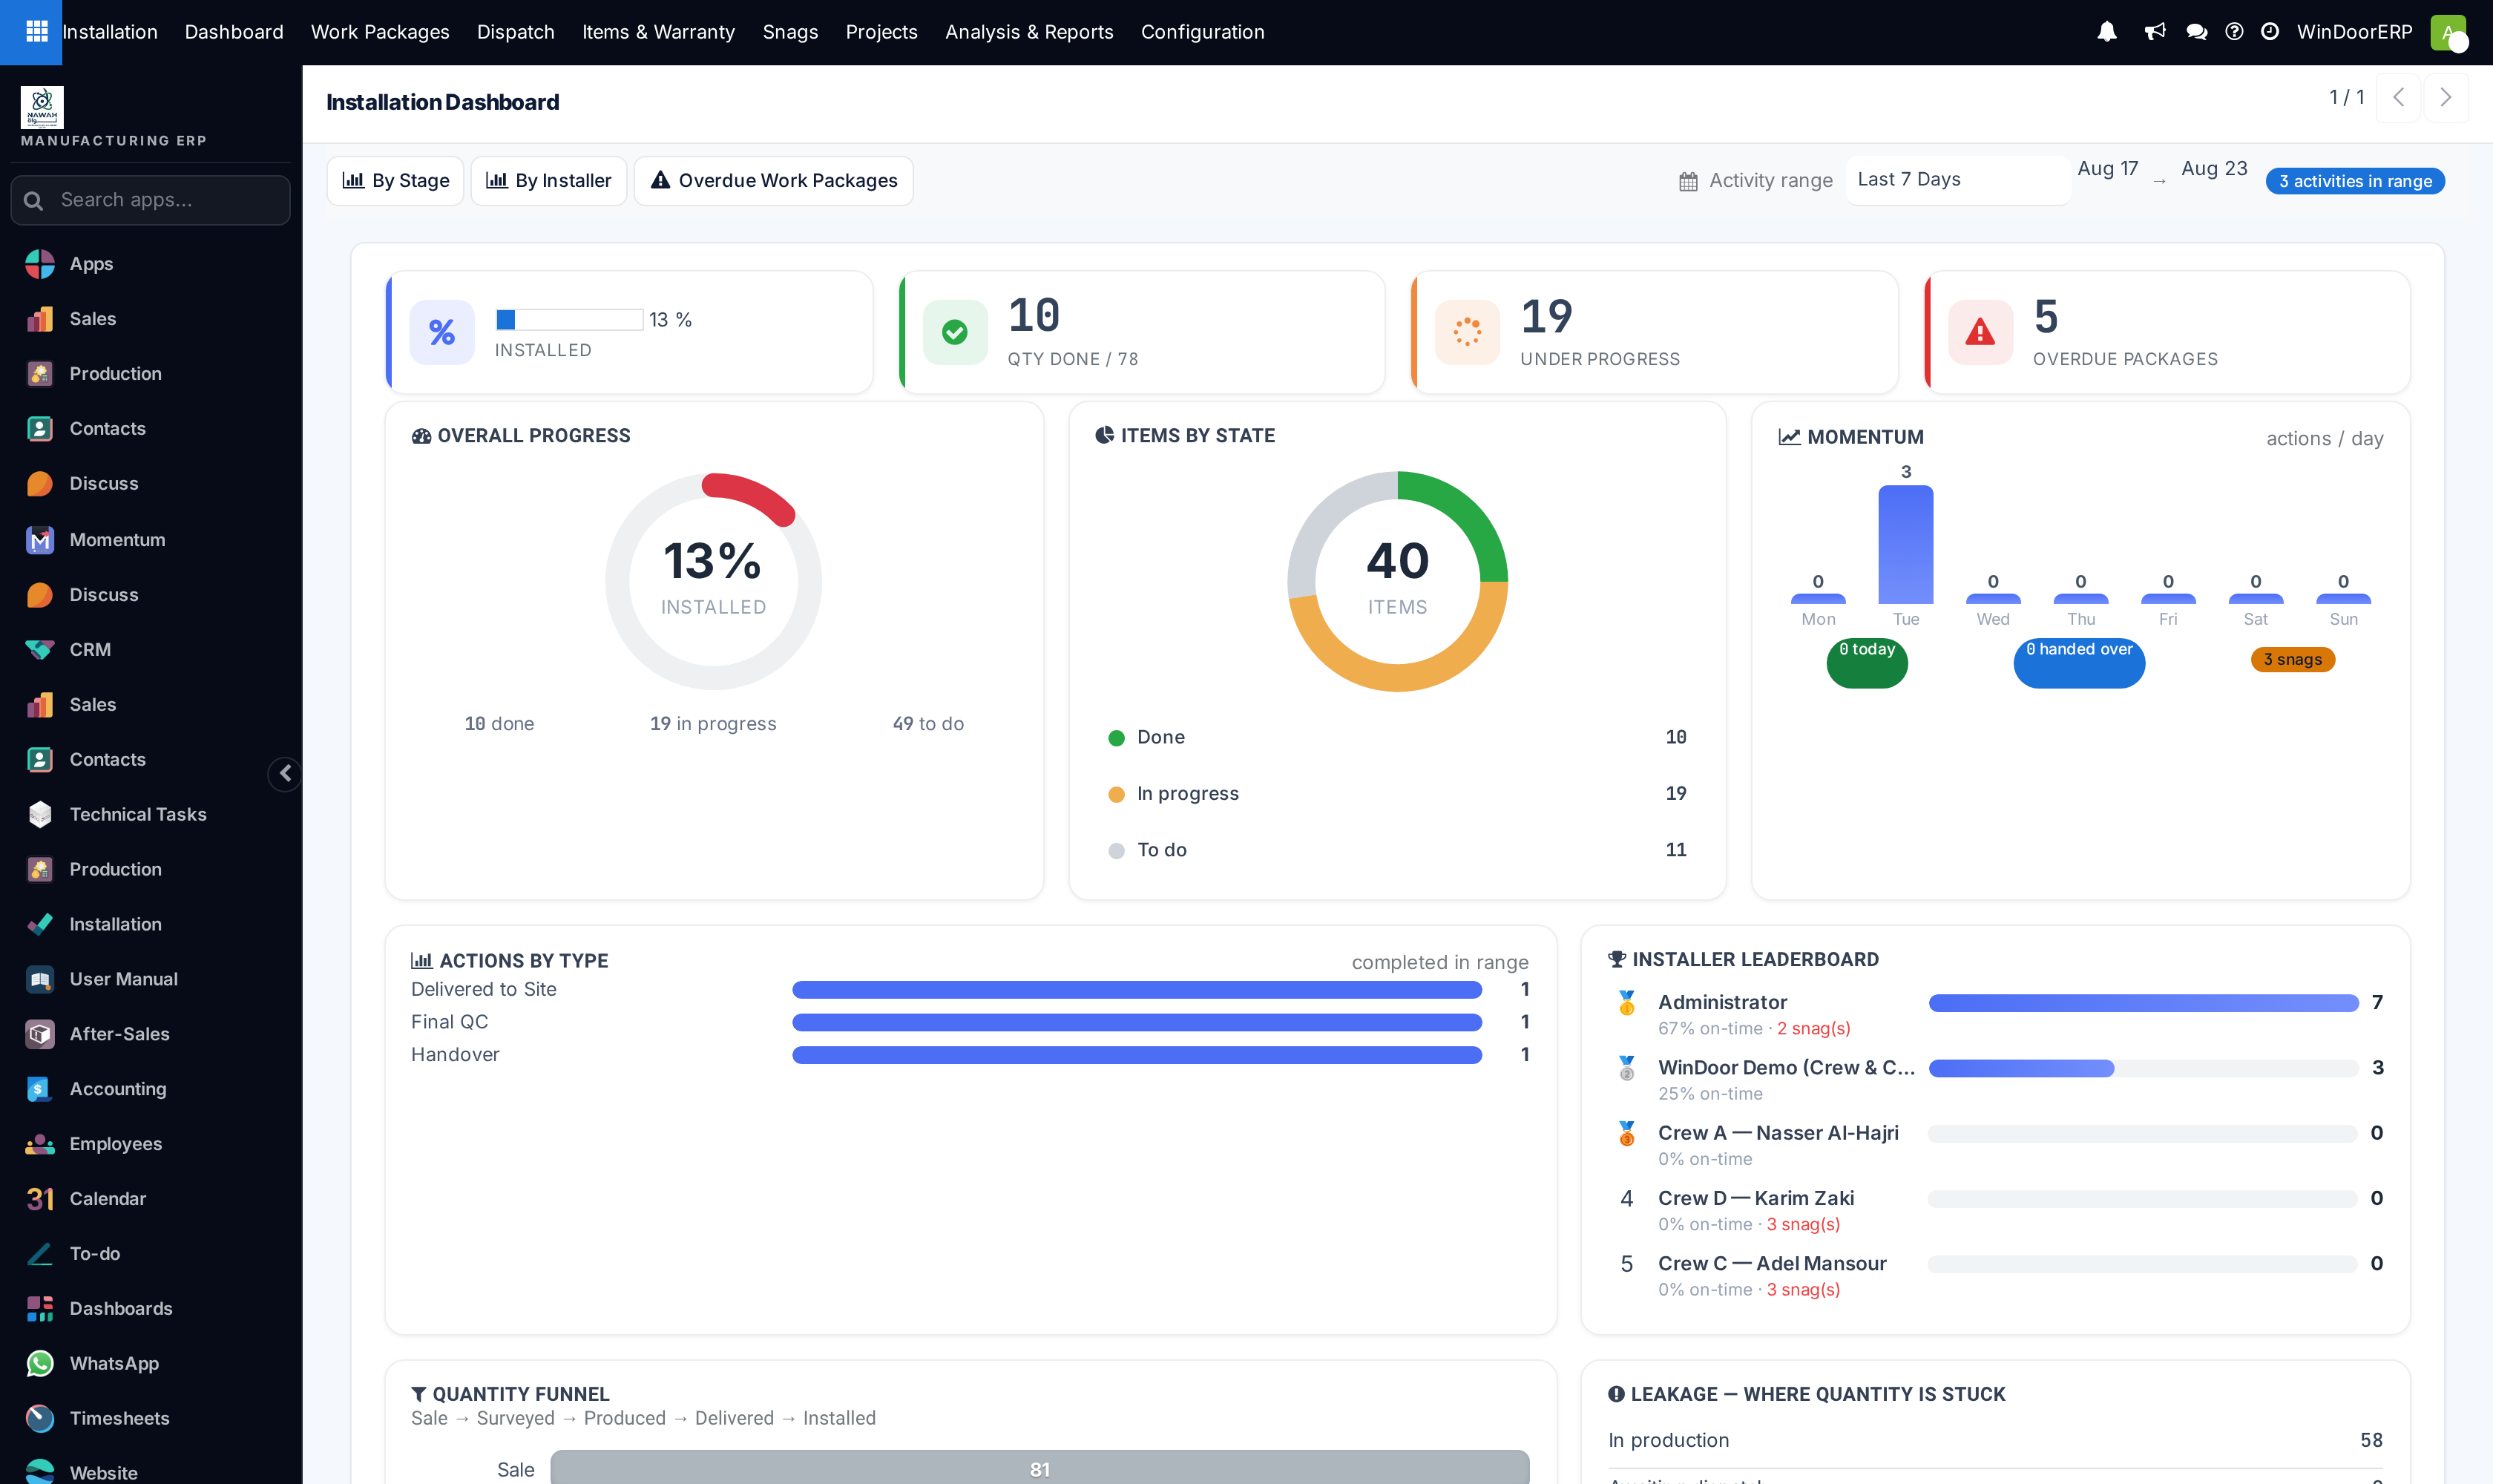
Visualizes live job-site installation velocity, daily window glazing throughput, open customer snag items, and assigned mobile installation team capacity.
Before you start
- Site survey and manufacturing orders released for installation.
Steps
Important
Daily morning review of dashboard open snag counts prevents minor site adjustment issues from delaying final contract retention milestone payments.
-
01
Open Installation › Dashboard (or Classic Dashboard) to inspect live field operations.
-
02
Review key metric cards: Total Openings Scheduled, Site Handover Rate, Pending First-Pass QC, and Active Snags.
-
03
Filter by Project or Territory (e.g. North Region Villas, Commercial Towers) to evaluate regional field crew velocity.
Common mistakes
- Closing project cards on the dashboard before receiving signed site handover certificates.
- Ignoring red crew capacity warnings during multi-villa project delivery peaks.
Was this article helpful?
Thanks — your feedback helps.
Running a window or door factory?
Ask for a demo