See what the hours bought
Read operator productivity per station
Why this step
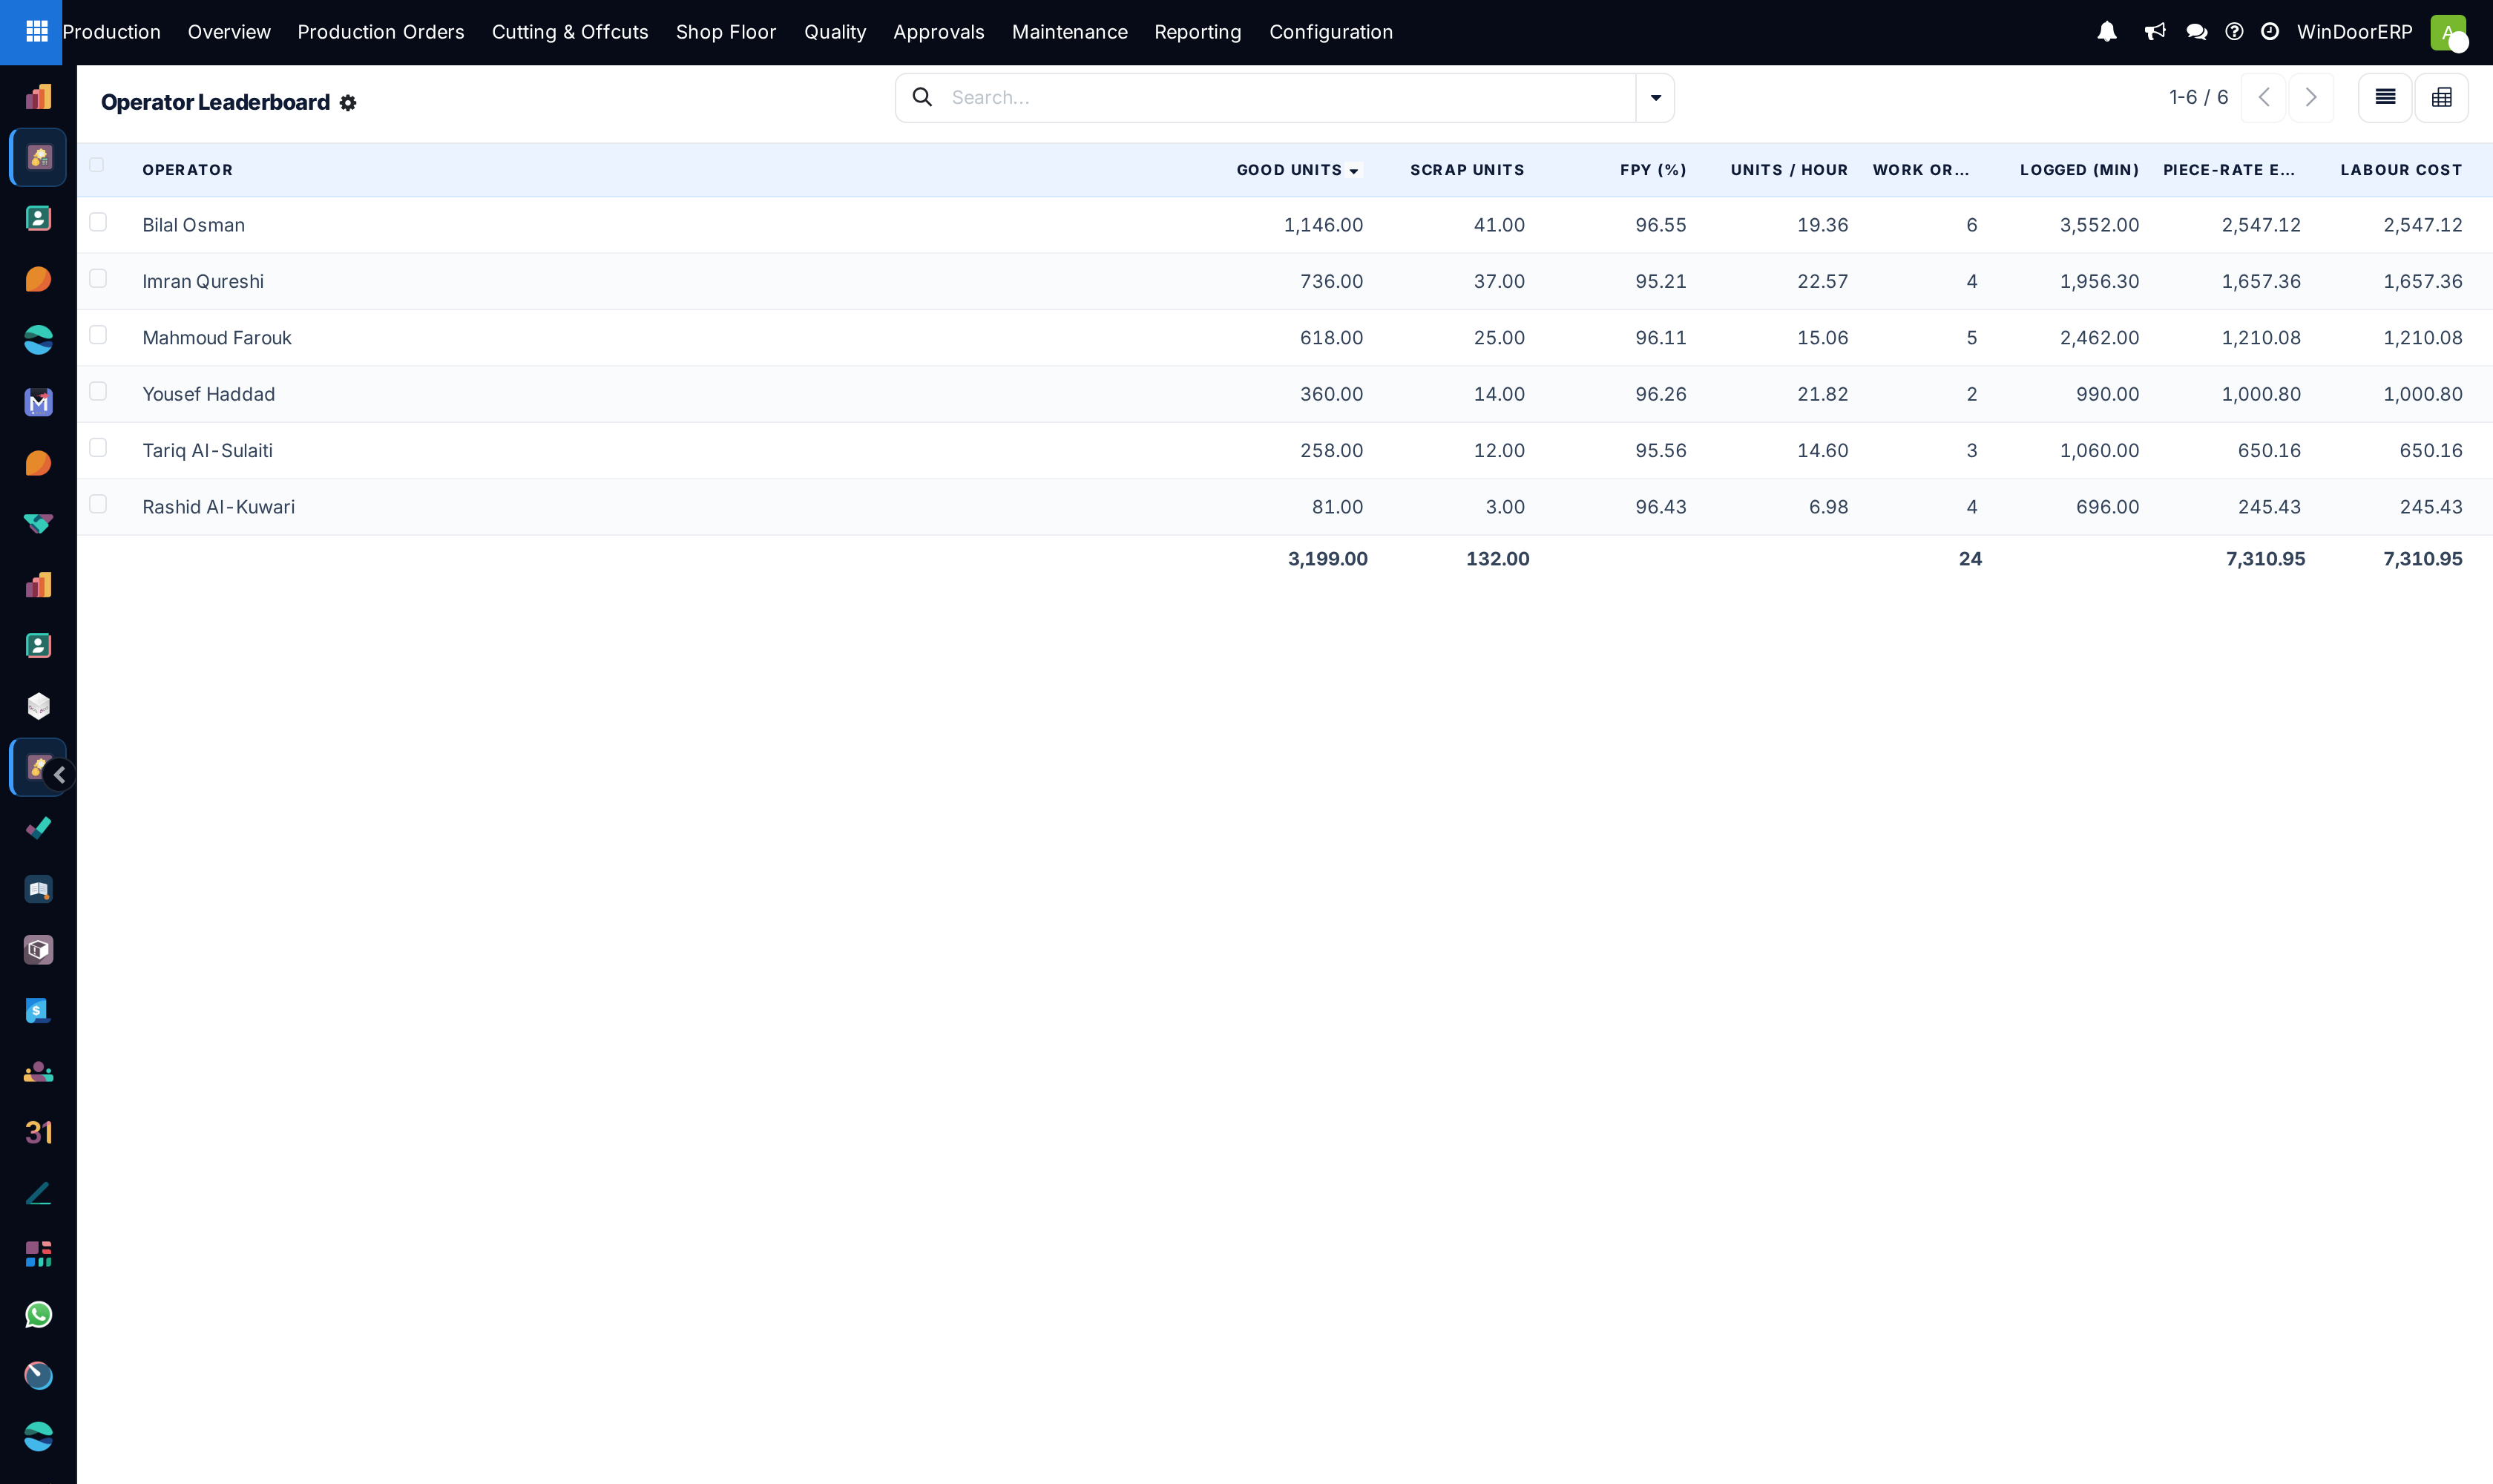
Now the hours can answer something: output per operator, per station, per shift. Read it as a diagnostic on the process, not a scoreboard on people — a slow station is usually a setup problem, not a lazy one.
What this does
Gamifies shop floor performance by ranking technicians by units produced, standard-to-actual time efficiency, and first-time quality pass rates.
Before you start
- Live work order completion logs registered through terminals.
Steps

Important
Evaluate operator leaderboard metrics alongside Quality Non-Conformance (NCR) reports to prevent technicians rushing through assembly at the expense of corner sealant quality.
-
01
Open Production › Shop Floor › Operator Leaderboard.
-
02
Review weekly and monthly operator rankings across fabrication departments (Cutting, Assembly, Glazing).
-
03
Switch to the Pivot view to analyze individual technician output across various window opening systems.
-
04
Identify top performers for monthly incentive bonuses and pinpoint technicians requiring additional skill training.
Common mistakes
- Comparing high-speed casement assembly operators directly against complex custom curtain wall fabricators.
- Failing to update leaderboard data during weekly production meetings.
Checkpoint
You can see which station consumes the most labour per finished unit, and ask why.