Watch the factory today
Standard hours against actual
Why this step
The variance between what a unit should take and what it took. This is where the timesheets from journey 10 turn into a costing you can trust, and where an under-quoted profile series announces itself.
What this does
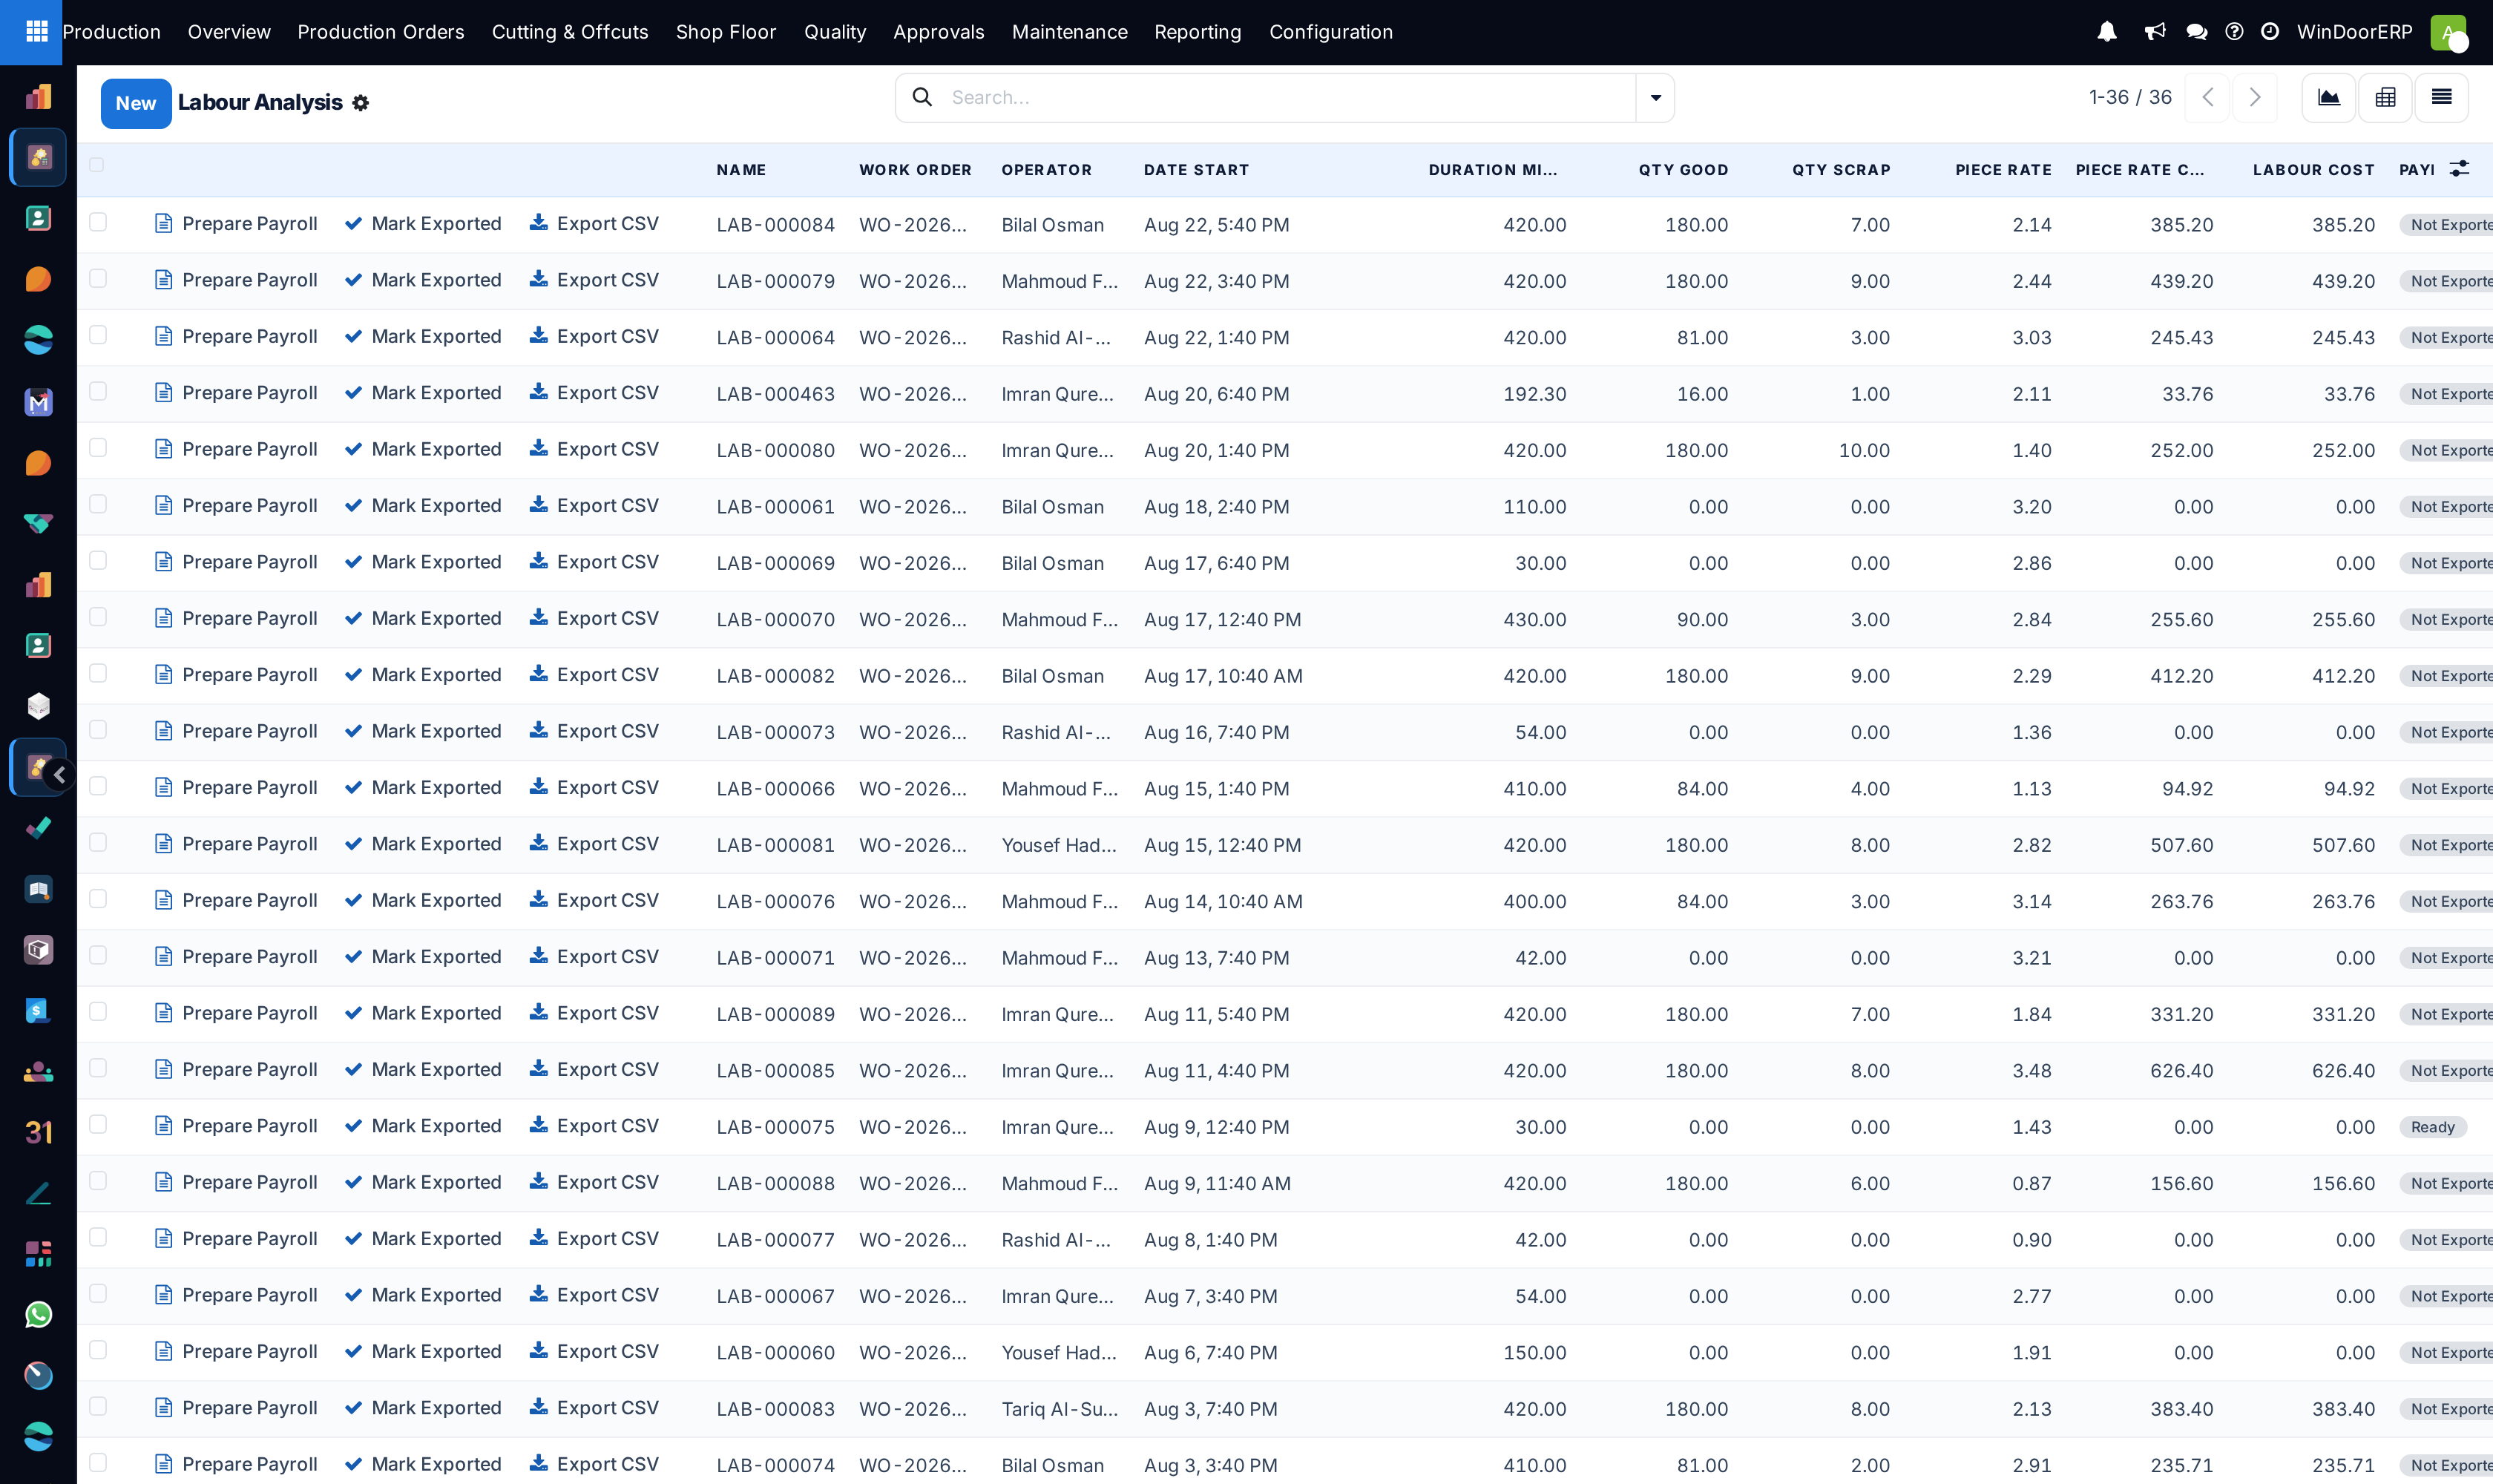
Compares planned standard fabrication routing times against logged actual operator hours, highlighting labor variances and station bottlenecks.
Before you start
- Labour logs recorded across operations.
Steps
Important
Consistent positive labor variances on corner crimping indicate skilled assembly efficiency, whereas negative variances on glazing indicate sealant handling delays.
-
01
Navigate to Production › Reporting › Labour.
-
02
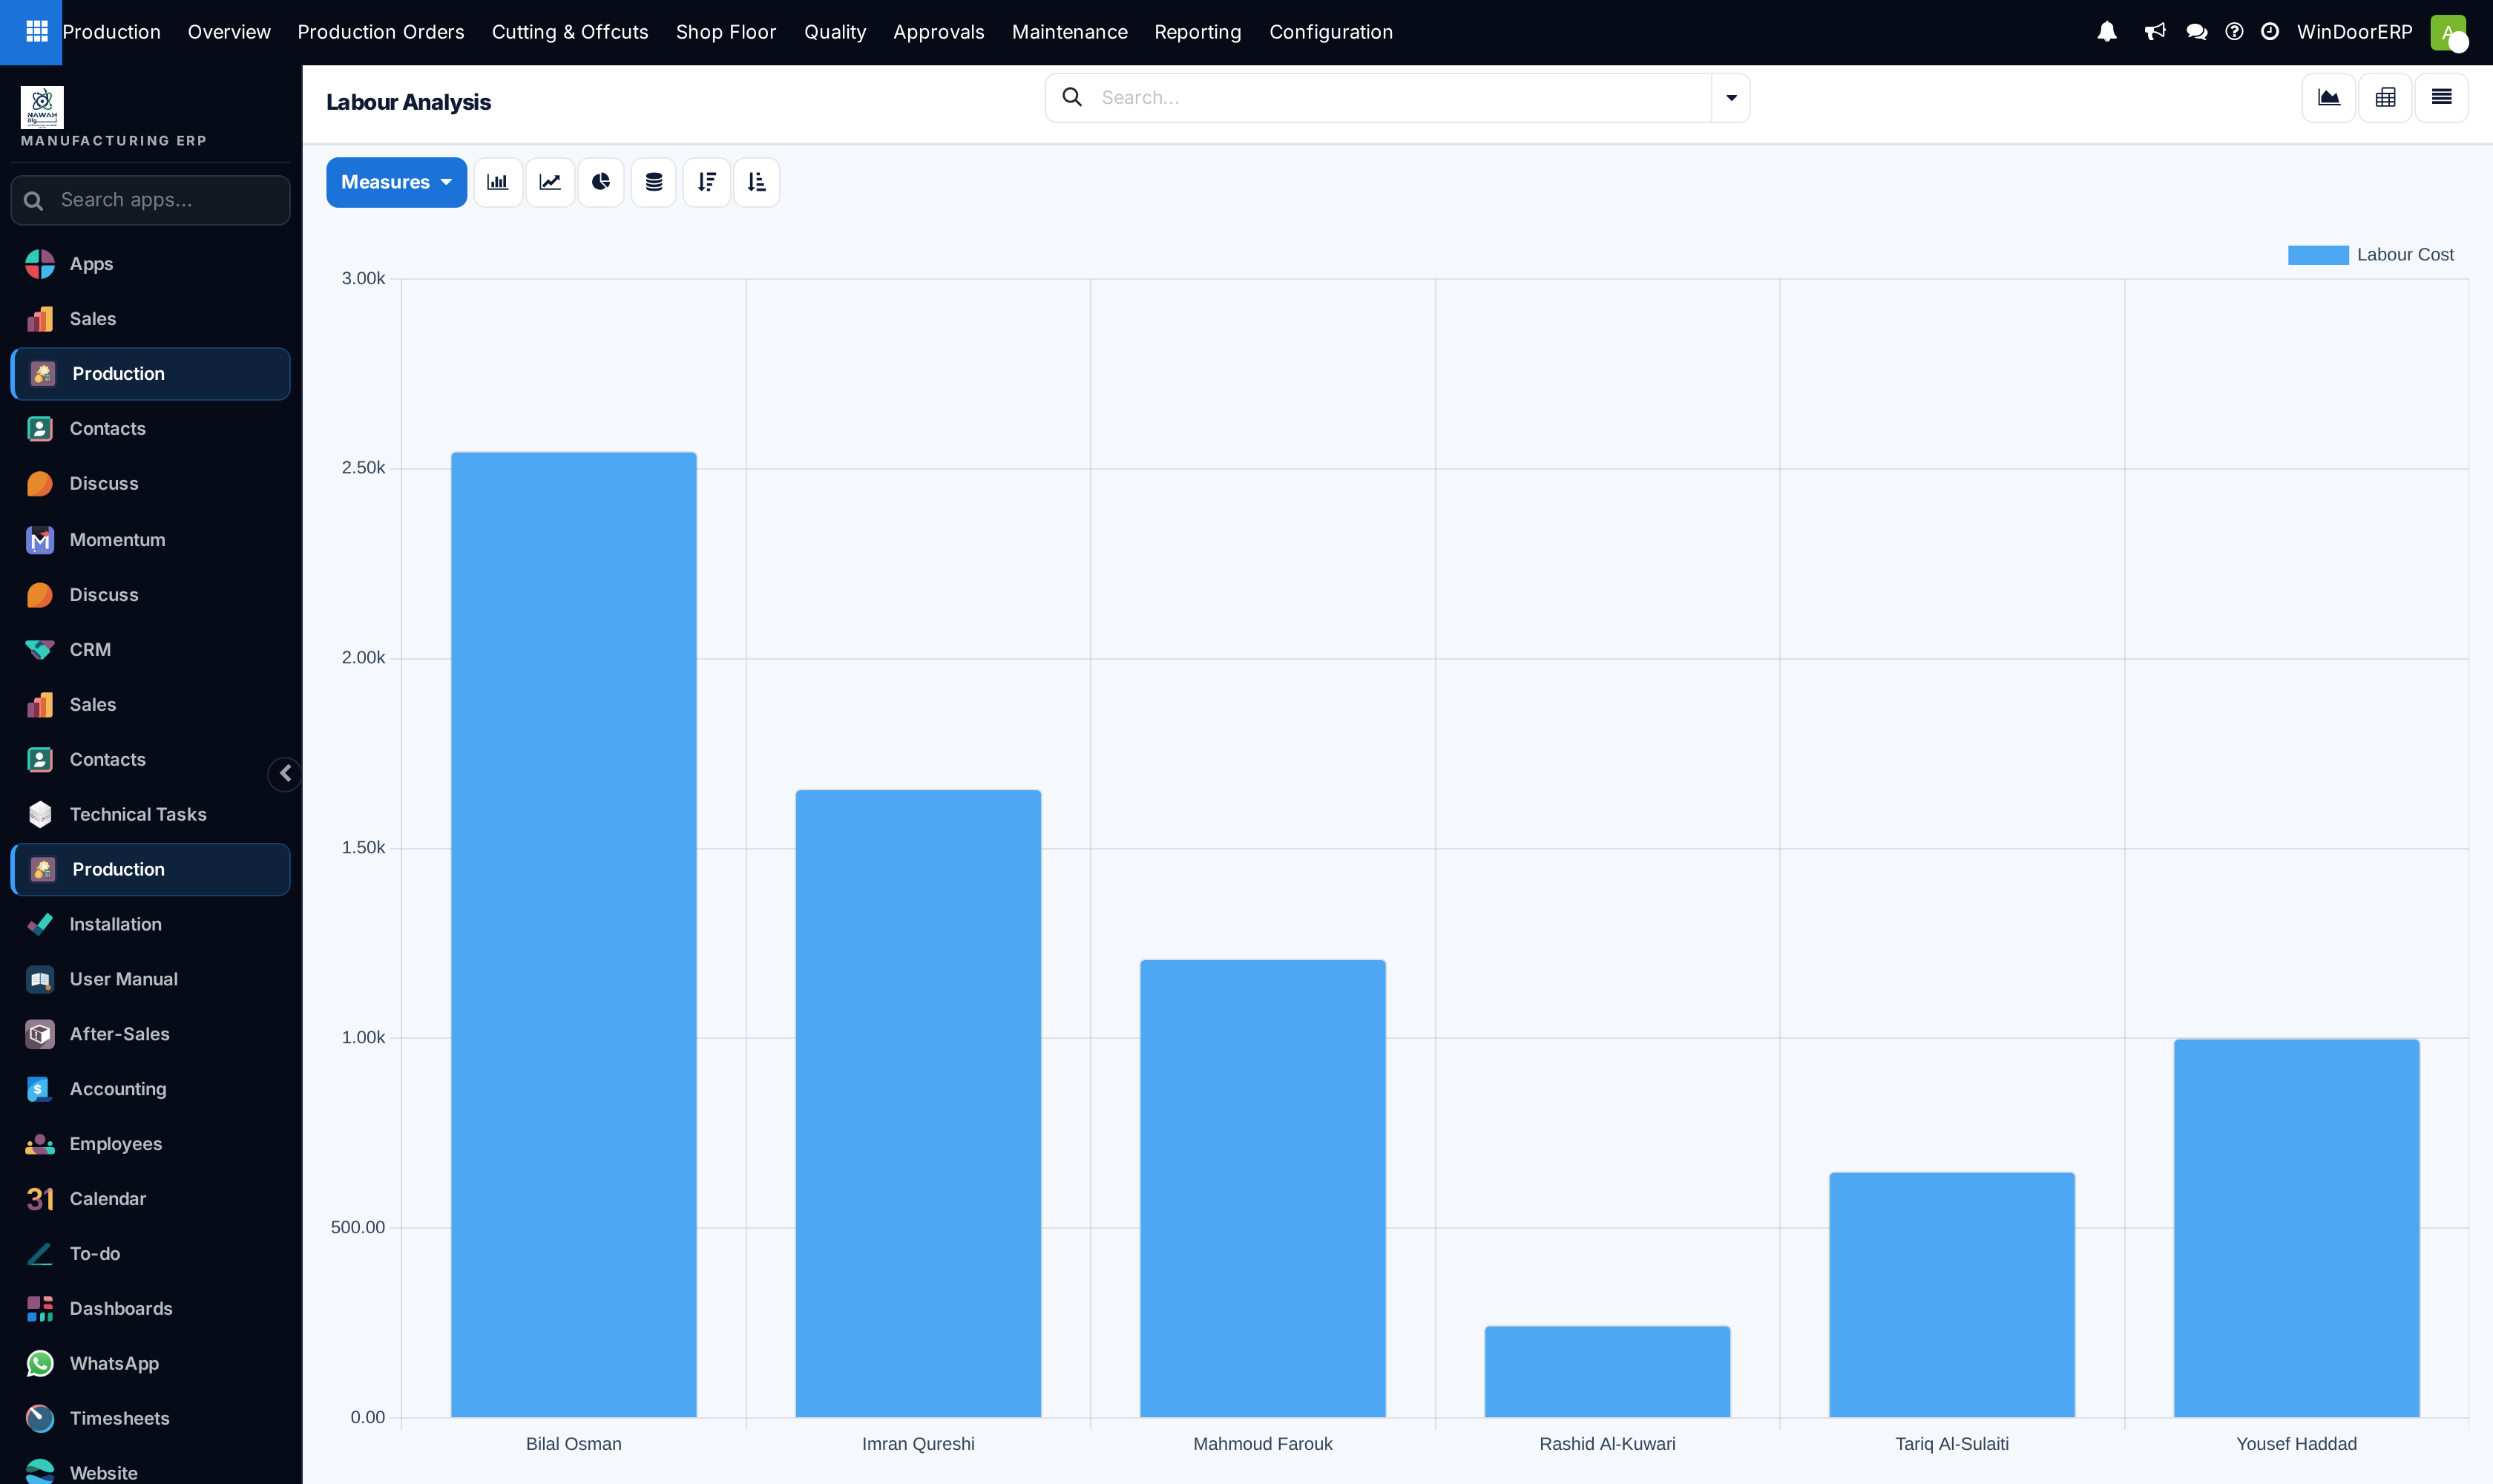
Review the graphical comparison of planned versus actual duration across work centers.
-
03
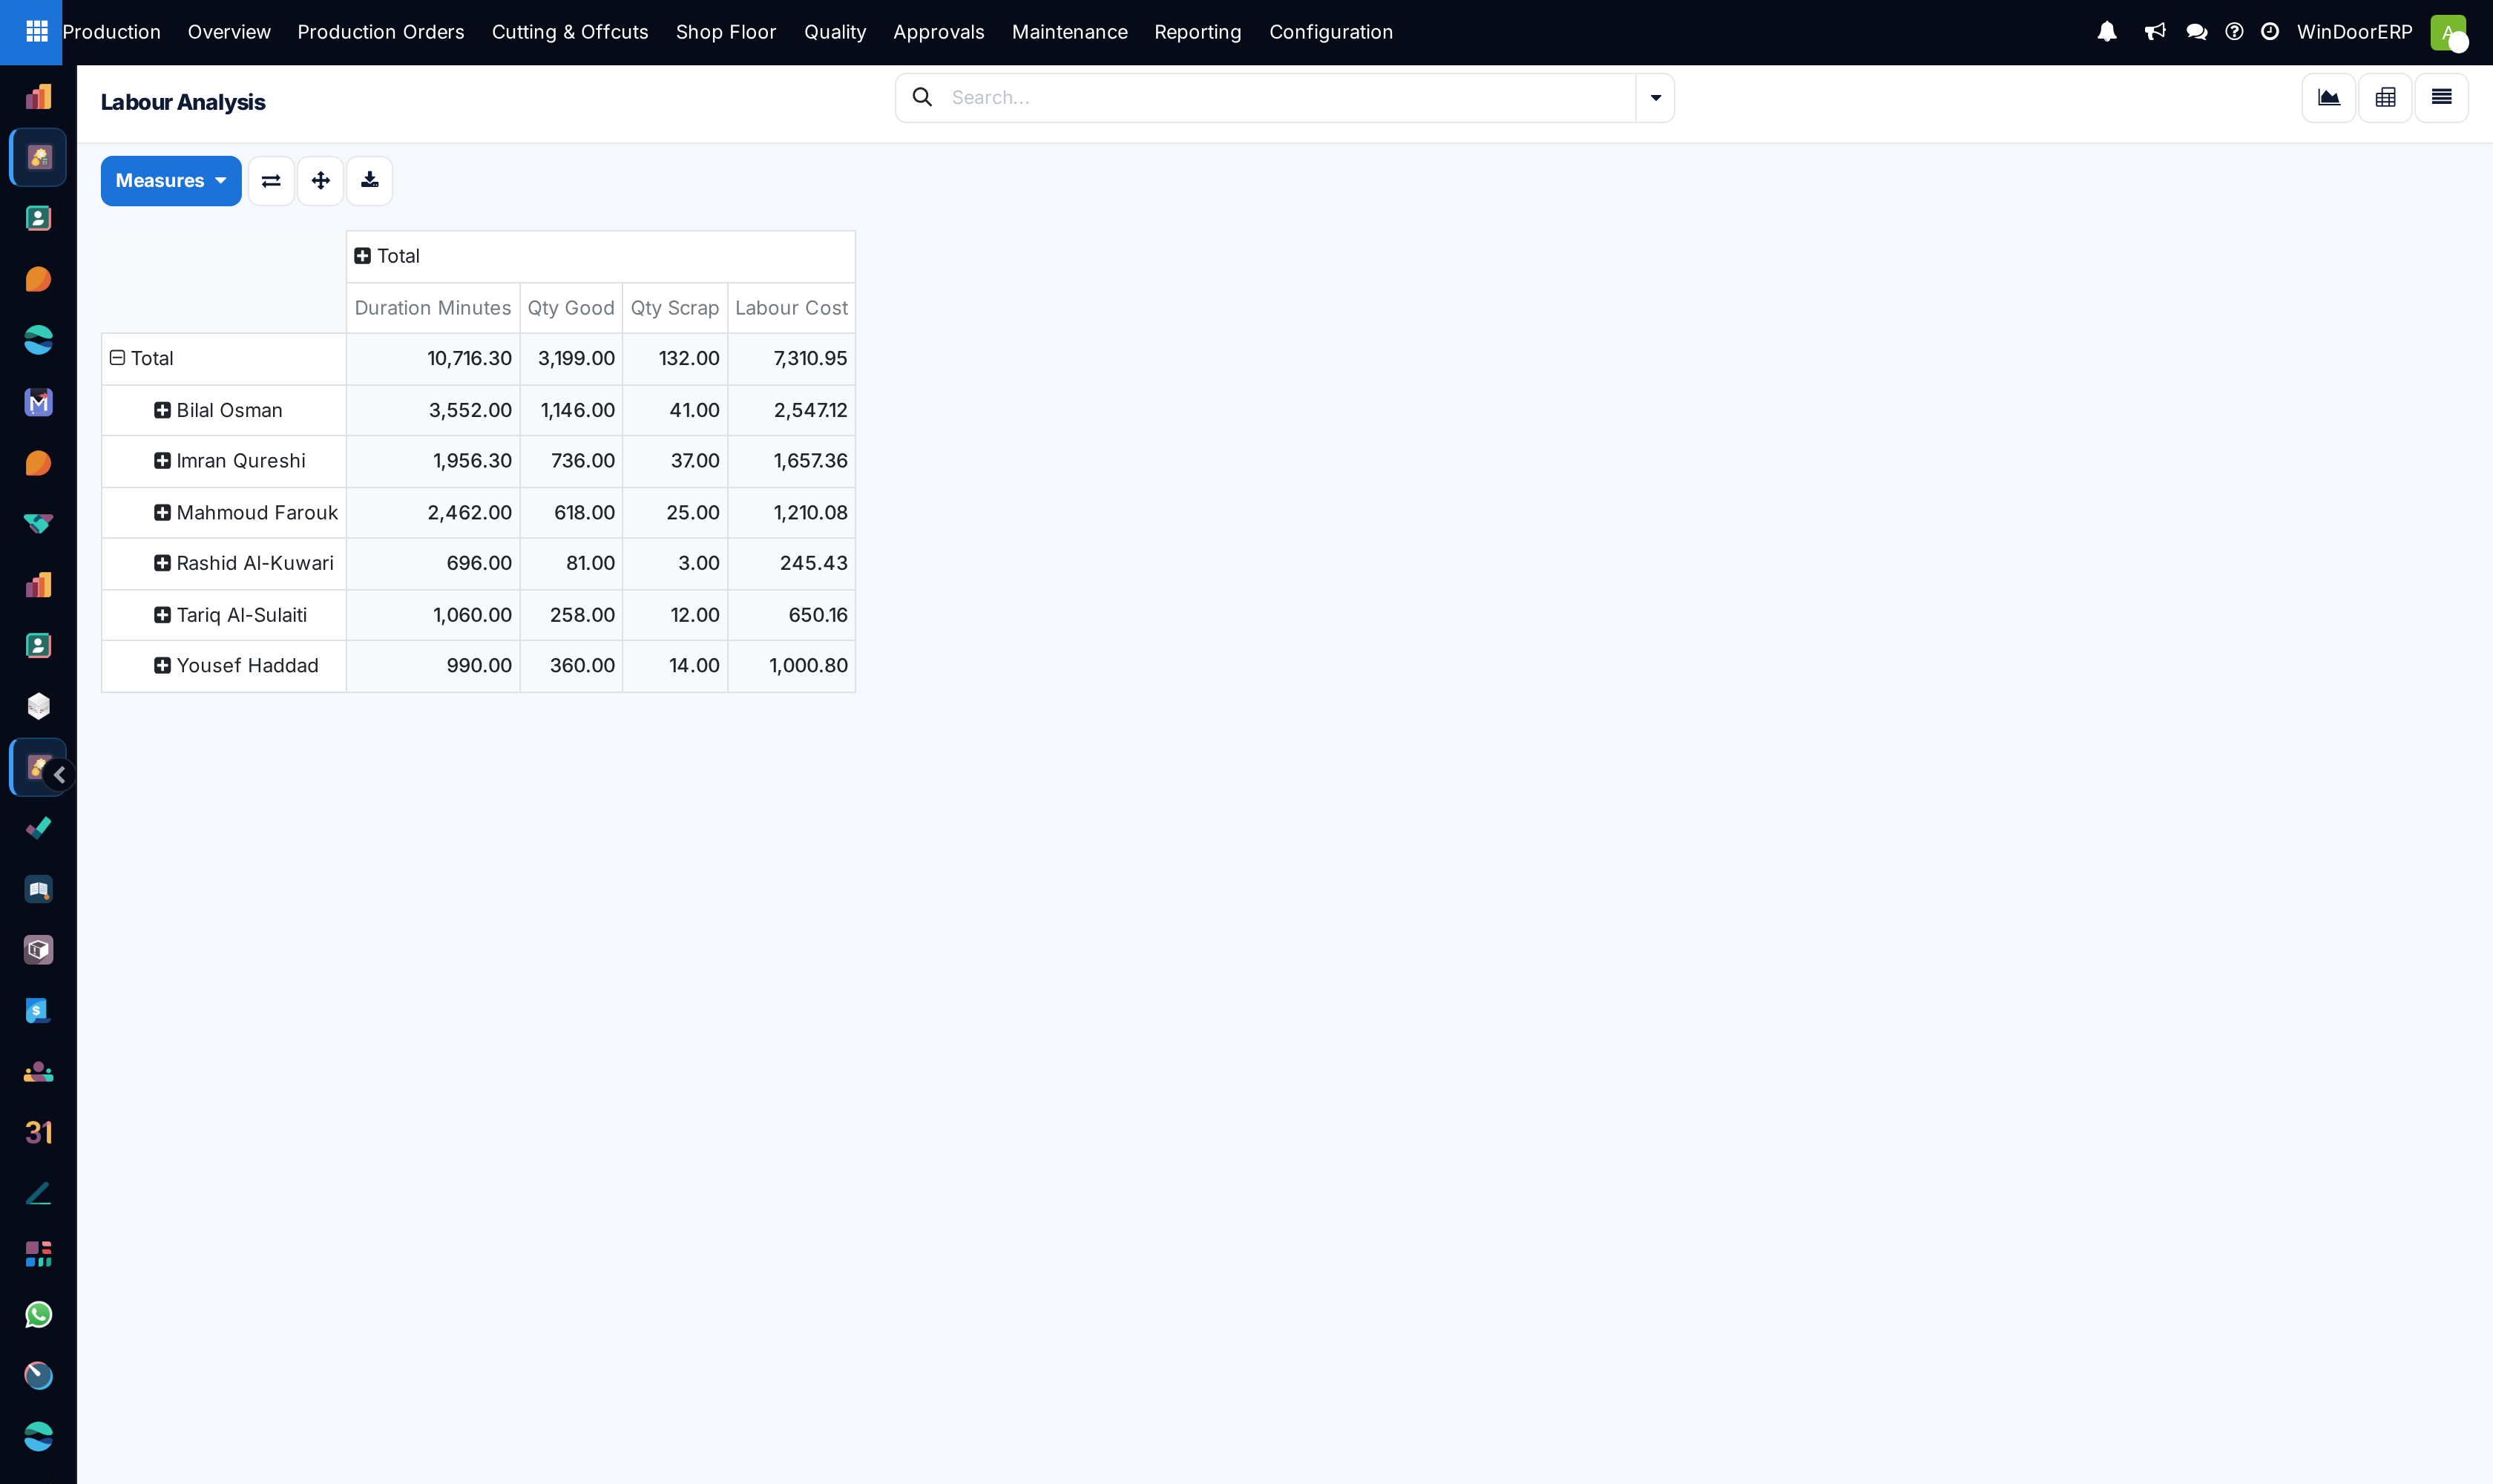
Switch to the Pivot view to calculate labor variance percentages by technician and product line.
-
04
Investigate operations with > 20% negative labor variances to recalibrate BOM routing standards or re-train staff.
Common mistakes
- Blaming operators for labor variances caused by blunt saw blades or malfunctioning CNC air clamps.
- Ignoring setup time spikes during frequent profile color changeovers.
Checkpoint
You can say which product or station consistently takes longer than quoted.