Ask whether the job made money
Profitability, contract by contract
Why this step
Task velocity, project profitability and customer ratings together. If the analytic accounts from journey 8 were set up properly, this answers the only question that finally matters: did that tower make money?
What this does
Delivers executive intelligence on task completion rates, engineering bottlenecks, planned versus actual project hours, and customer satisfaction ratings.
Before you start
- Tasks executed and customer milestone ratings received.
Steps
Important
Customer rating surveys triggered automatically upon milestone completion provide immediate early warnings before minor concerns become disputes.
-
01
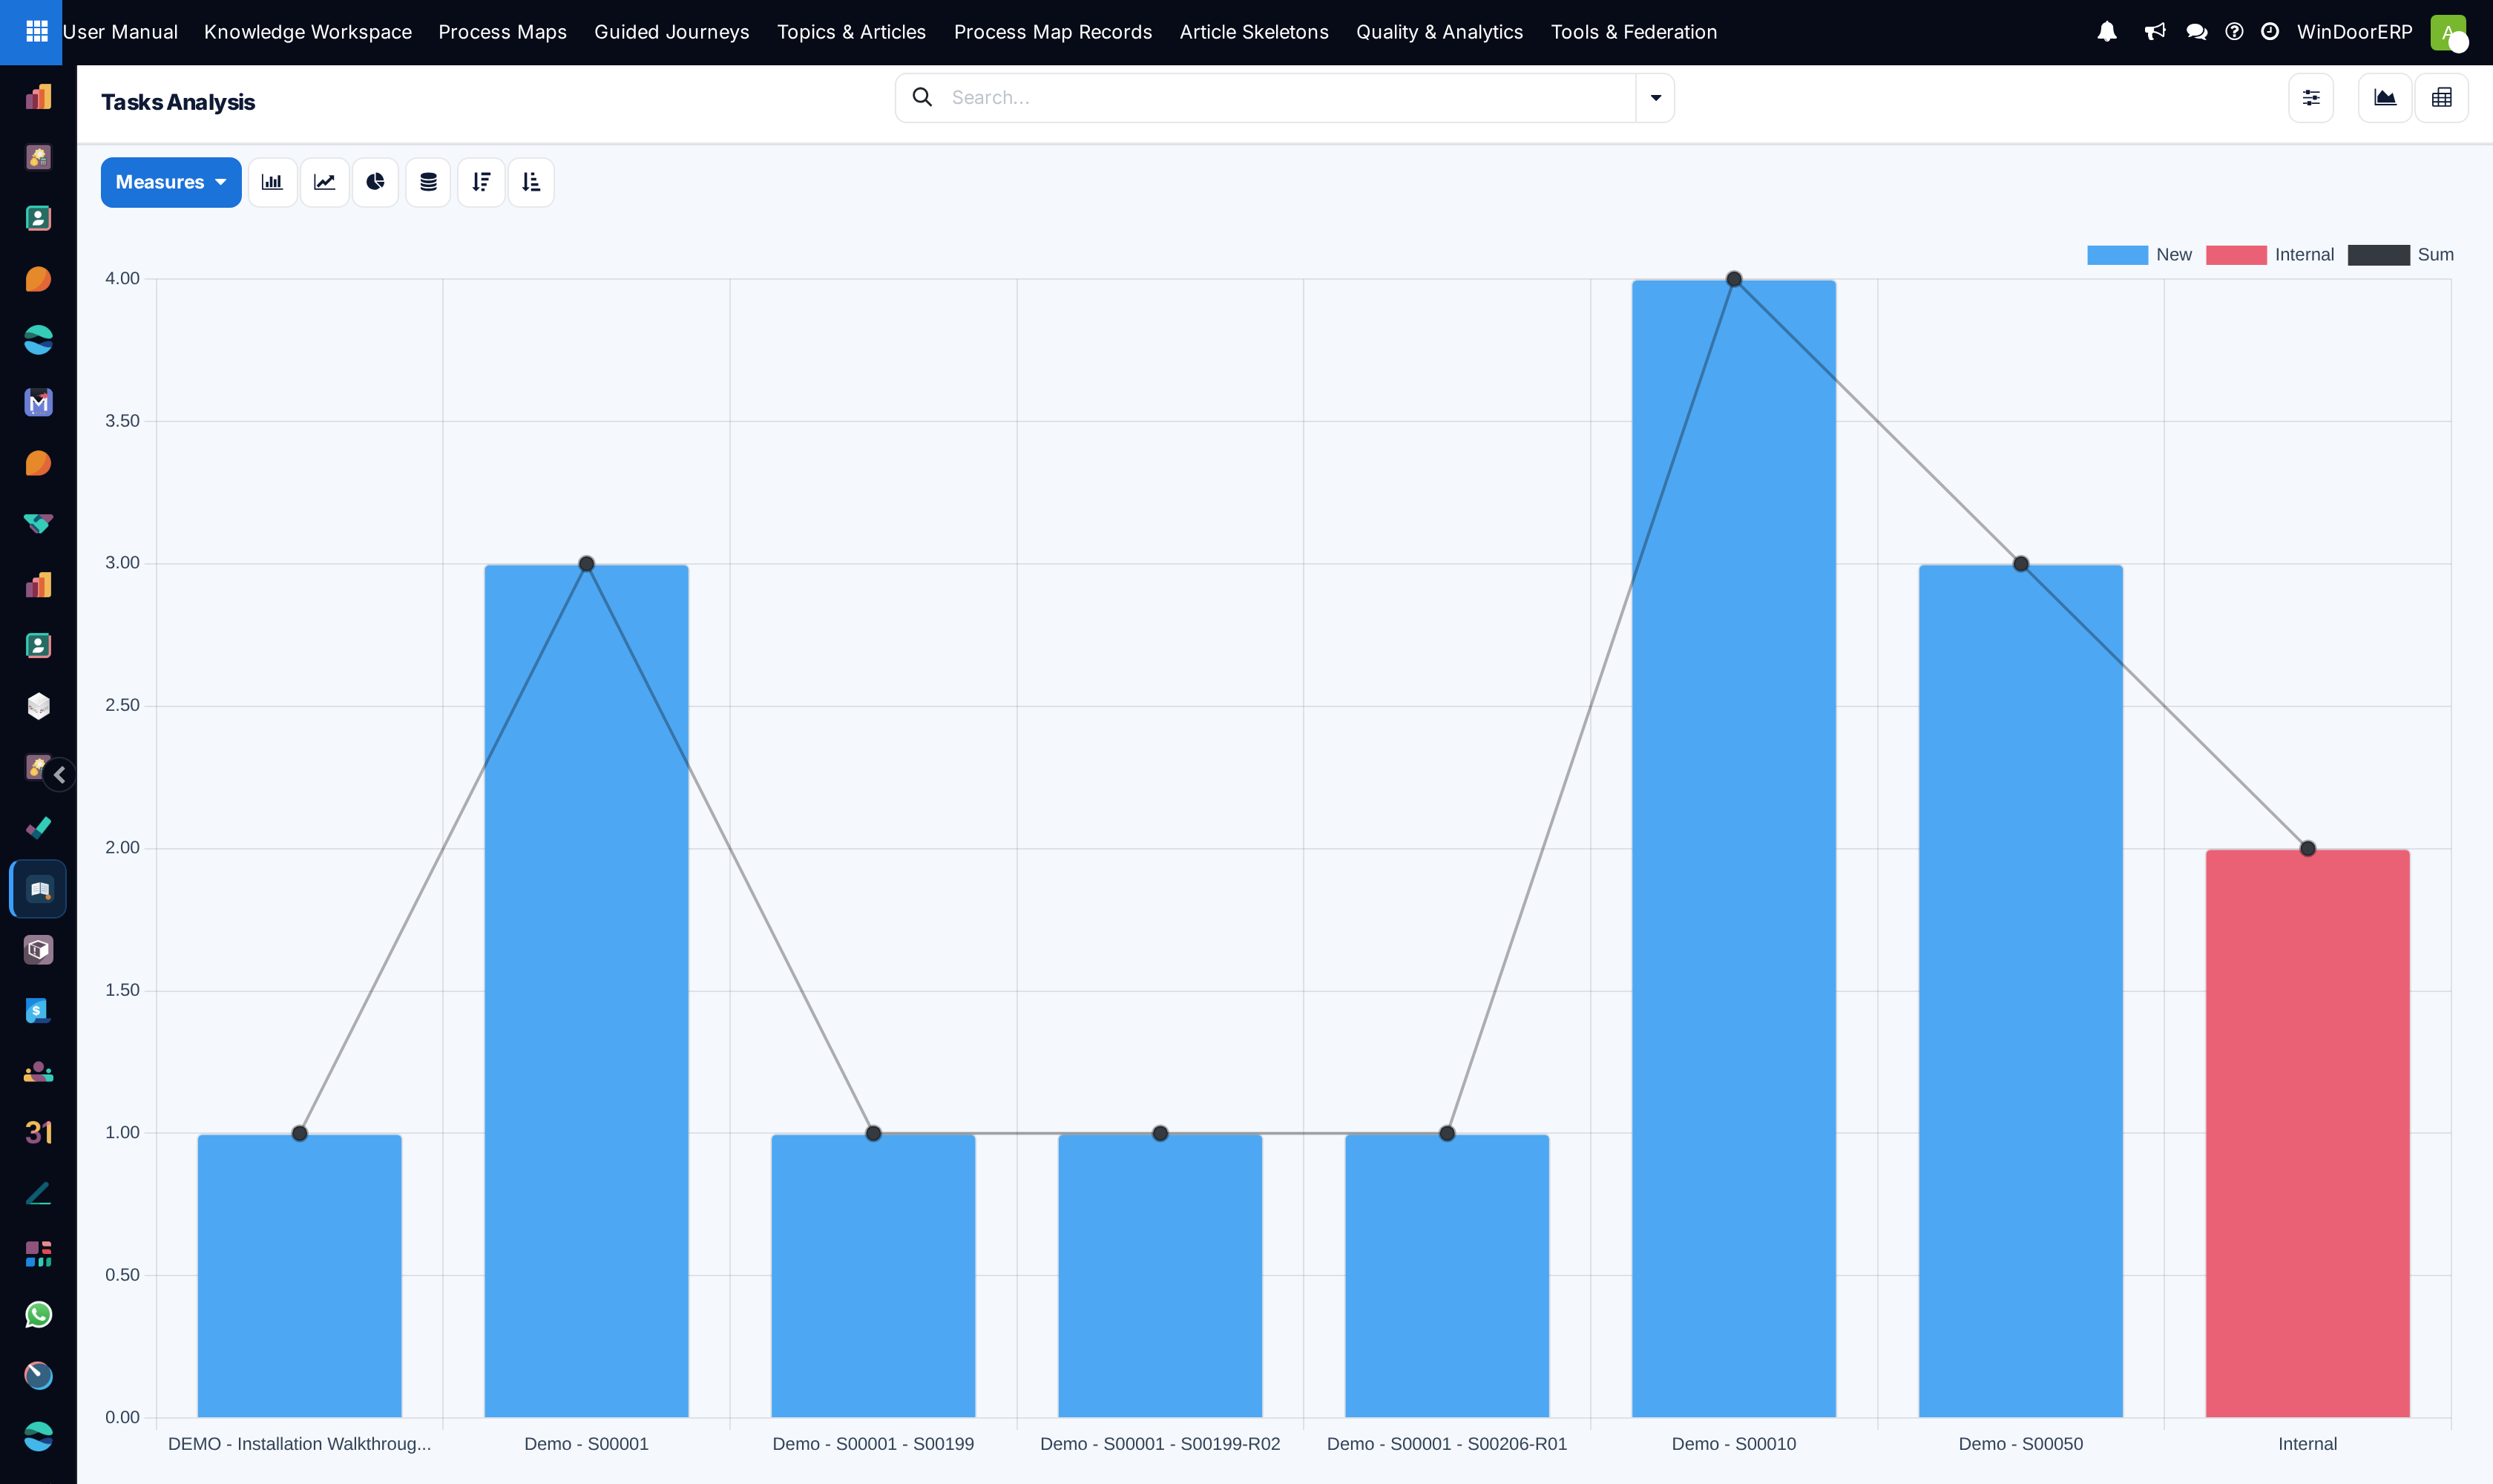
Navigate to Project › Reporting › Tasks Analysis.
-
02
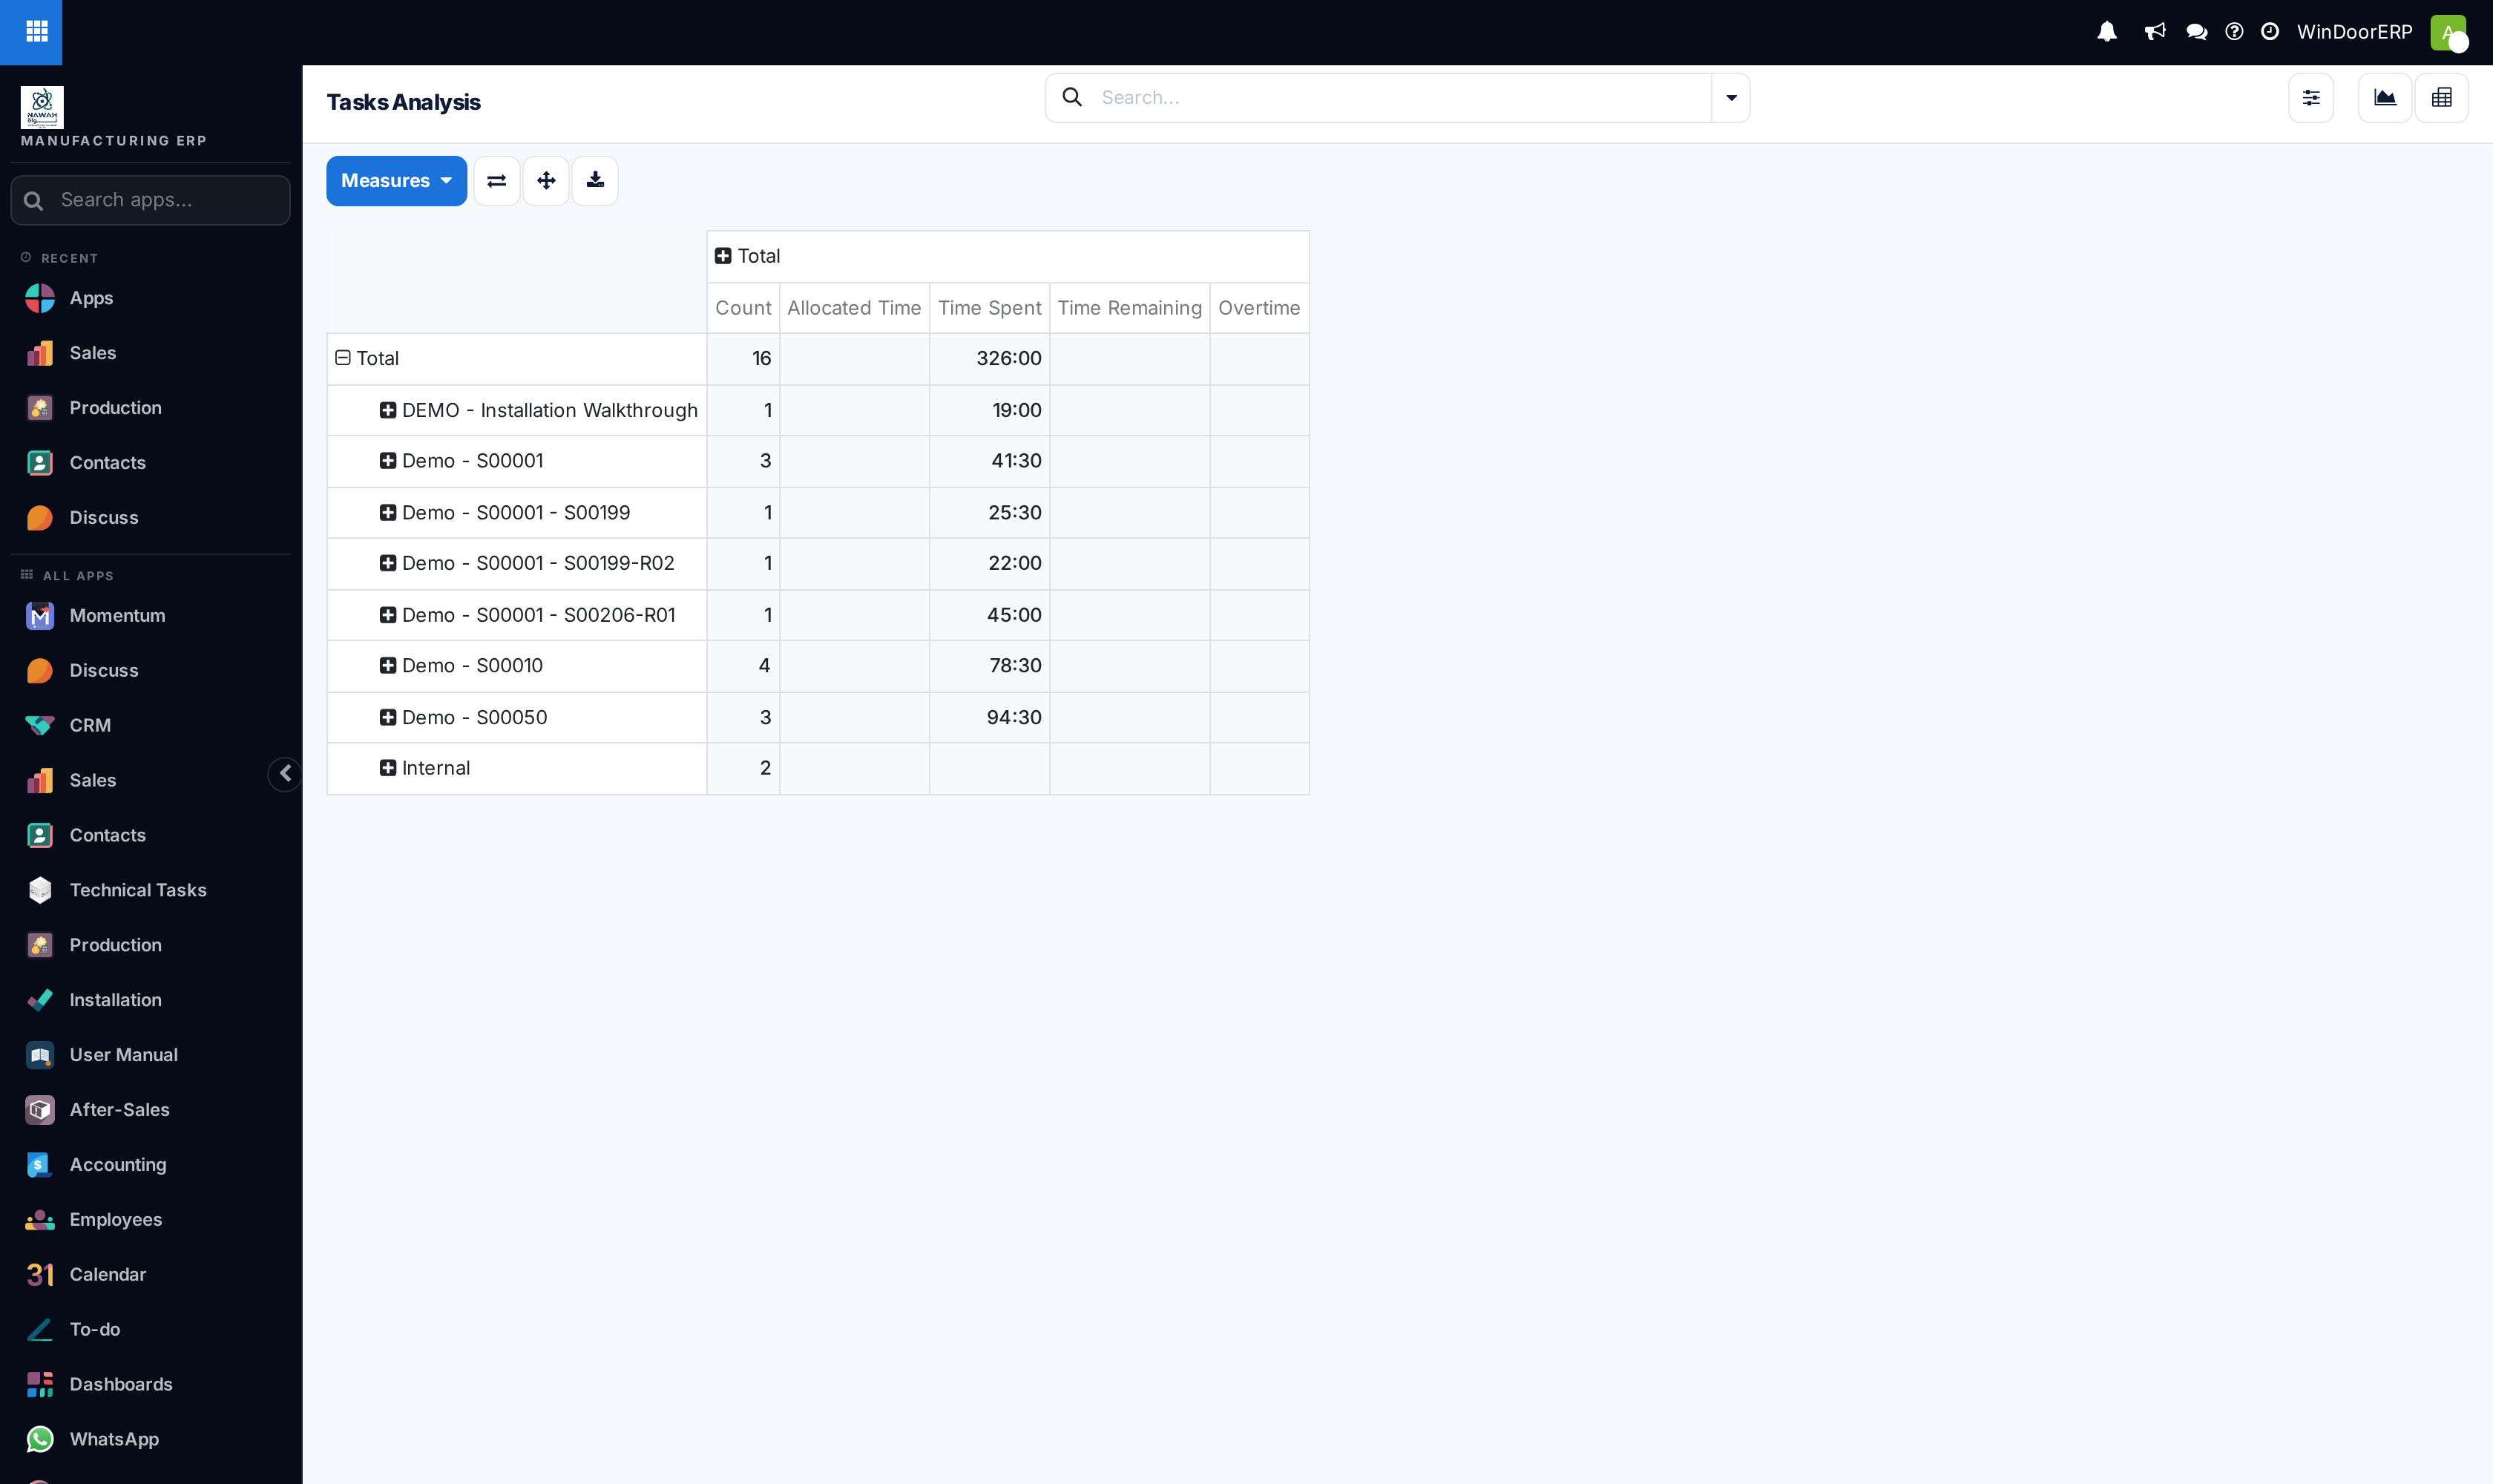
Analyze task completion velocity using the interactive Graph and Pivot matrix.
-
03
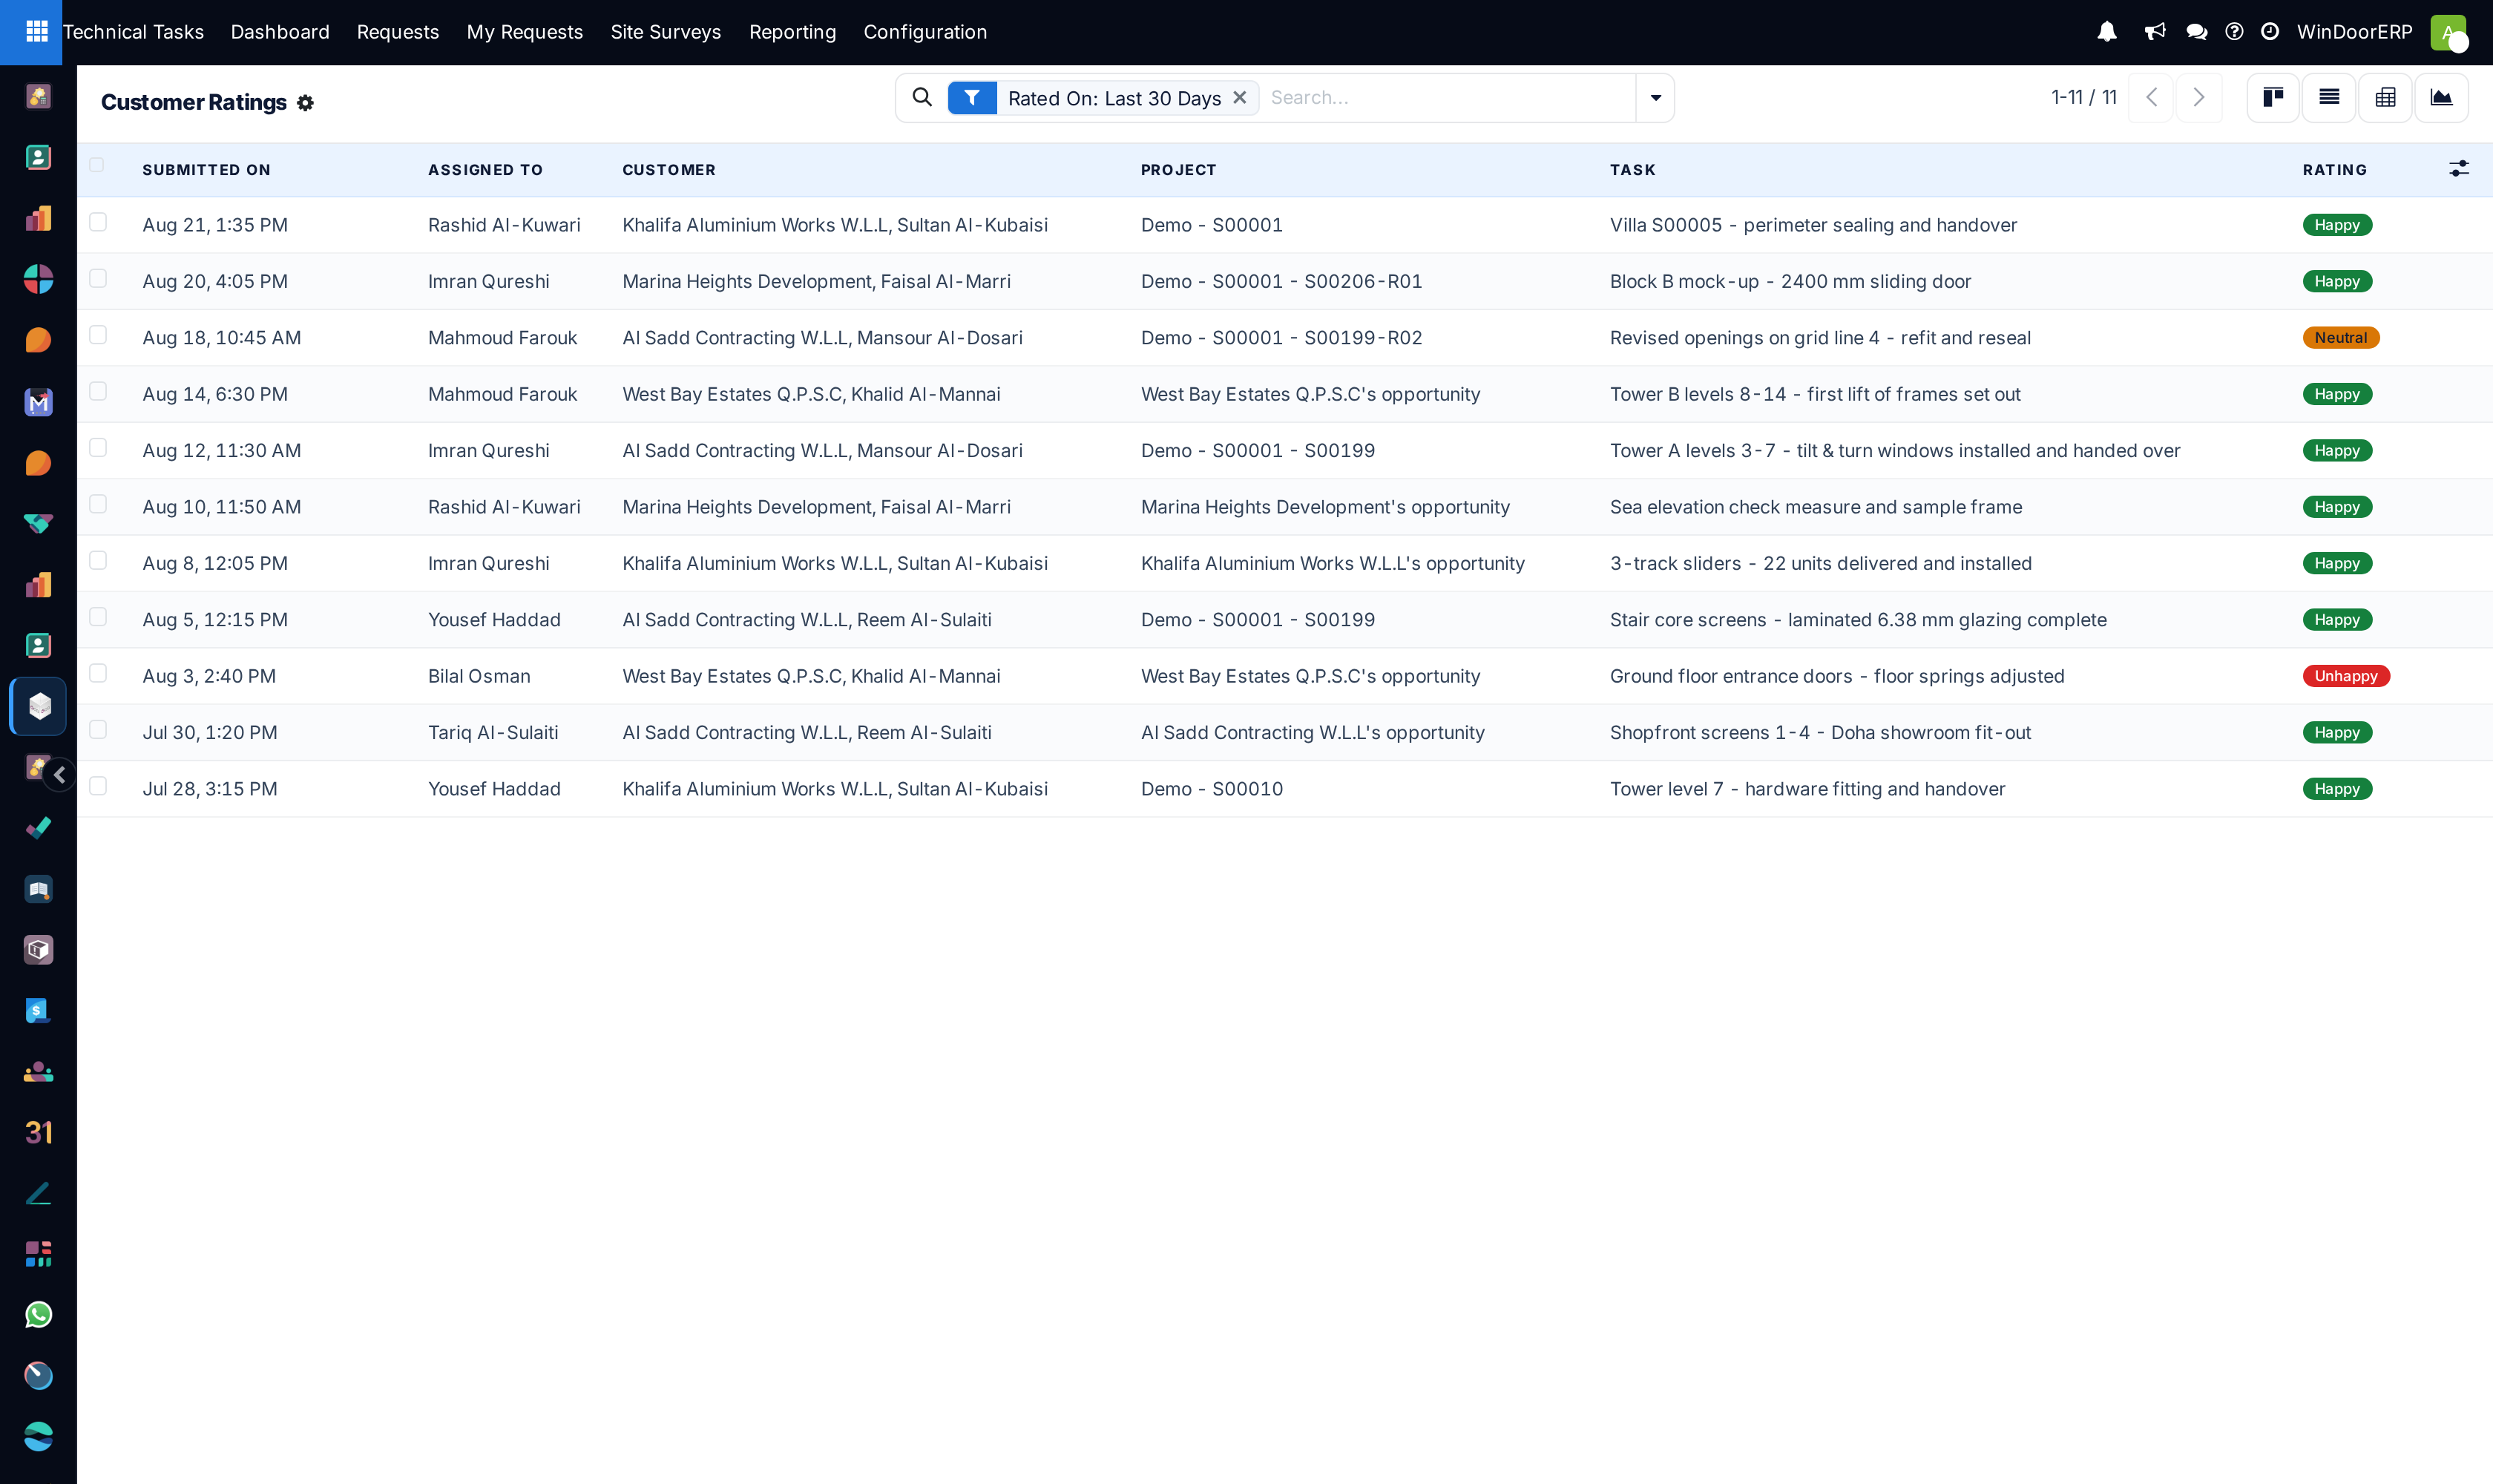
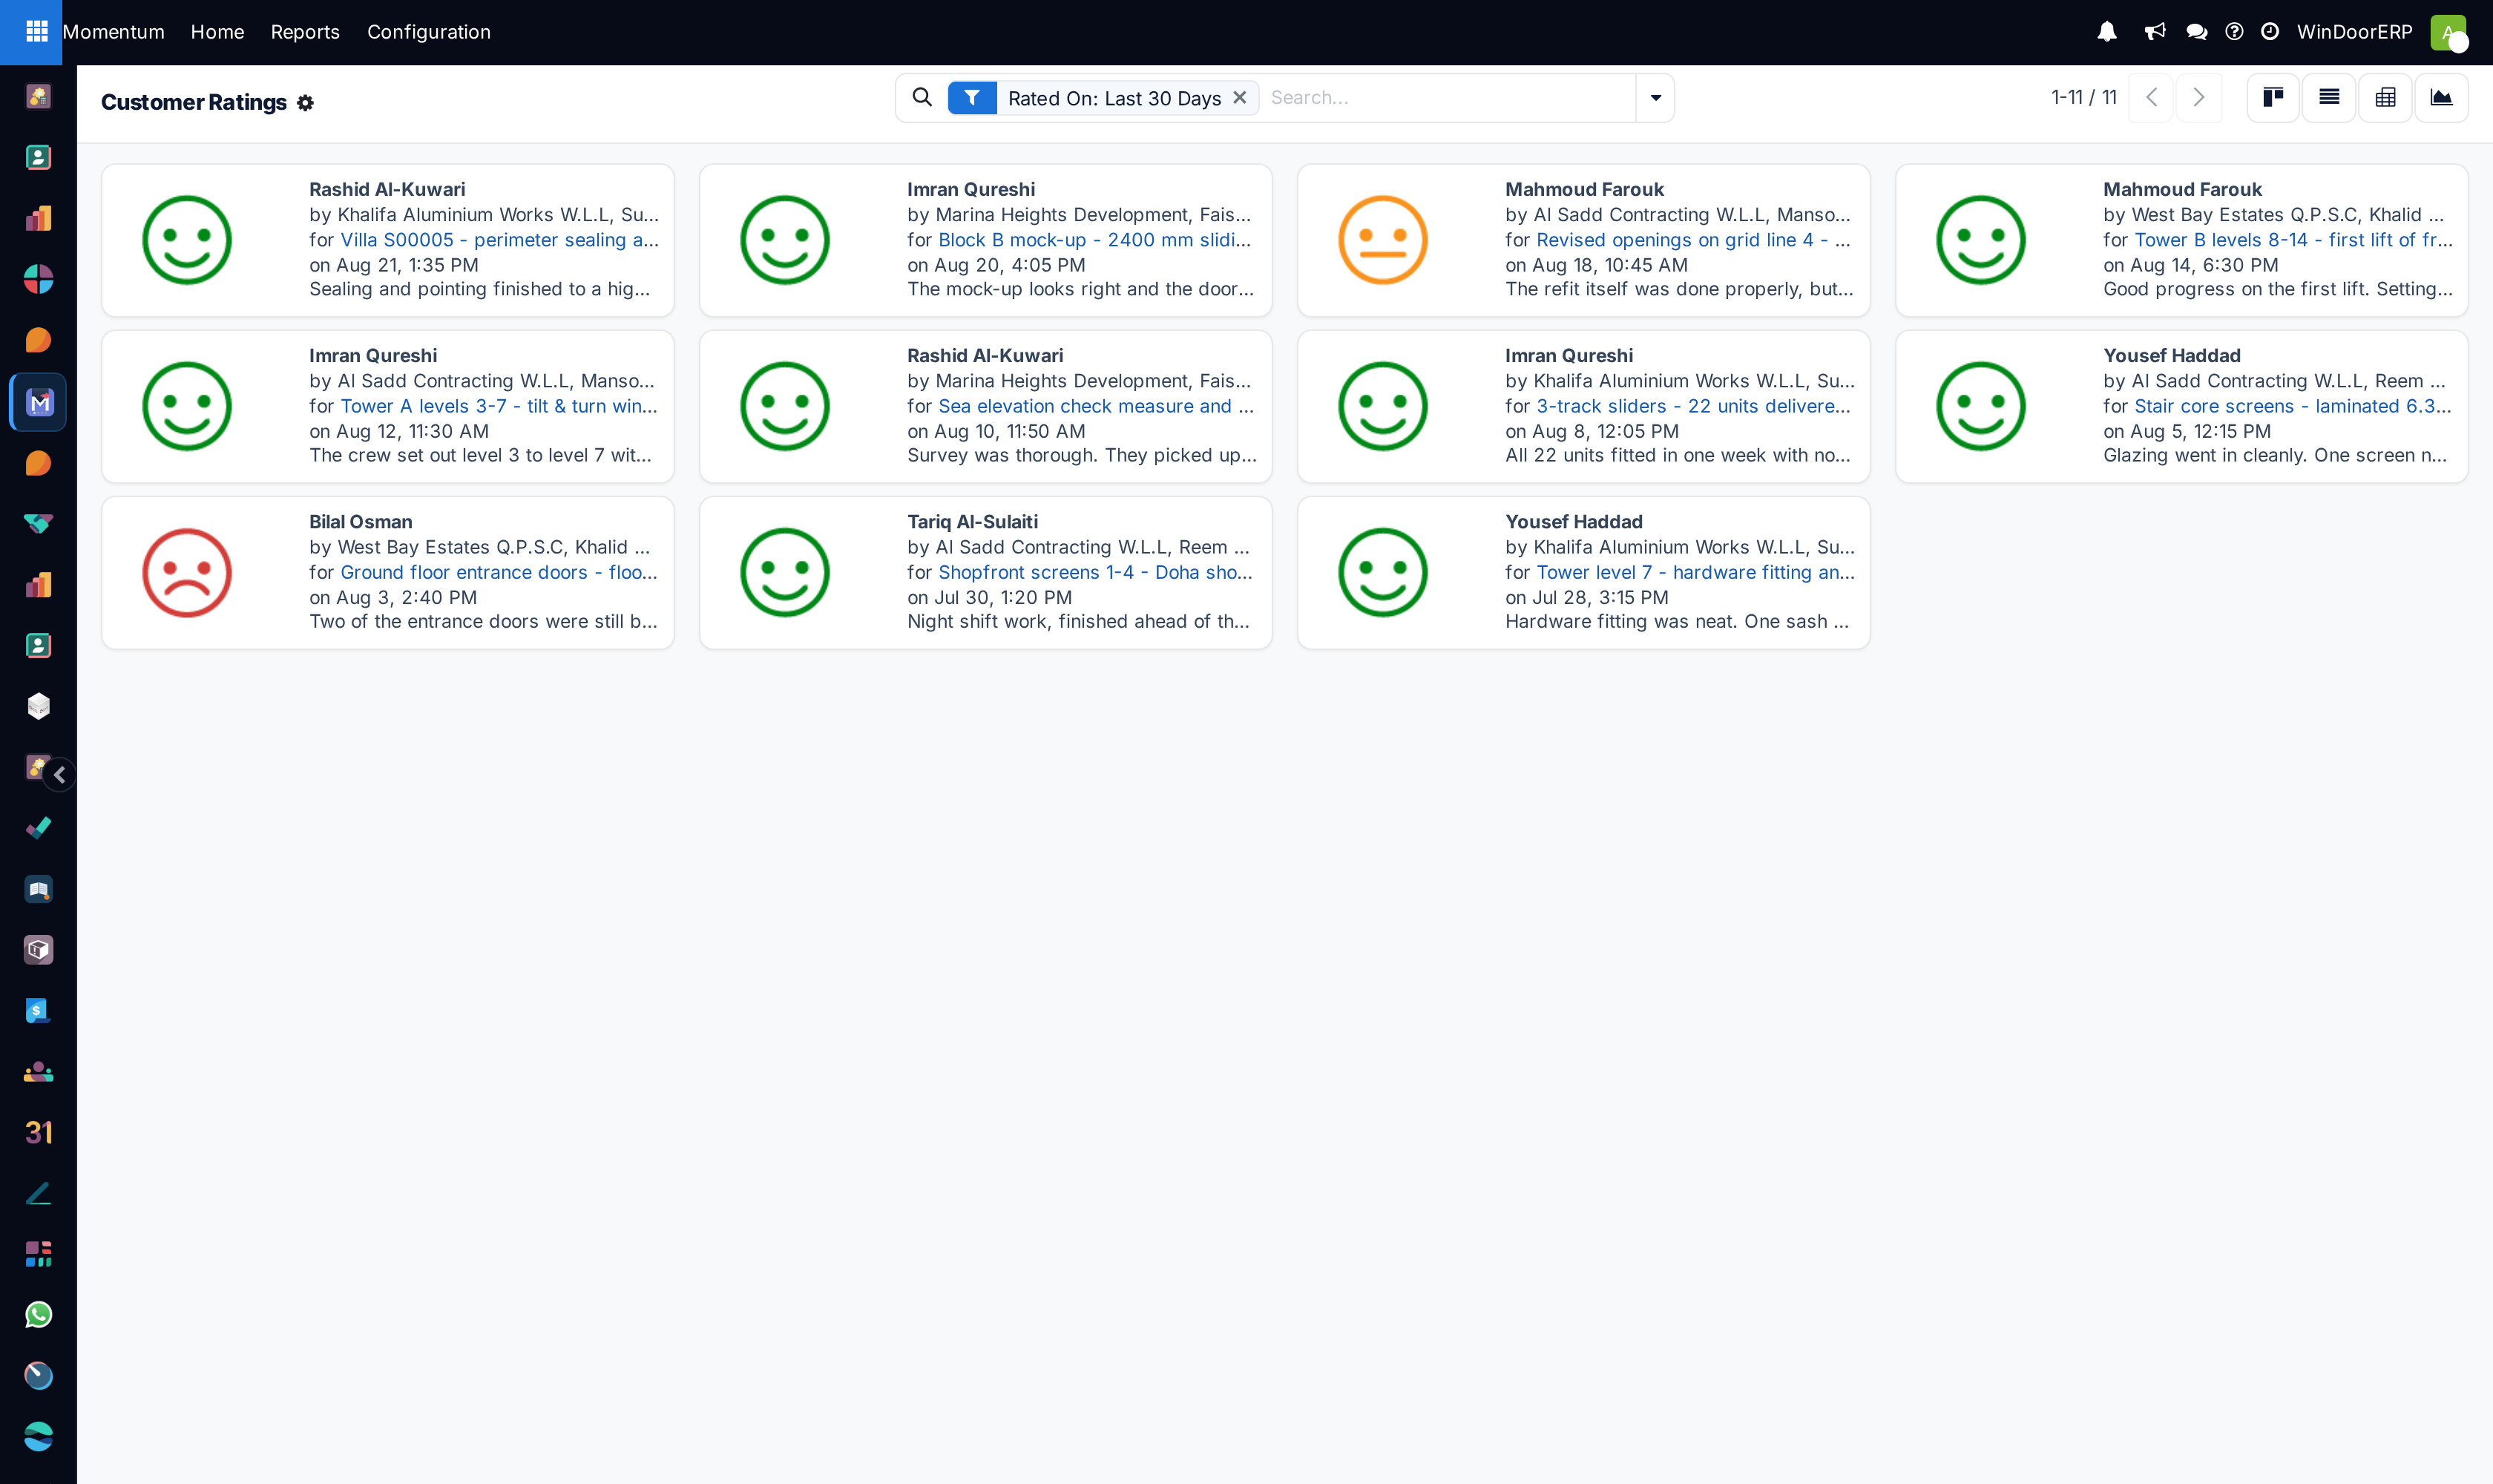
Open Project › Reporting › Customer Ratings.
-
04
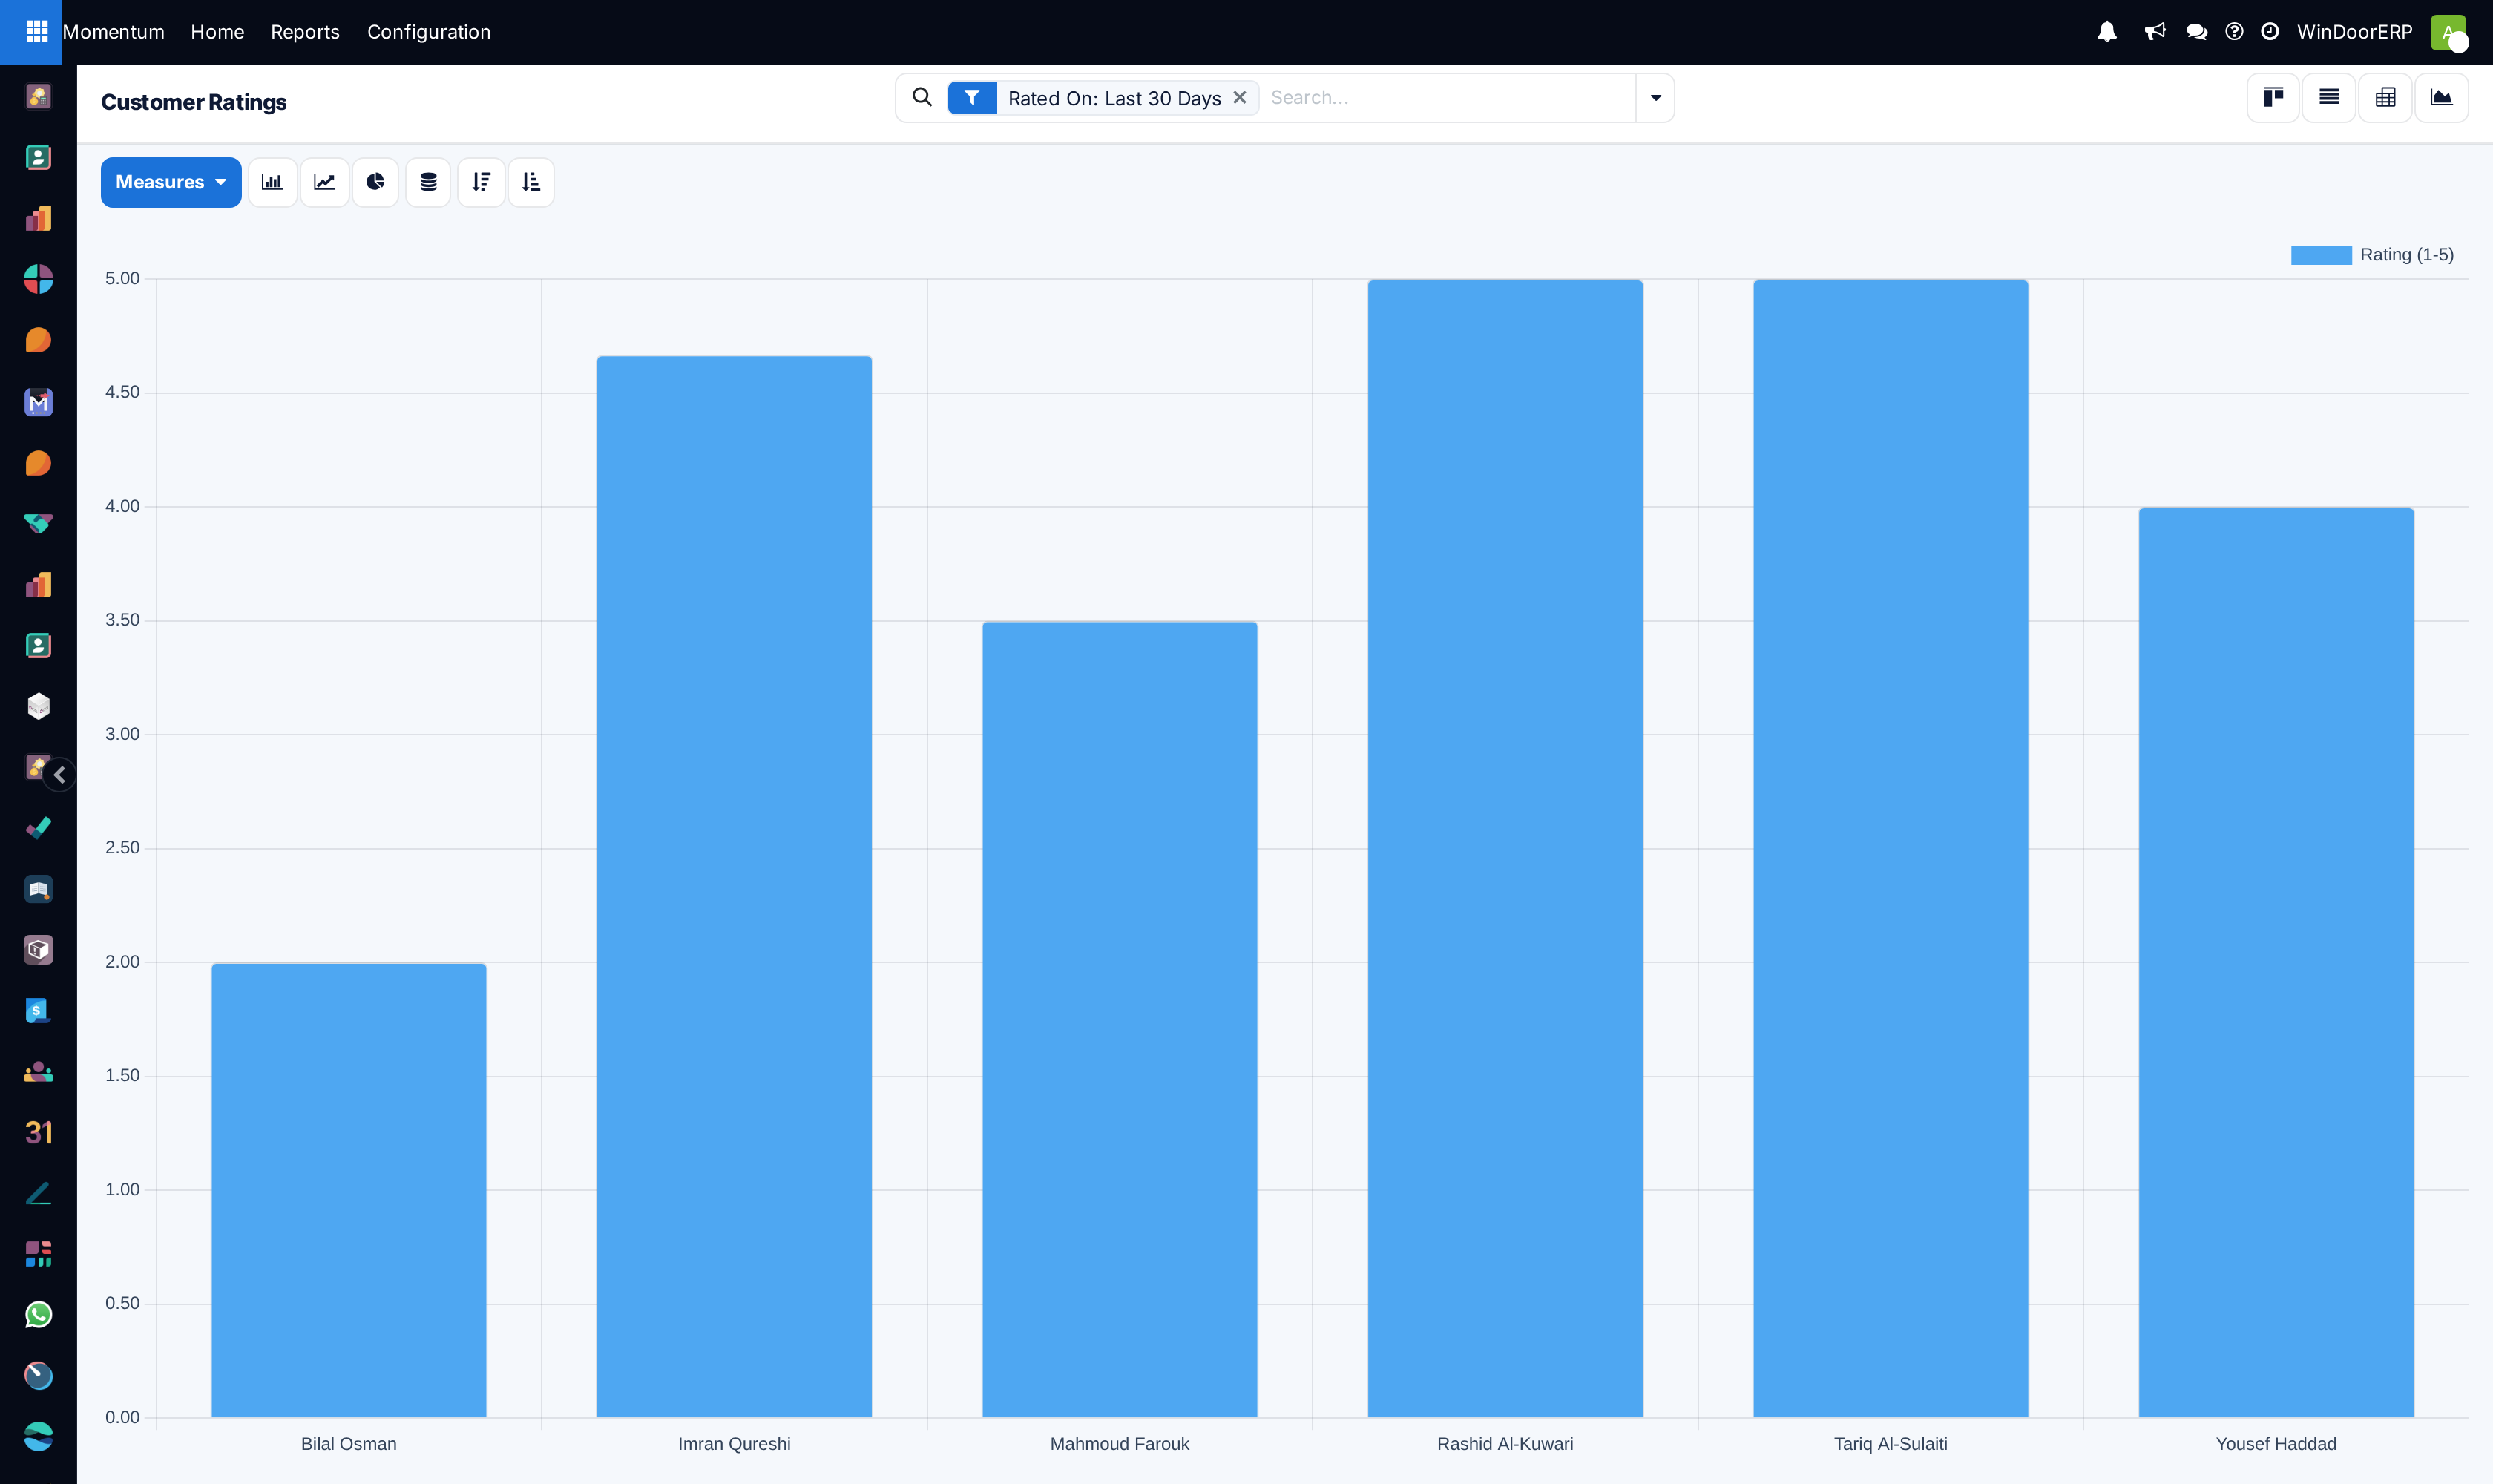
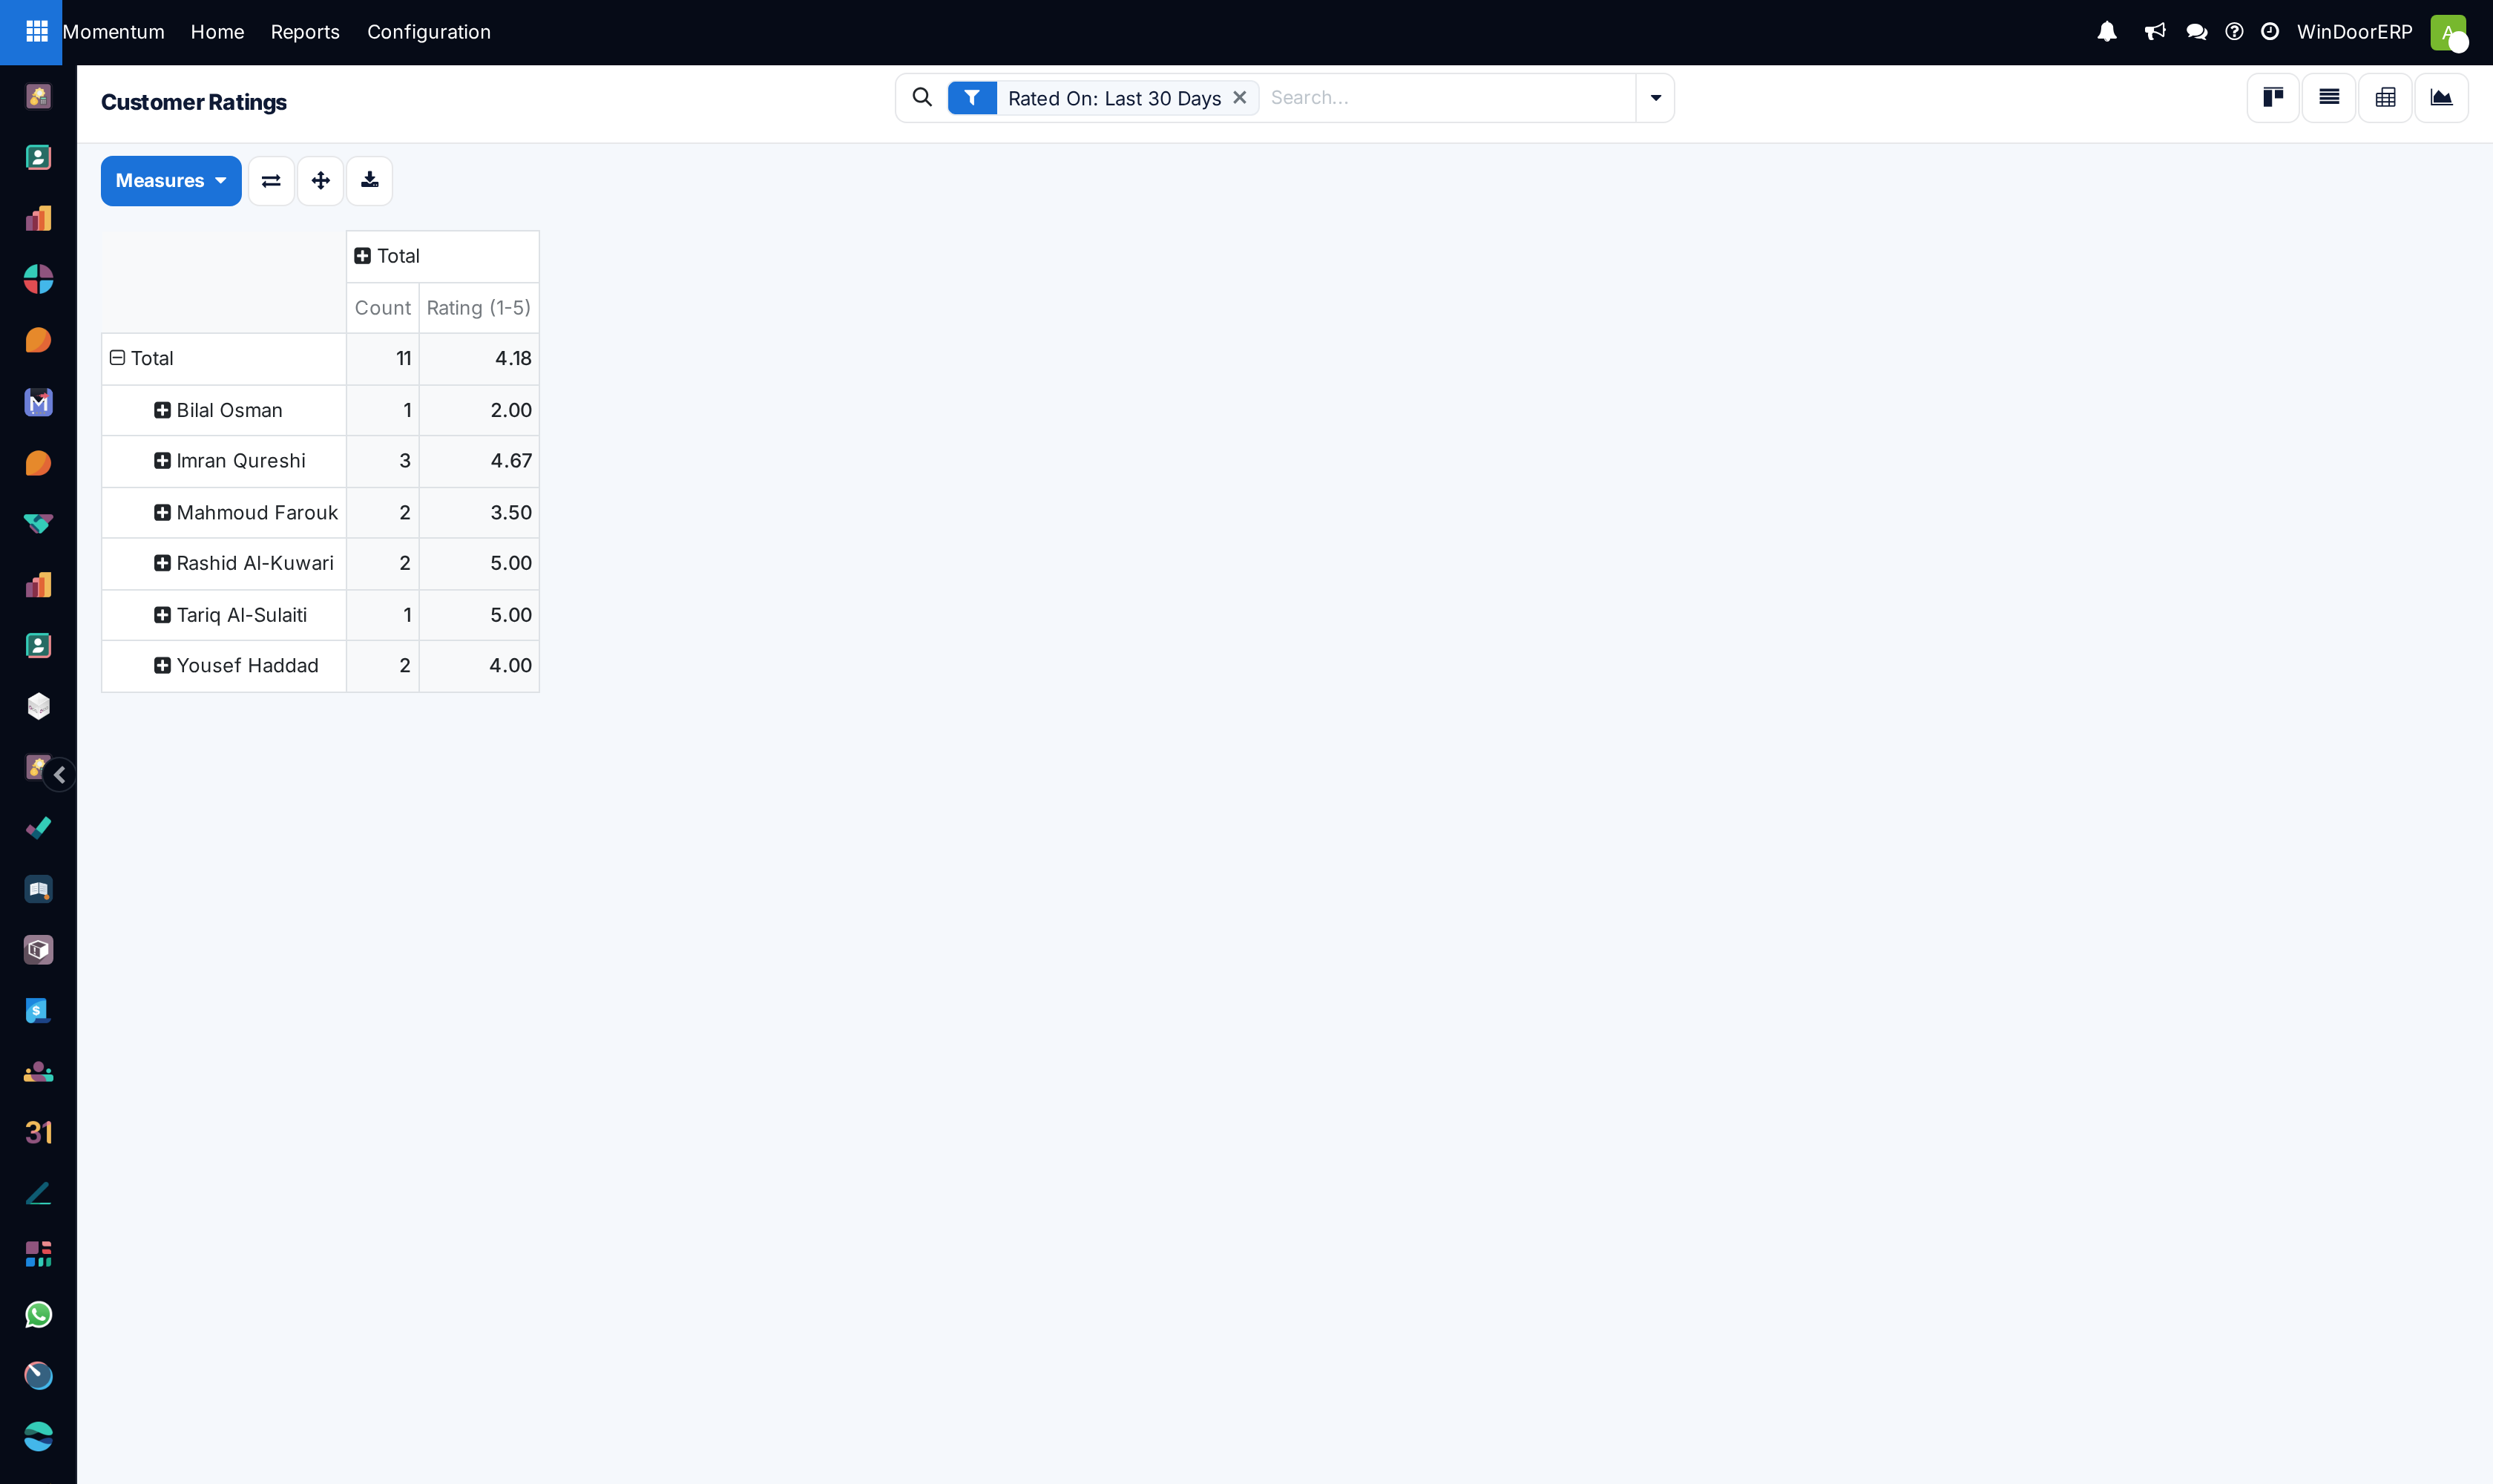
Review customer satisfaction scores across List, Kanban, Graph, and Pivot views to recognize high-performing project teams.
Common mistakes
- Reviewing task completion numbers without verifying deliverable quality acceptance.
- Ignoring negative customer ratings without initiating management follow-up calls.
Checkpoint
You can produce a profit figure for one contract and defend how it was calculated.