Forecast the pipeline: expected revenue, predicted probability, and prorated value by month
What this does
A pipeline is only worth what it is likely to close. This article covers the three numbers that carry that judgement on every deal — Expected Revenue, Probability and Prorated Revenue — where the probability comes from, how recurring revenue is handled separately, and the two screens that turn the numbers into a forecast you can plan production and purchasing against.
Before you start
- Deals that carry a value and an expected closing date. A deal missing either is missing from the forecast.
- For subscription-style revenue, the Recurring Revenues option enabled at CRM › Configuration › Settings, and plans defined at CRM › Configuration › Recurring Plans.
The revenue fields on a deal
| Field | Meaning |
|---|---|
| Expected Revenue | What the job is worth if it is won, in the company currency. Entered by the salesperson; changes are tracked in the chatter, so a deal that halved in value shows who changed it and when. |
| Probability | The chance of winning, 0–100. Editable, but normally maintained for you — see below. |
| Prorated Revenue | Read-only, and computed as Expected Revenue × Probability ÷ 100, rounded to two decimals. This is the weighted number — the one to plan capacity against. |
| Expected Closing | The date you expect to win it. Everything time-based in the forecast is grouped by this field, so a deal with no expected closing sits outside every month. |
| Recurring Revenues | Only with the option on. A repeating amount — a maintenance contract — kept apart from the one-off project value. |
| Recurring Plan | The period the recurring amount covers, defined by its number of months. |
| Expected MRR | Read-only. The recurring amount expressed per month, so contracts on different plans can be compared and added up. |
| Closed Date | Read-only. Stamped when the deal is won or lost. |
| Days to Assign / Days to Close | Read-only measures of how long the deal waited for an owner and how long it took to close. Both are available as measures in the reporting views. |
Important
Prorated Revenue is derived, never typed. If the weighted pipeline looks wrong, the cause is always one of its two inputs: a missing Expected Revenue, or a probability nobody has maintained.
Where the probability comes from
WindoorERP predicts it. Each deal carries an Automated Probability, computed from what your own historical deals did — which sources, teams, countries, tags and stages ended up won, and which did not. While a deal's probability is left automatic, that prediction is written into Probability and kept up to date as the deal moves and as the model learns.
Type a probability yourself and the deal stops following the prediction: from then on the figure is yours, and the automated value is kept alongside for comparison but no longer applied. That is the intended way to override a model that cannot know what you know about a particular tender.
Note
Probability is not a property of the stage. Moving a deal to a later column does not set a fixed percentage — stages in this version carry no probability field at all. What changes the number is the prediction updating, or a person typing one.
Forecast: the pipeline laid out by month
Open CRM › Reporting › Forecast. The board regroups the pipeline by Expected Closing — one column per month instead of per stage.
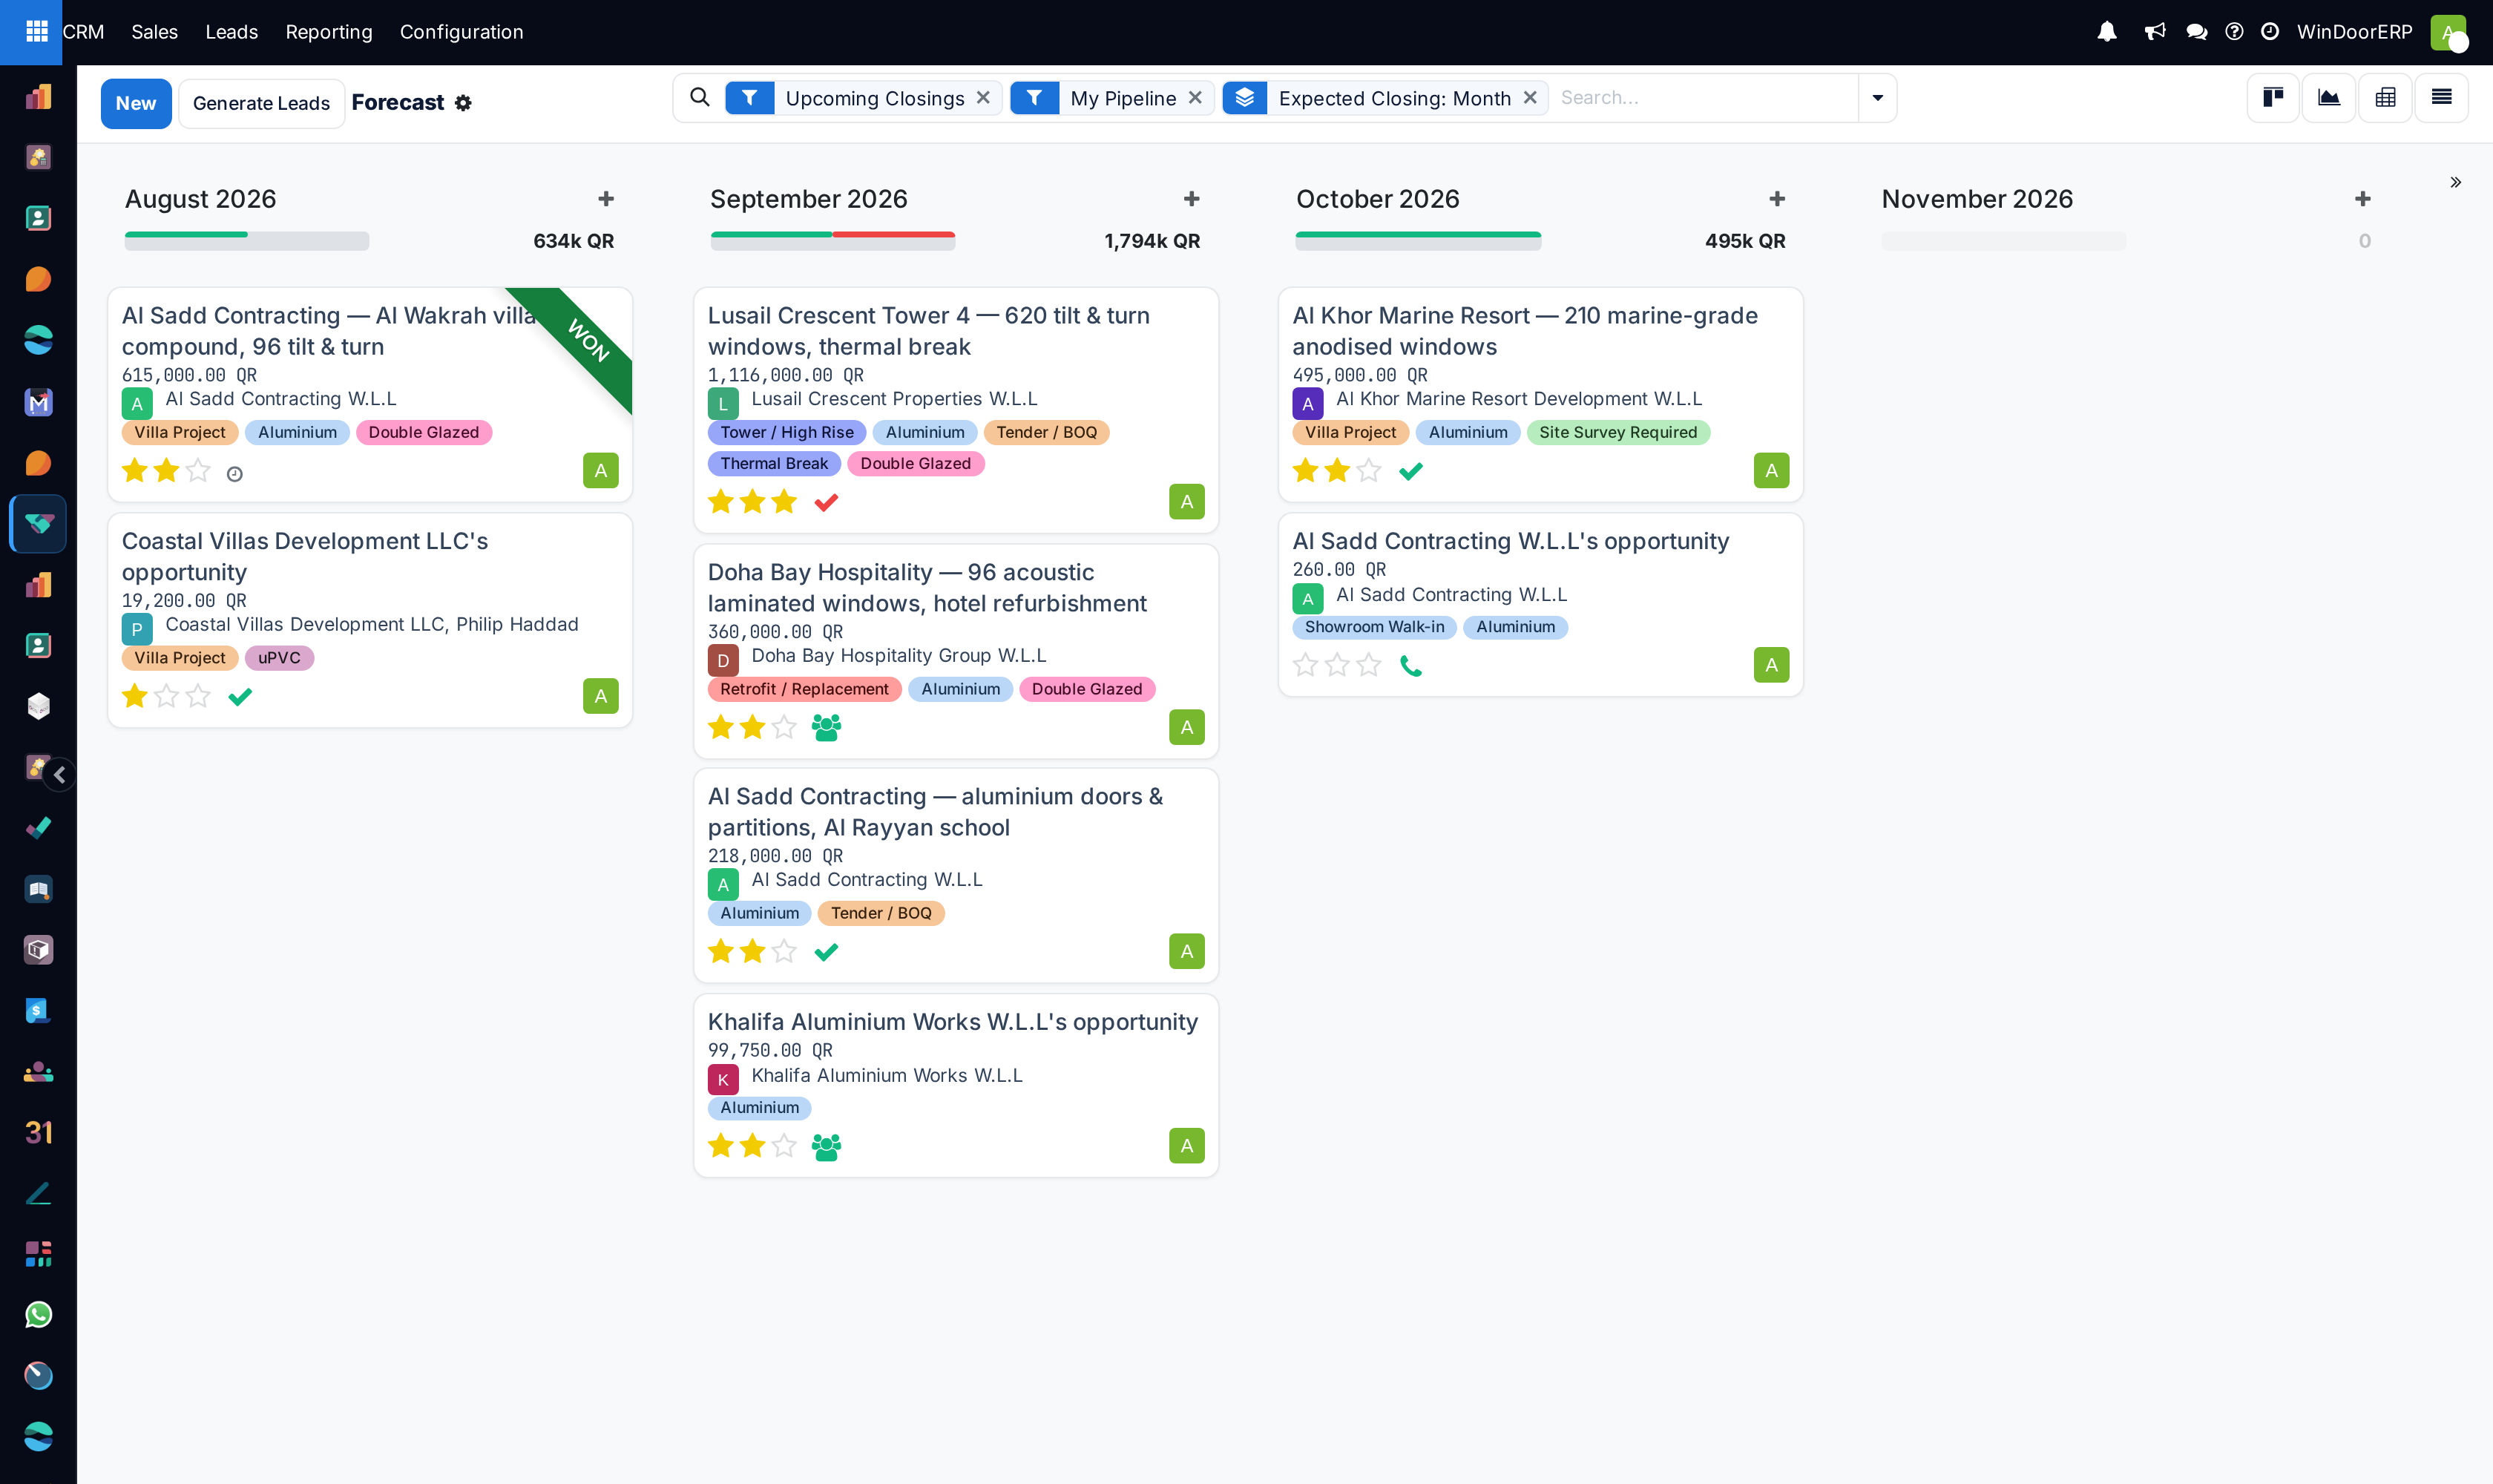
| On the screen | What it shows |
|---|---|
| Column heading | The month, with a + to add a deal straight into it. |
| Column total | The month's Prorated Revenue — the weighted figure, not the headline one. A column reading 634k is not 634k of orders; it is the risk-adjusted expectation. |
| Progress bar | Splits the month by next-activity state, exactly as on the pipeline. A month with a wide red band is a month whose deals nobody is working. |
| Card amount | That deal's prorated revenue. |
| Won / Lost ribbon | Deals already decided, still shown in the month they closed in. |
| Default filters | Upcoming Closings and My Pipeline, grouped by Expected Closing: Month. Remove My Pipeline to see the whole team. |
Dragging a card between months rewrites its expected closing date. That is the right way to reforecast a job whose site is not ready — and it is also how a forecast quietly becomes fiction if it is done to tidy the board rather than because the date changed.
Example
Production planning asks what to expect in October. The Forecast column for October reads the weighted total; open it, sort by value, and the two or three deals that carry most of that figure are visible immediately. Those are the ones to confirm with the customer before ordering profile.
Pipeline analysis: pivot and graph
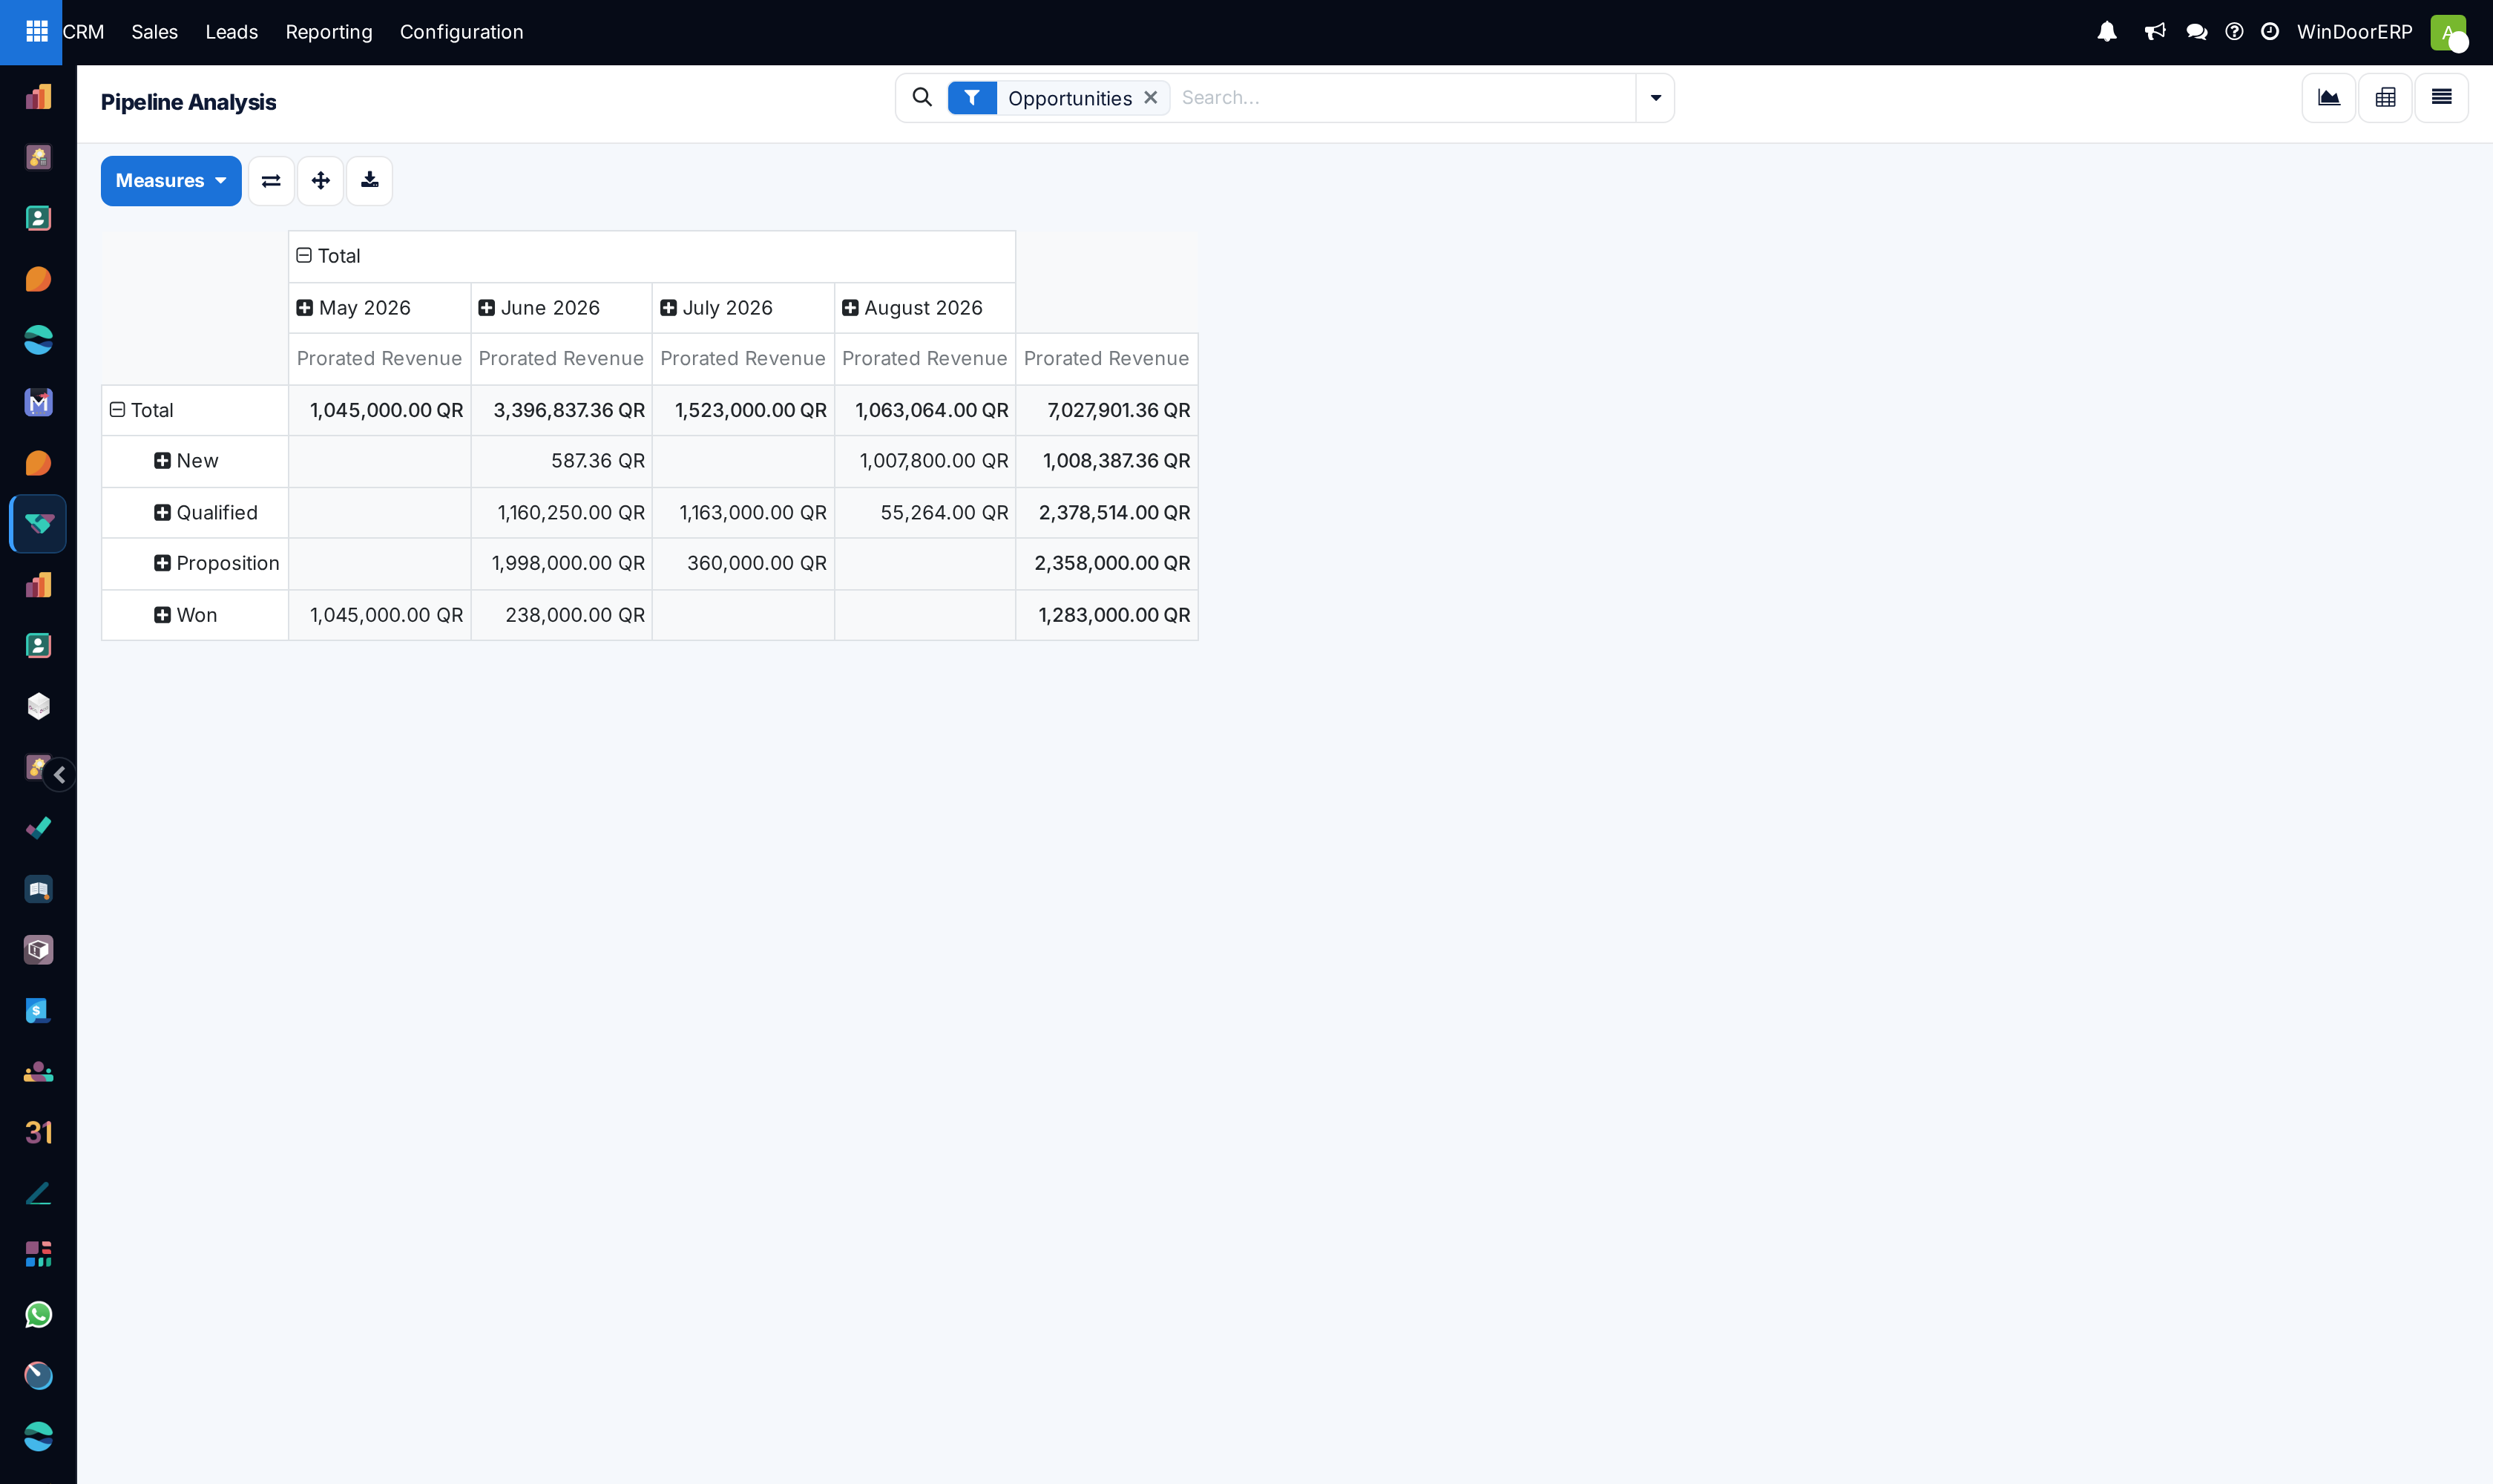
Open CRM › Reporting › Pipeline for the analytical view of the same data. The screen is titled Pipeline Analysis and opens as a graph, filtered to opportunities that are still current; switch to the pivot with the view selector at the top right. The pivot arrives with stages down the rows, creation month across the columns, and Prorated Revenue as the measure.
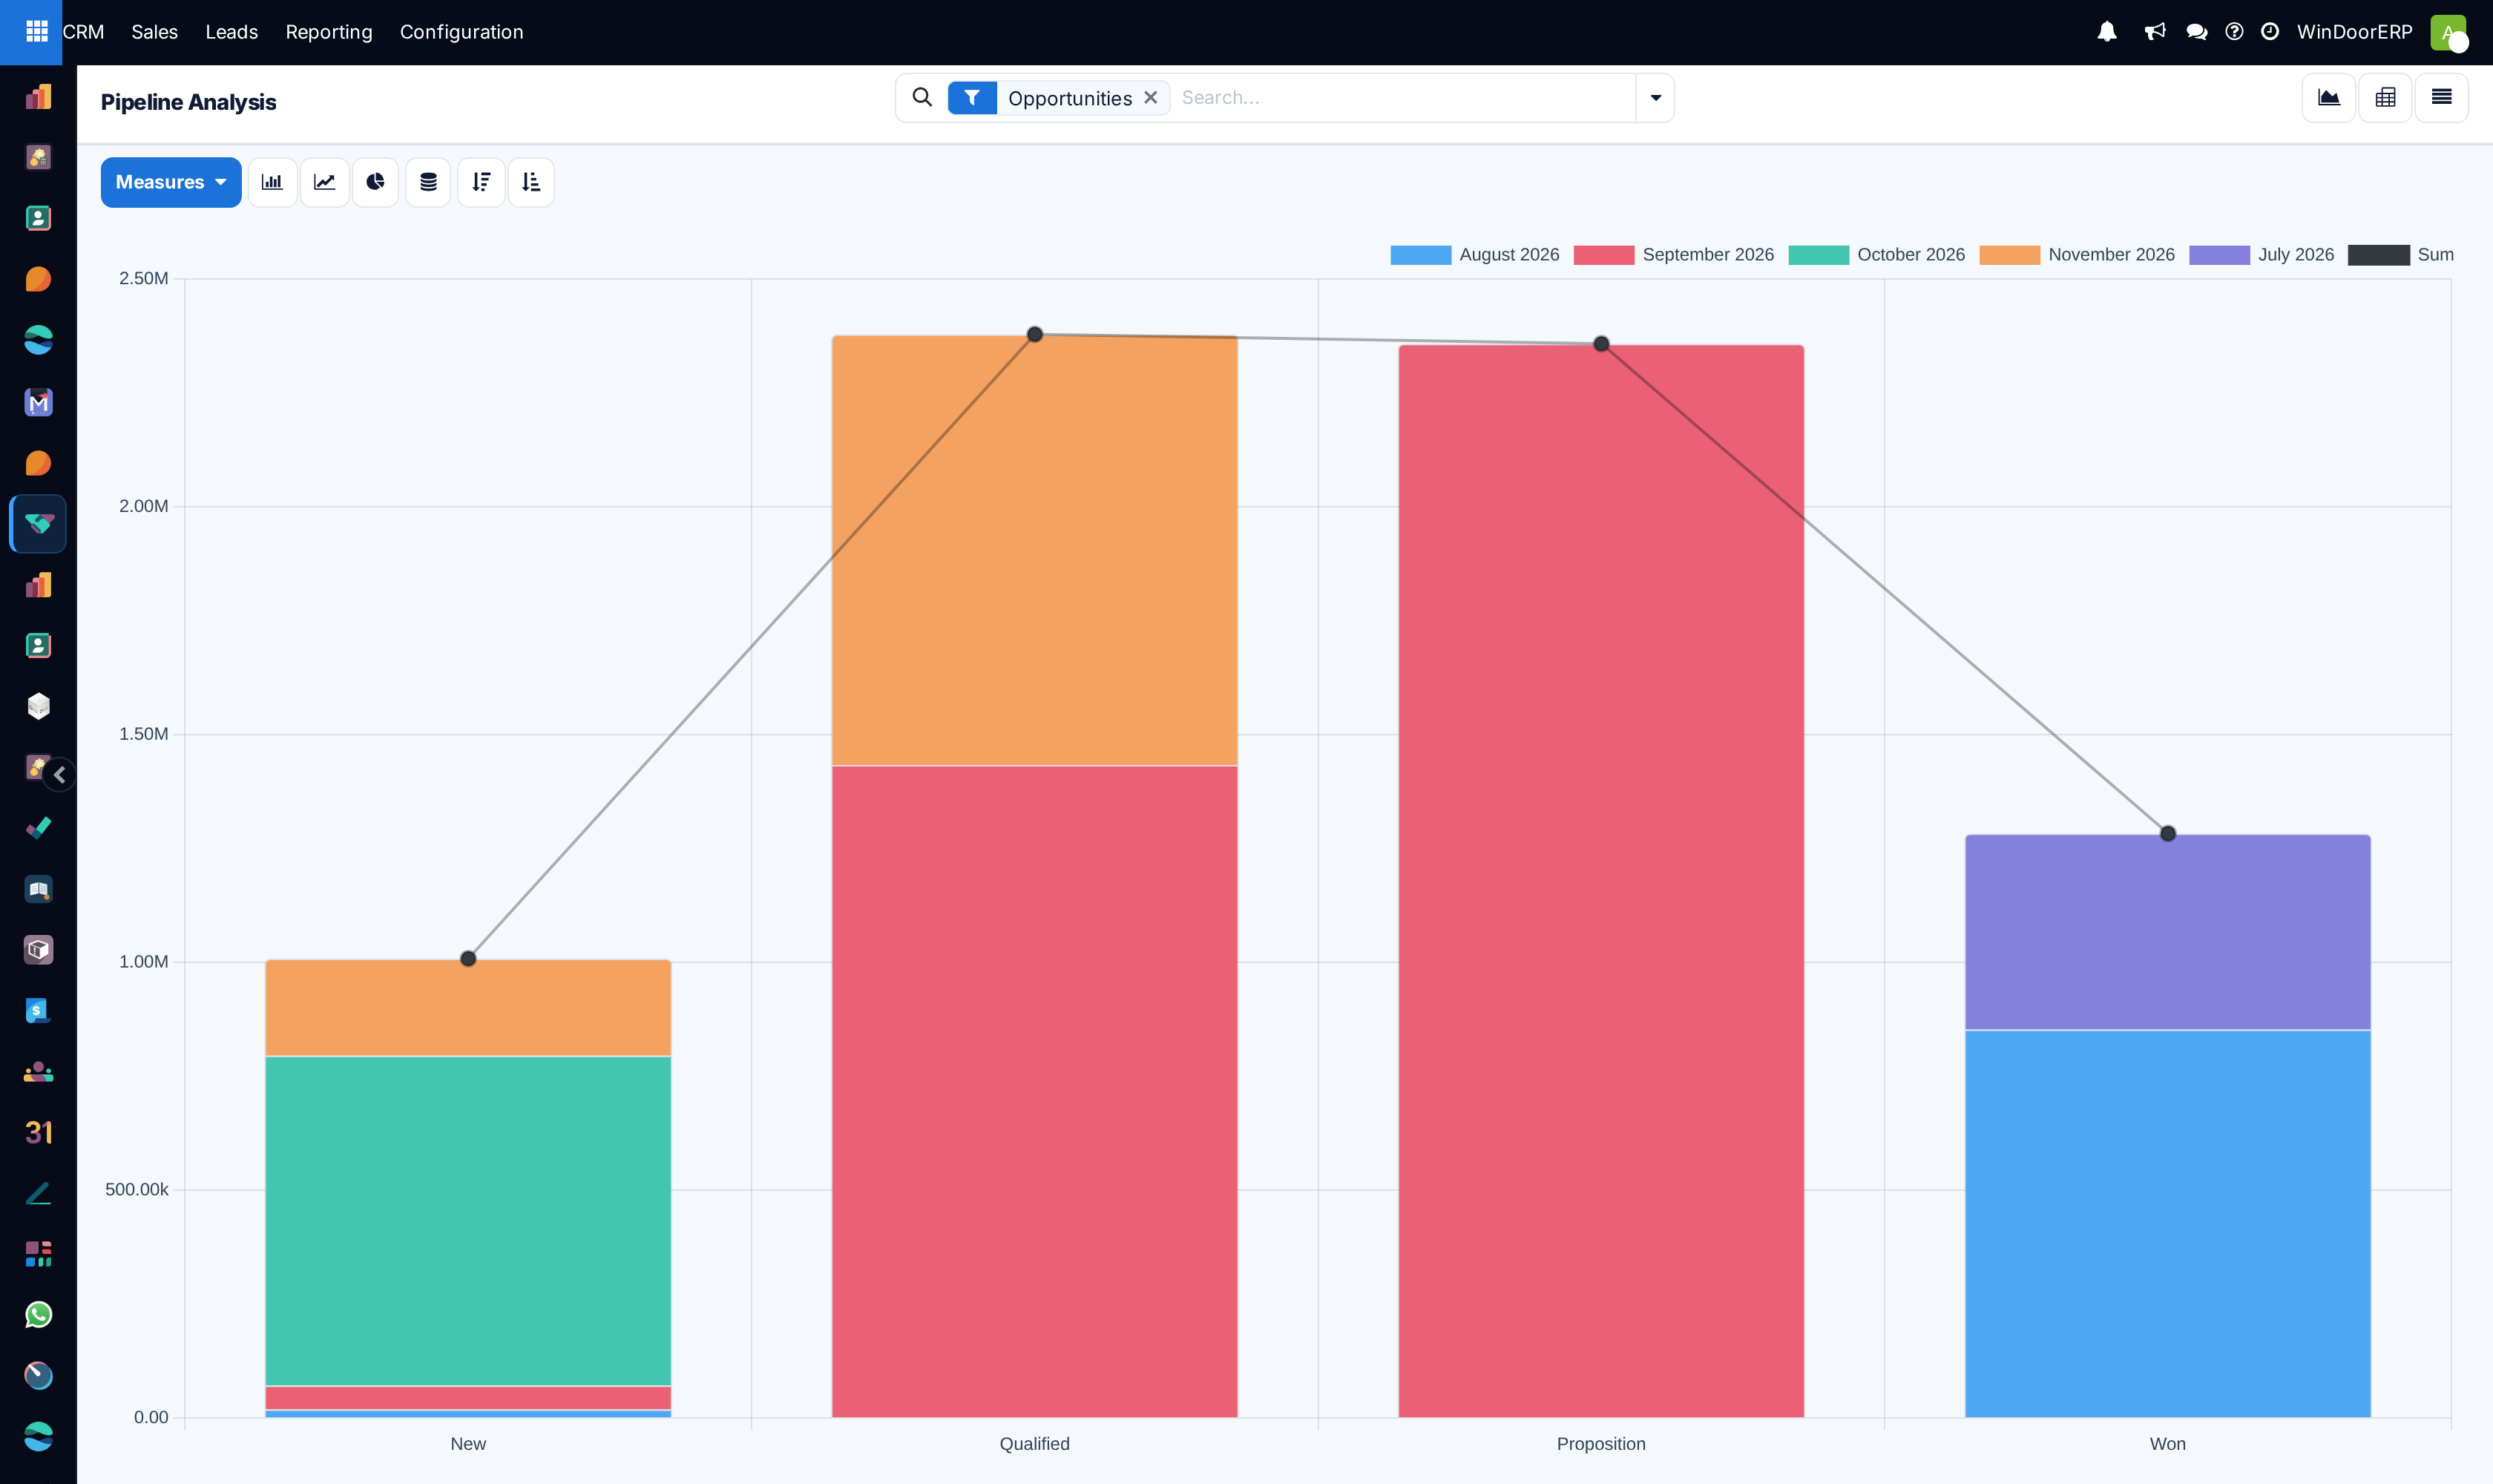
The graph view — the one the screen opens on — gives bar, line and pie renderings of the same measures, which is the faster read for a management meeting.
Example
Measure Prorated Revenue, rows by Salesperson, columns by Expected Closing: Month — a weighted forecast per person per month, which is the sales review in one screen.
Measure Days to Close, rows by Stage — where deals actually stall, as opposed to where people think they stall.
-
01
Click Measures and pick what to total: Expected Revenue, Prorated Revenue, Probability, Days to Assign, Days to Close, or a simple count. Recurring revenue measures appear only when that option is enabled.
-
02
Change the row grouping to Salesperson, Sales Team, Stage, Country, City, Campaign, Medium, Source or Lost Reason.
-
03
Change the column grouping to a date — Expected Closing by month or quarter is the useful one for forecasting.
-
04
Click any cell to expand it a level deeper, and use the ⤓ button to send the whole matrix to a spreadsheet.
Win and loss
The same reporting screens answer the win/loss question with the search panel rather than a different report: filter Won or Lost, then group by Lost Reason, by salesperson or by source. Counting Won against Lost over a period gives the conversion rate; totalling Expected Revenue on the lost deals gives what that reason cost you.
This only works if losses are recorded with a reason. A deal that is deleted, or left open forever, is a deal that never appears in either column.
Common mistakes
- Reading a Forecast column as committed orders. It is prorated — weighted by probability — and the unweighted number is larger.
- Typing a probability once and forgetting it. Manual entry permanently switches that deal off the prediction, so it will still read 80% in six months.
- Leaving Expected Closing empty, which keeps the deal out of every month of the forecast while it still shows on the pipeline.
- Dragging cards forward a month to keep the board tidy, which converts the forecast into a description of hope.
- Putting a maintenance contract into Expected Revenue instead of Recurring Revenues, which inflates the one-off pipeline and hides the MRR.
- Marking deals lost without a Lost Reason, which leaves the win/loss analysis with nothing to group by.
Was this article helpful?
Thanks — your feedback helps.
Running a window or door factory?
Ask for a demo