Put it on one screen
Build the executive dashboard
Why this step
Seven reports nobody opens are worse than one dashboard everybody sees. Build the spreadsheet dashboard and the KPI cards that carry the numbers above, and put it where the decision is actually taken.
What this does
Empowers executive leadership with customizable multi-tab spreadsheet dashboards combining live factory production throughput, sales pipeline velocity, and cash collection KPIs.
Before you start
- Executive or Managerial reporting privileges.
Steps
Important
Spreadsheet Dashboards update in real-time without requiring manual Excel exports or external BI data sync bridges.
-
01
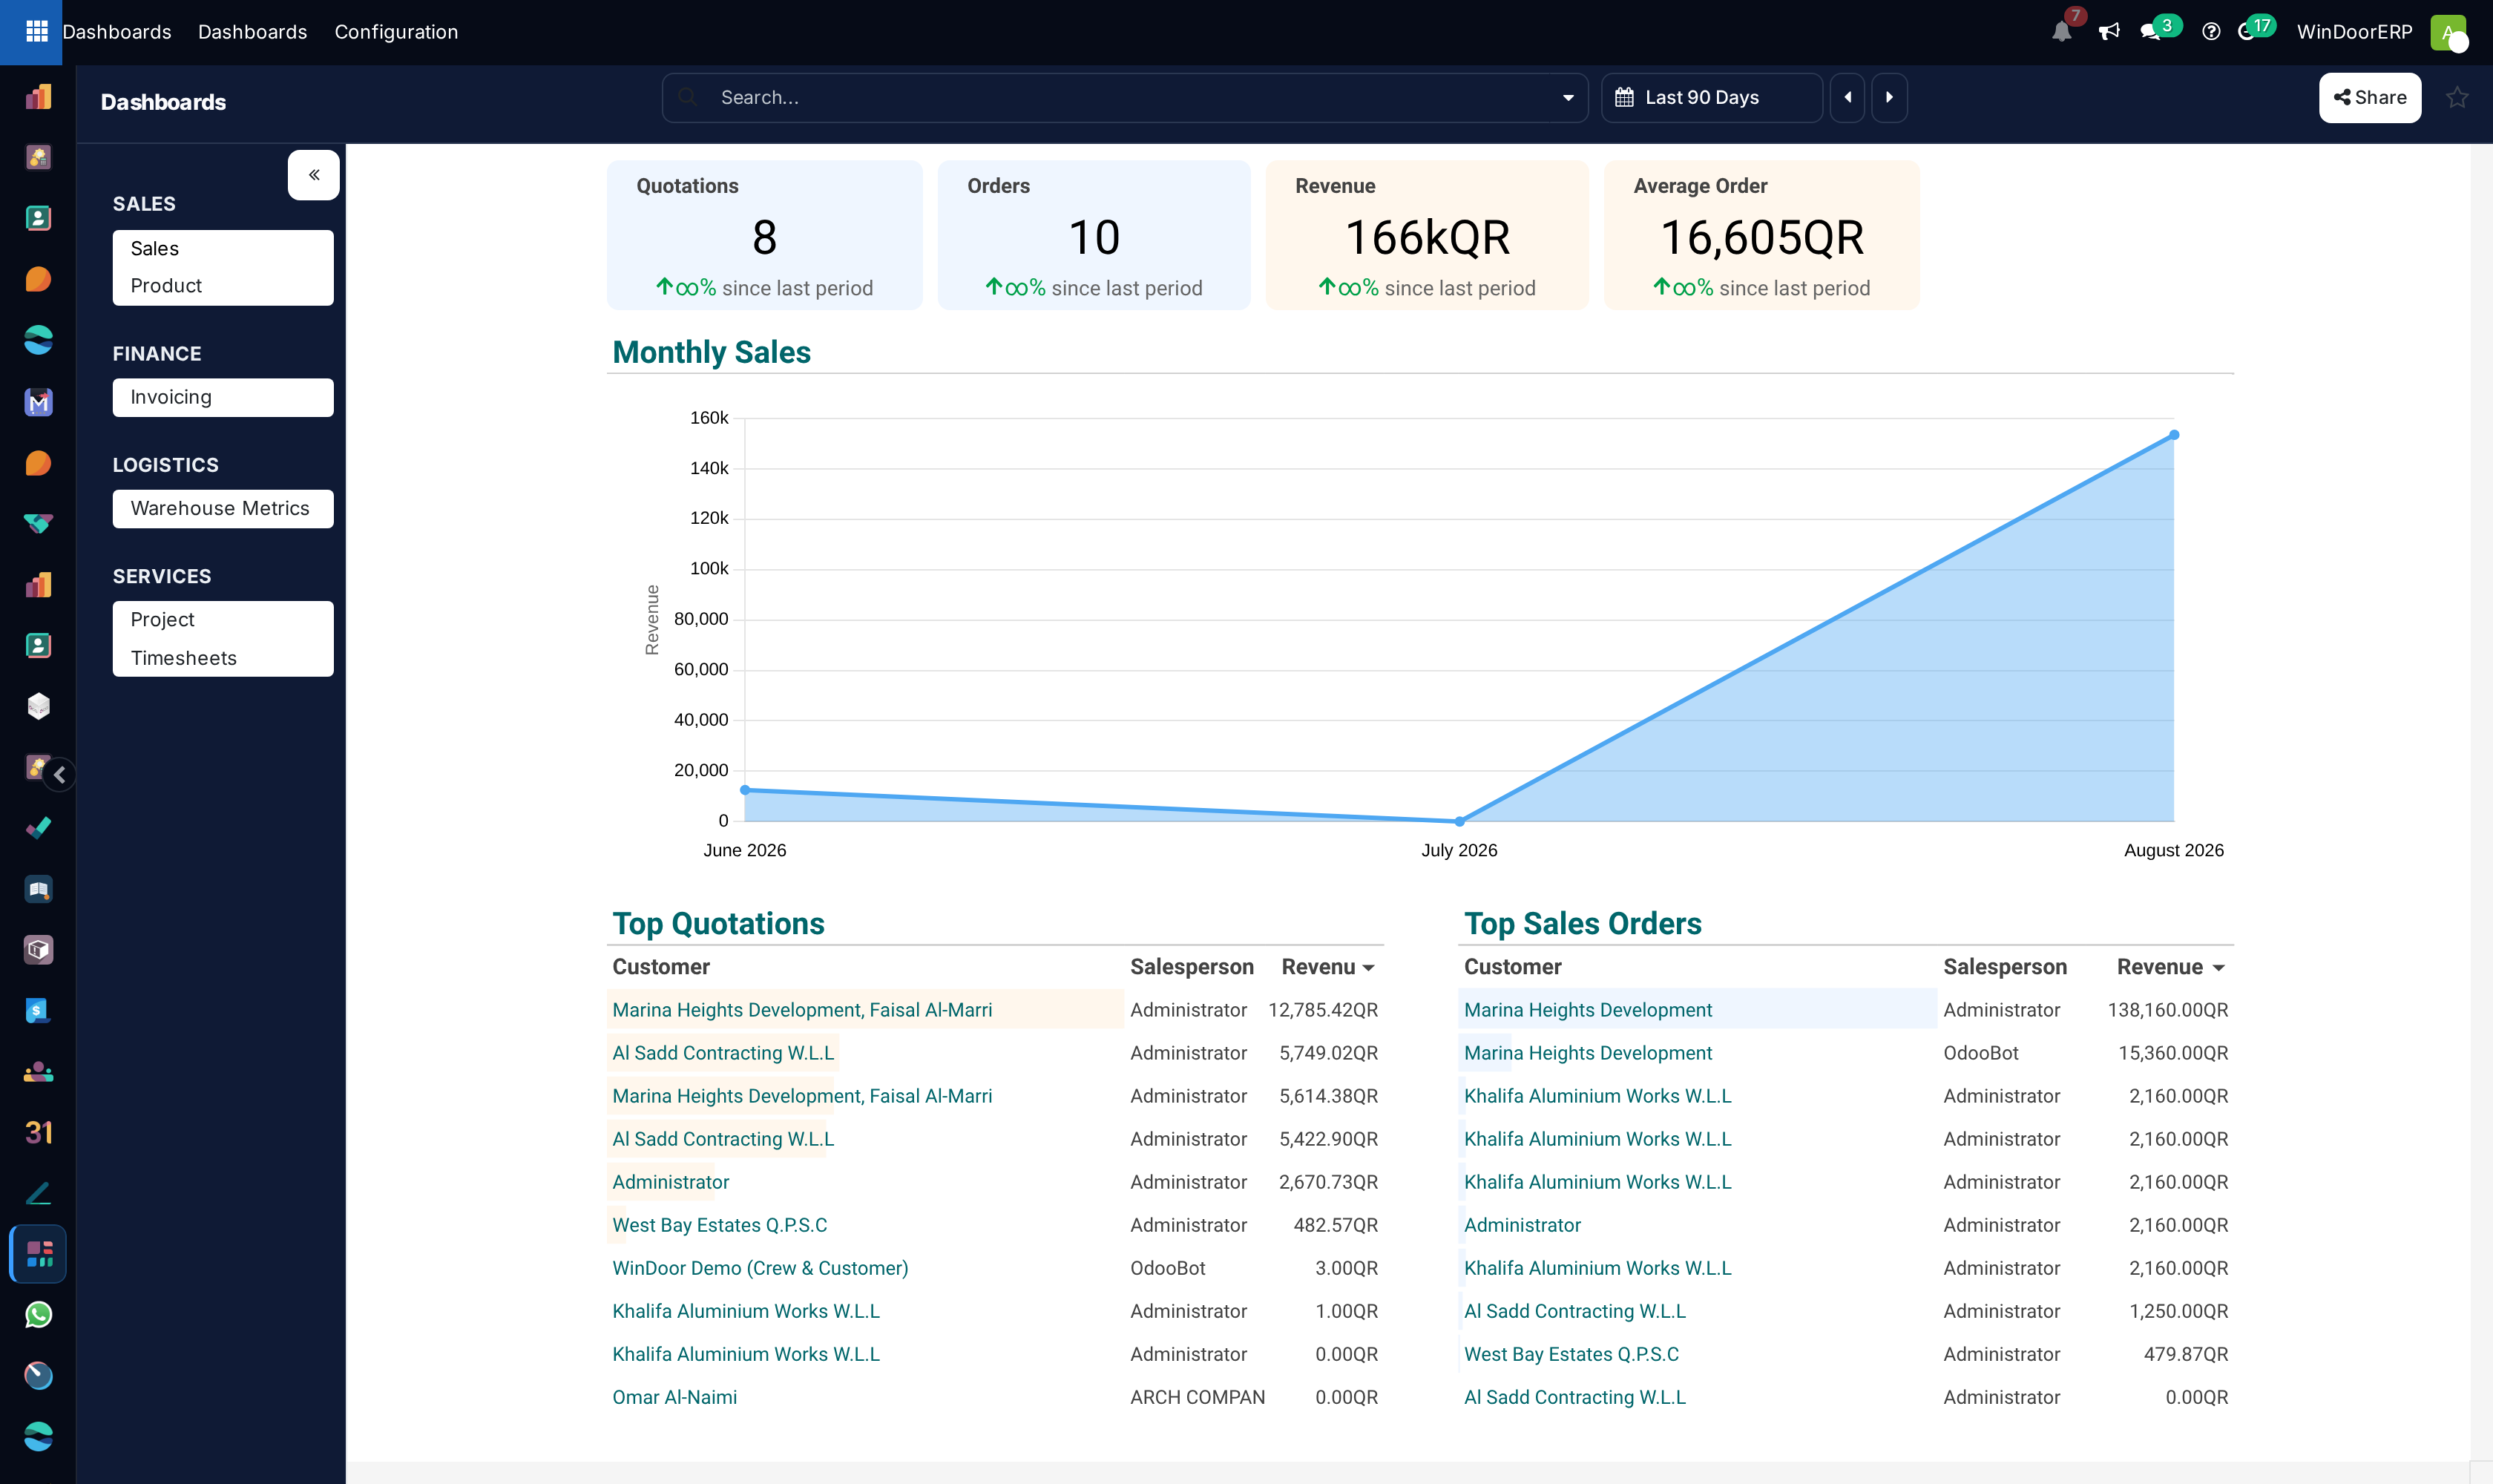
Open Dashboards to access your custom visual command center.
-
02
Interact with real-time pivot tables, charts, and financial formulas synced live with the ERP database.
-
03
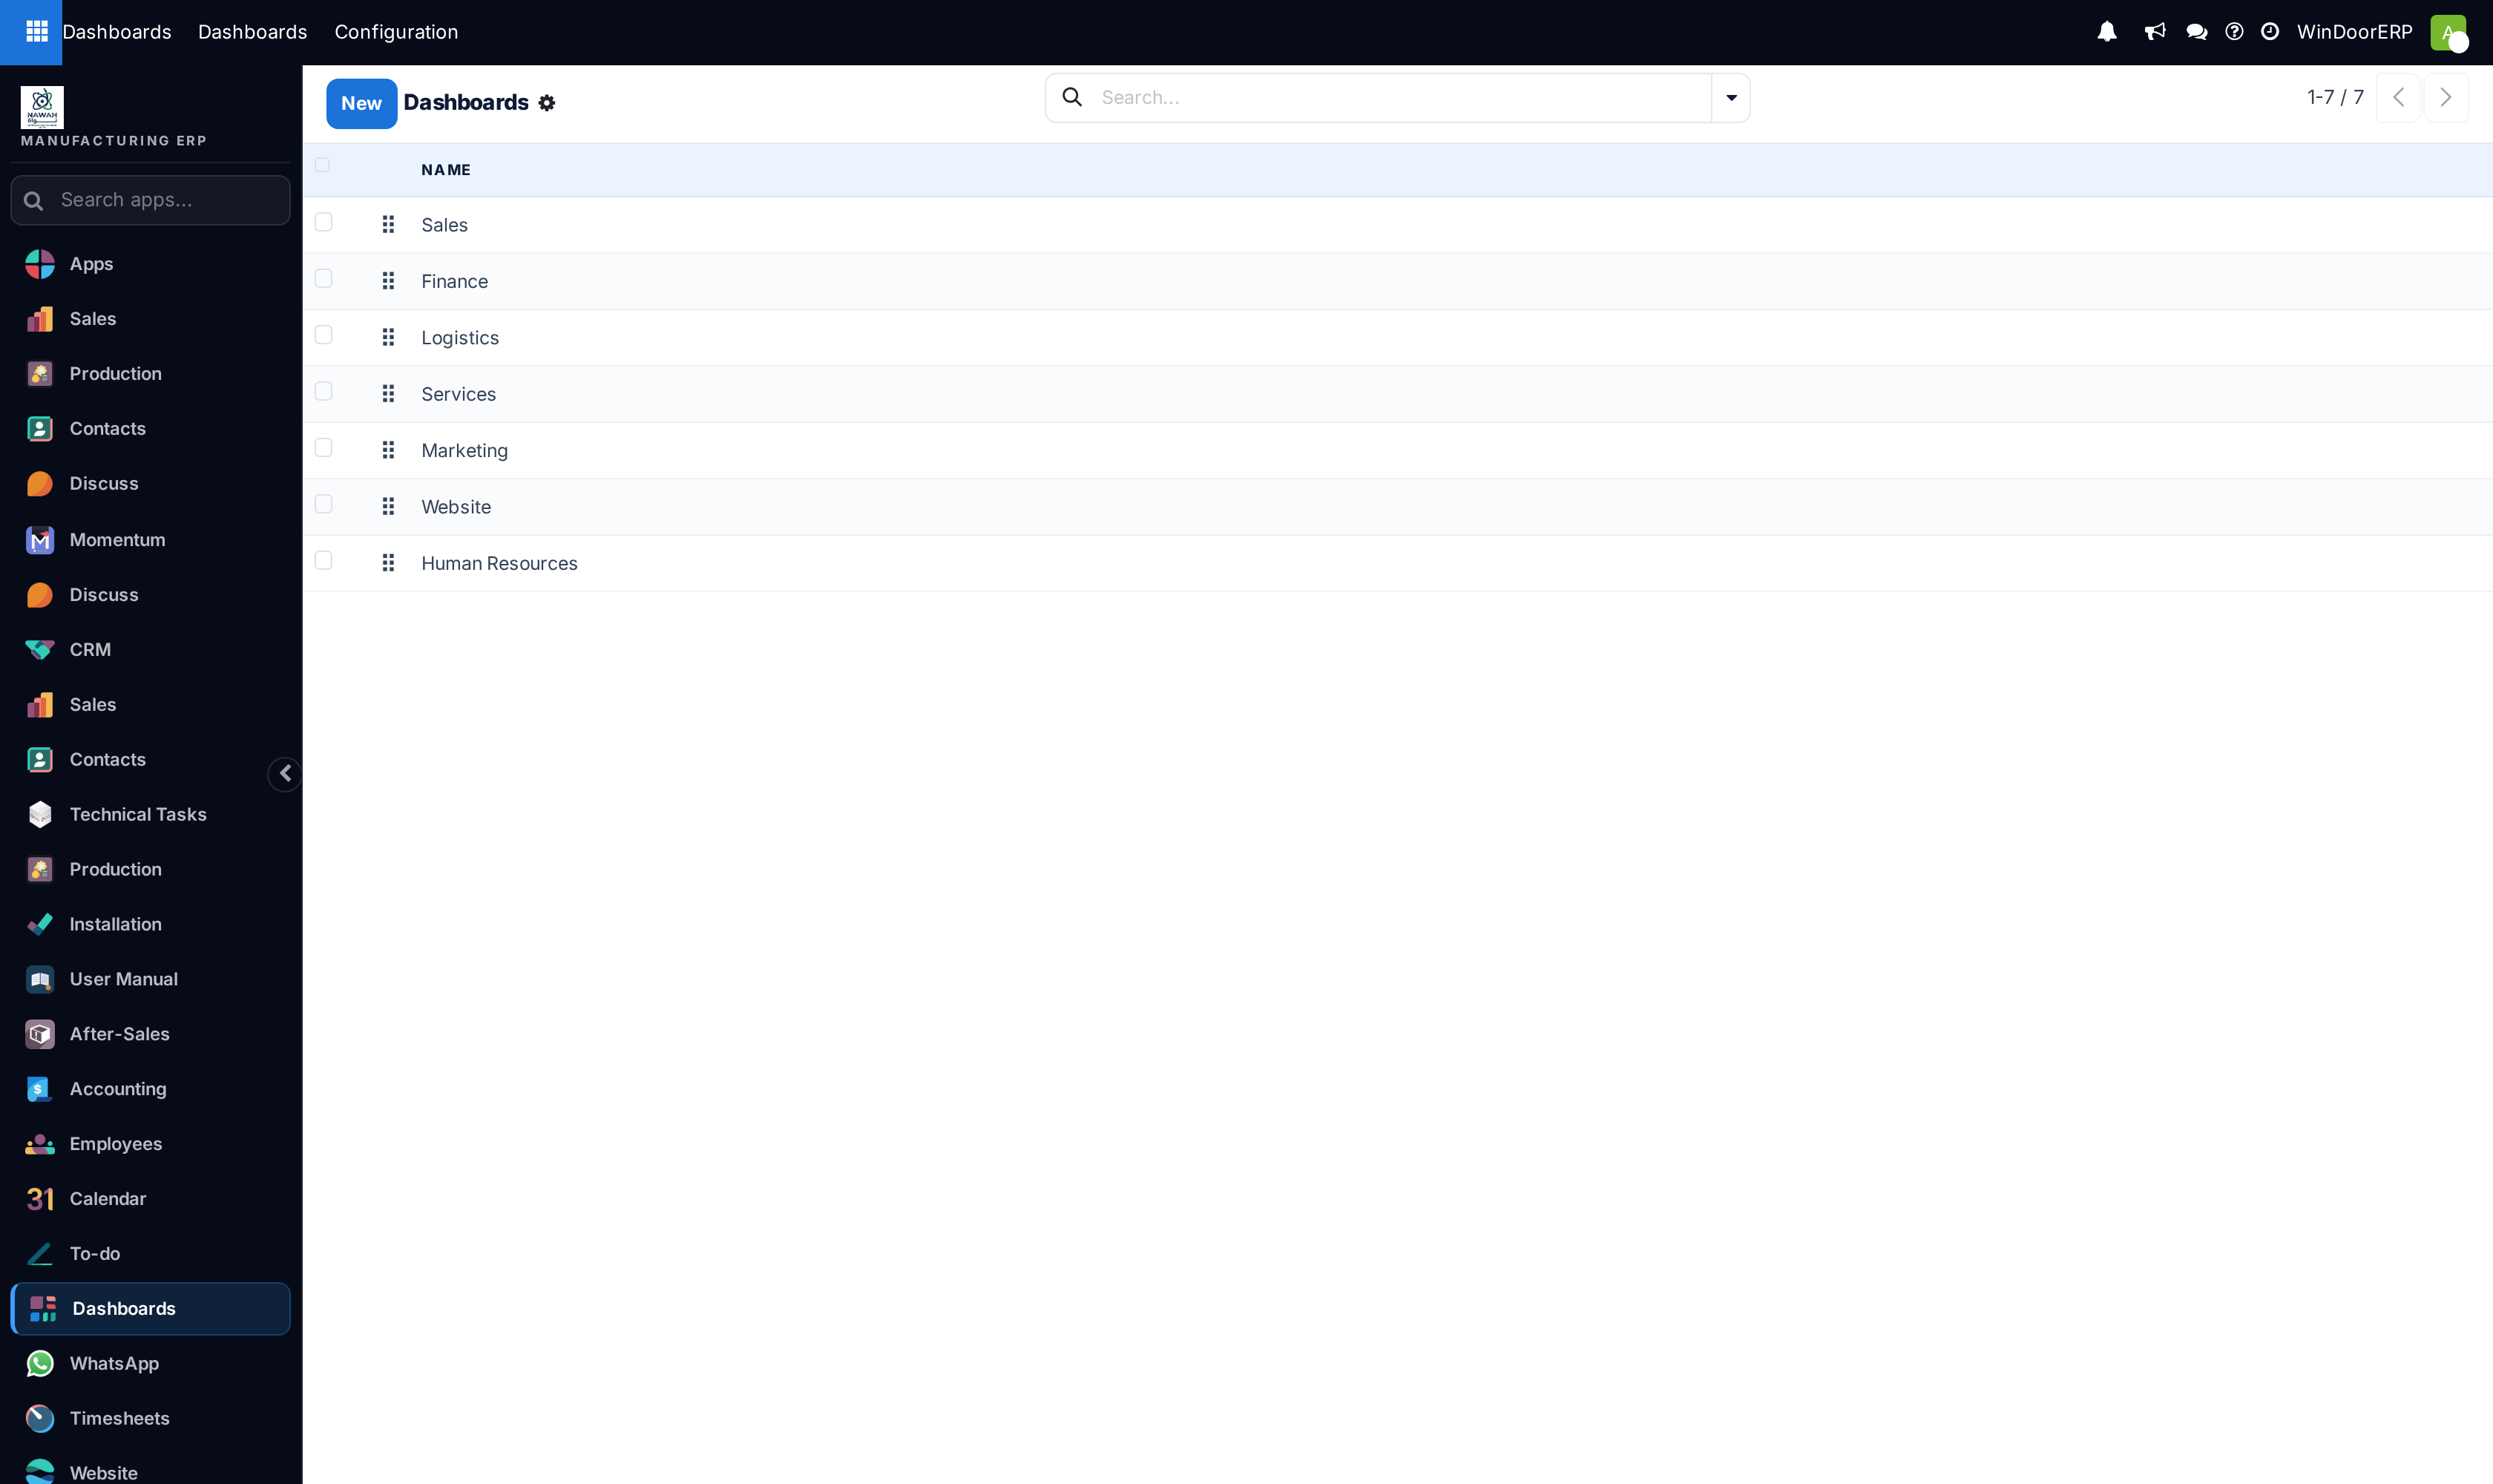
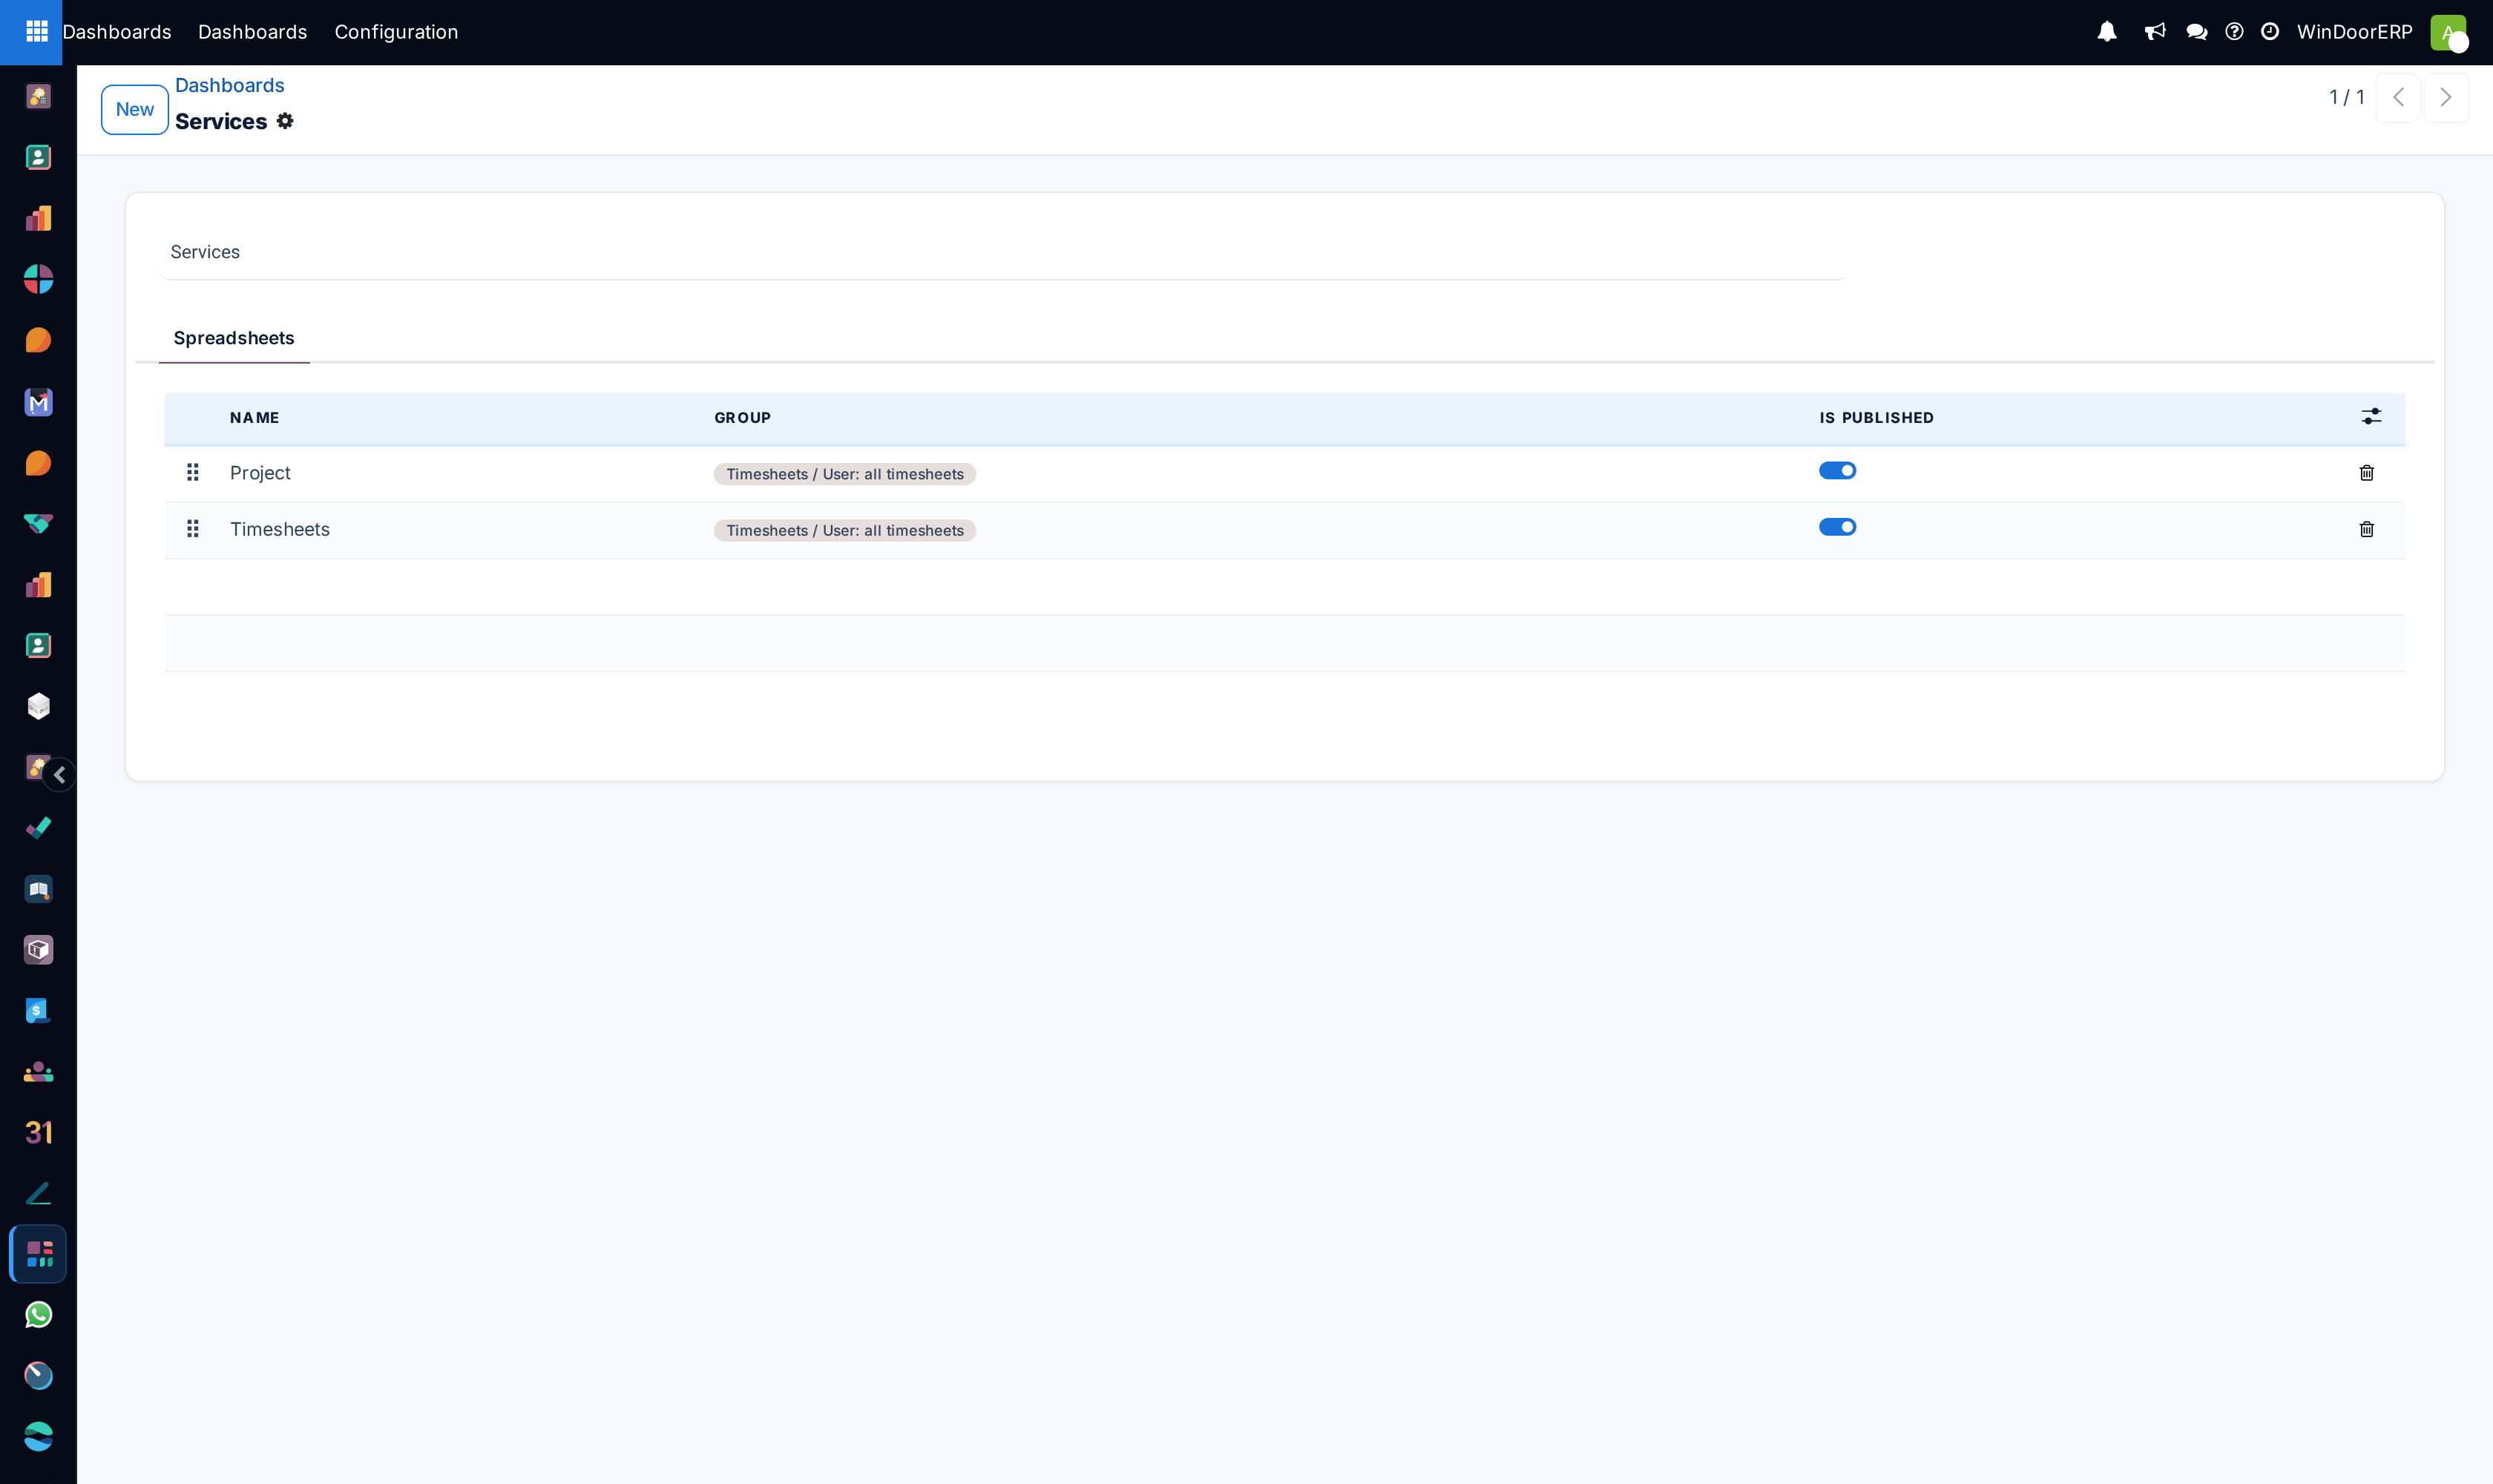
Navigate to Configuration › Dashboards to build new board layouts.
-
04
Embed live filters (e.g. Date Range, Sales Team, Factory Line) to drill down into operational variances.
Common mistakes
- Hardcoding static numbers into dynamic spreadsheet formula cells.
- Sharing sensitive executive financial dashboards with unprivileged department staff.
Checkpoint
One screen carries a number from every department, live, and someone looks at it weekly.