See what you actually spend
Read the spend, and the price drift
Why this step
Setup finishes where reporting starts. Spend by supplier and material, and the variance between what you agreed and what you were billed, are what tell you a year later whether any of this worked.
What this does
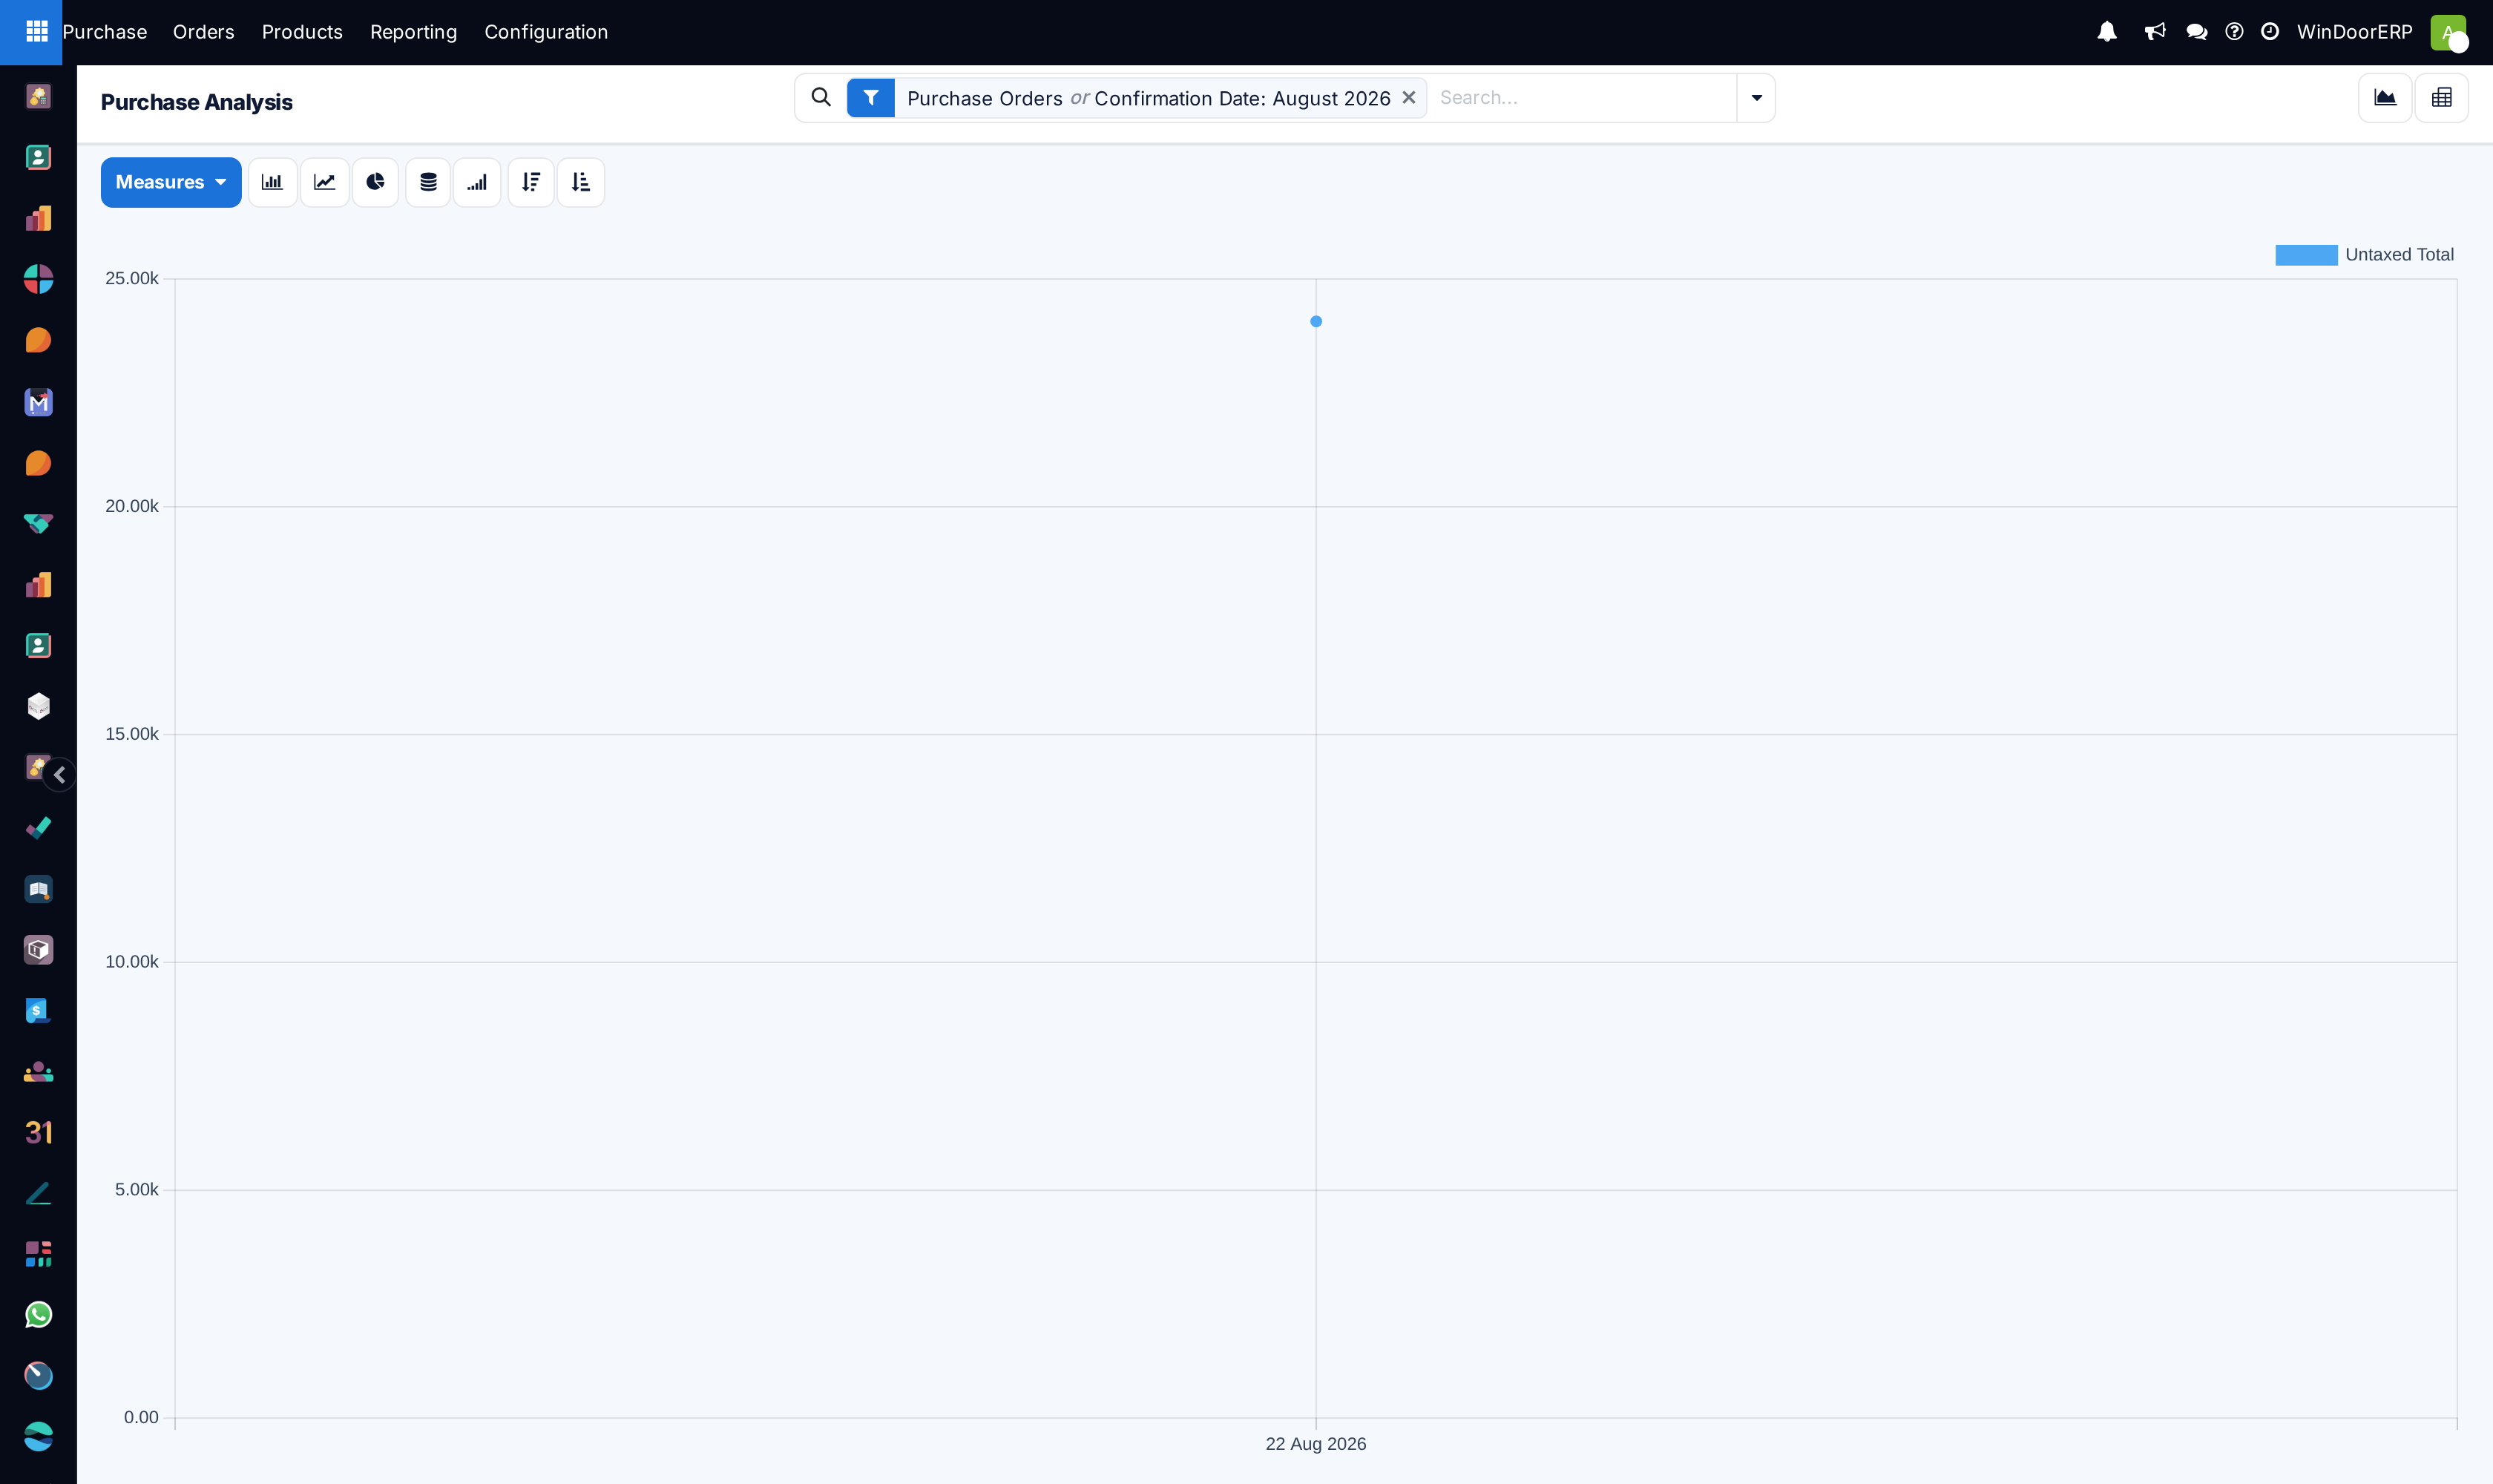
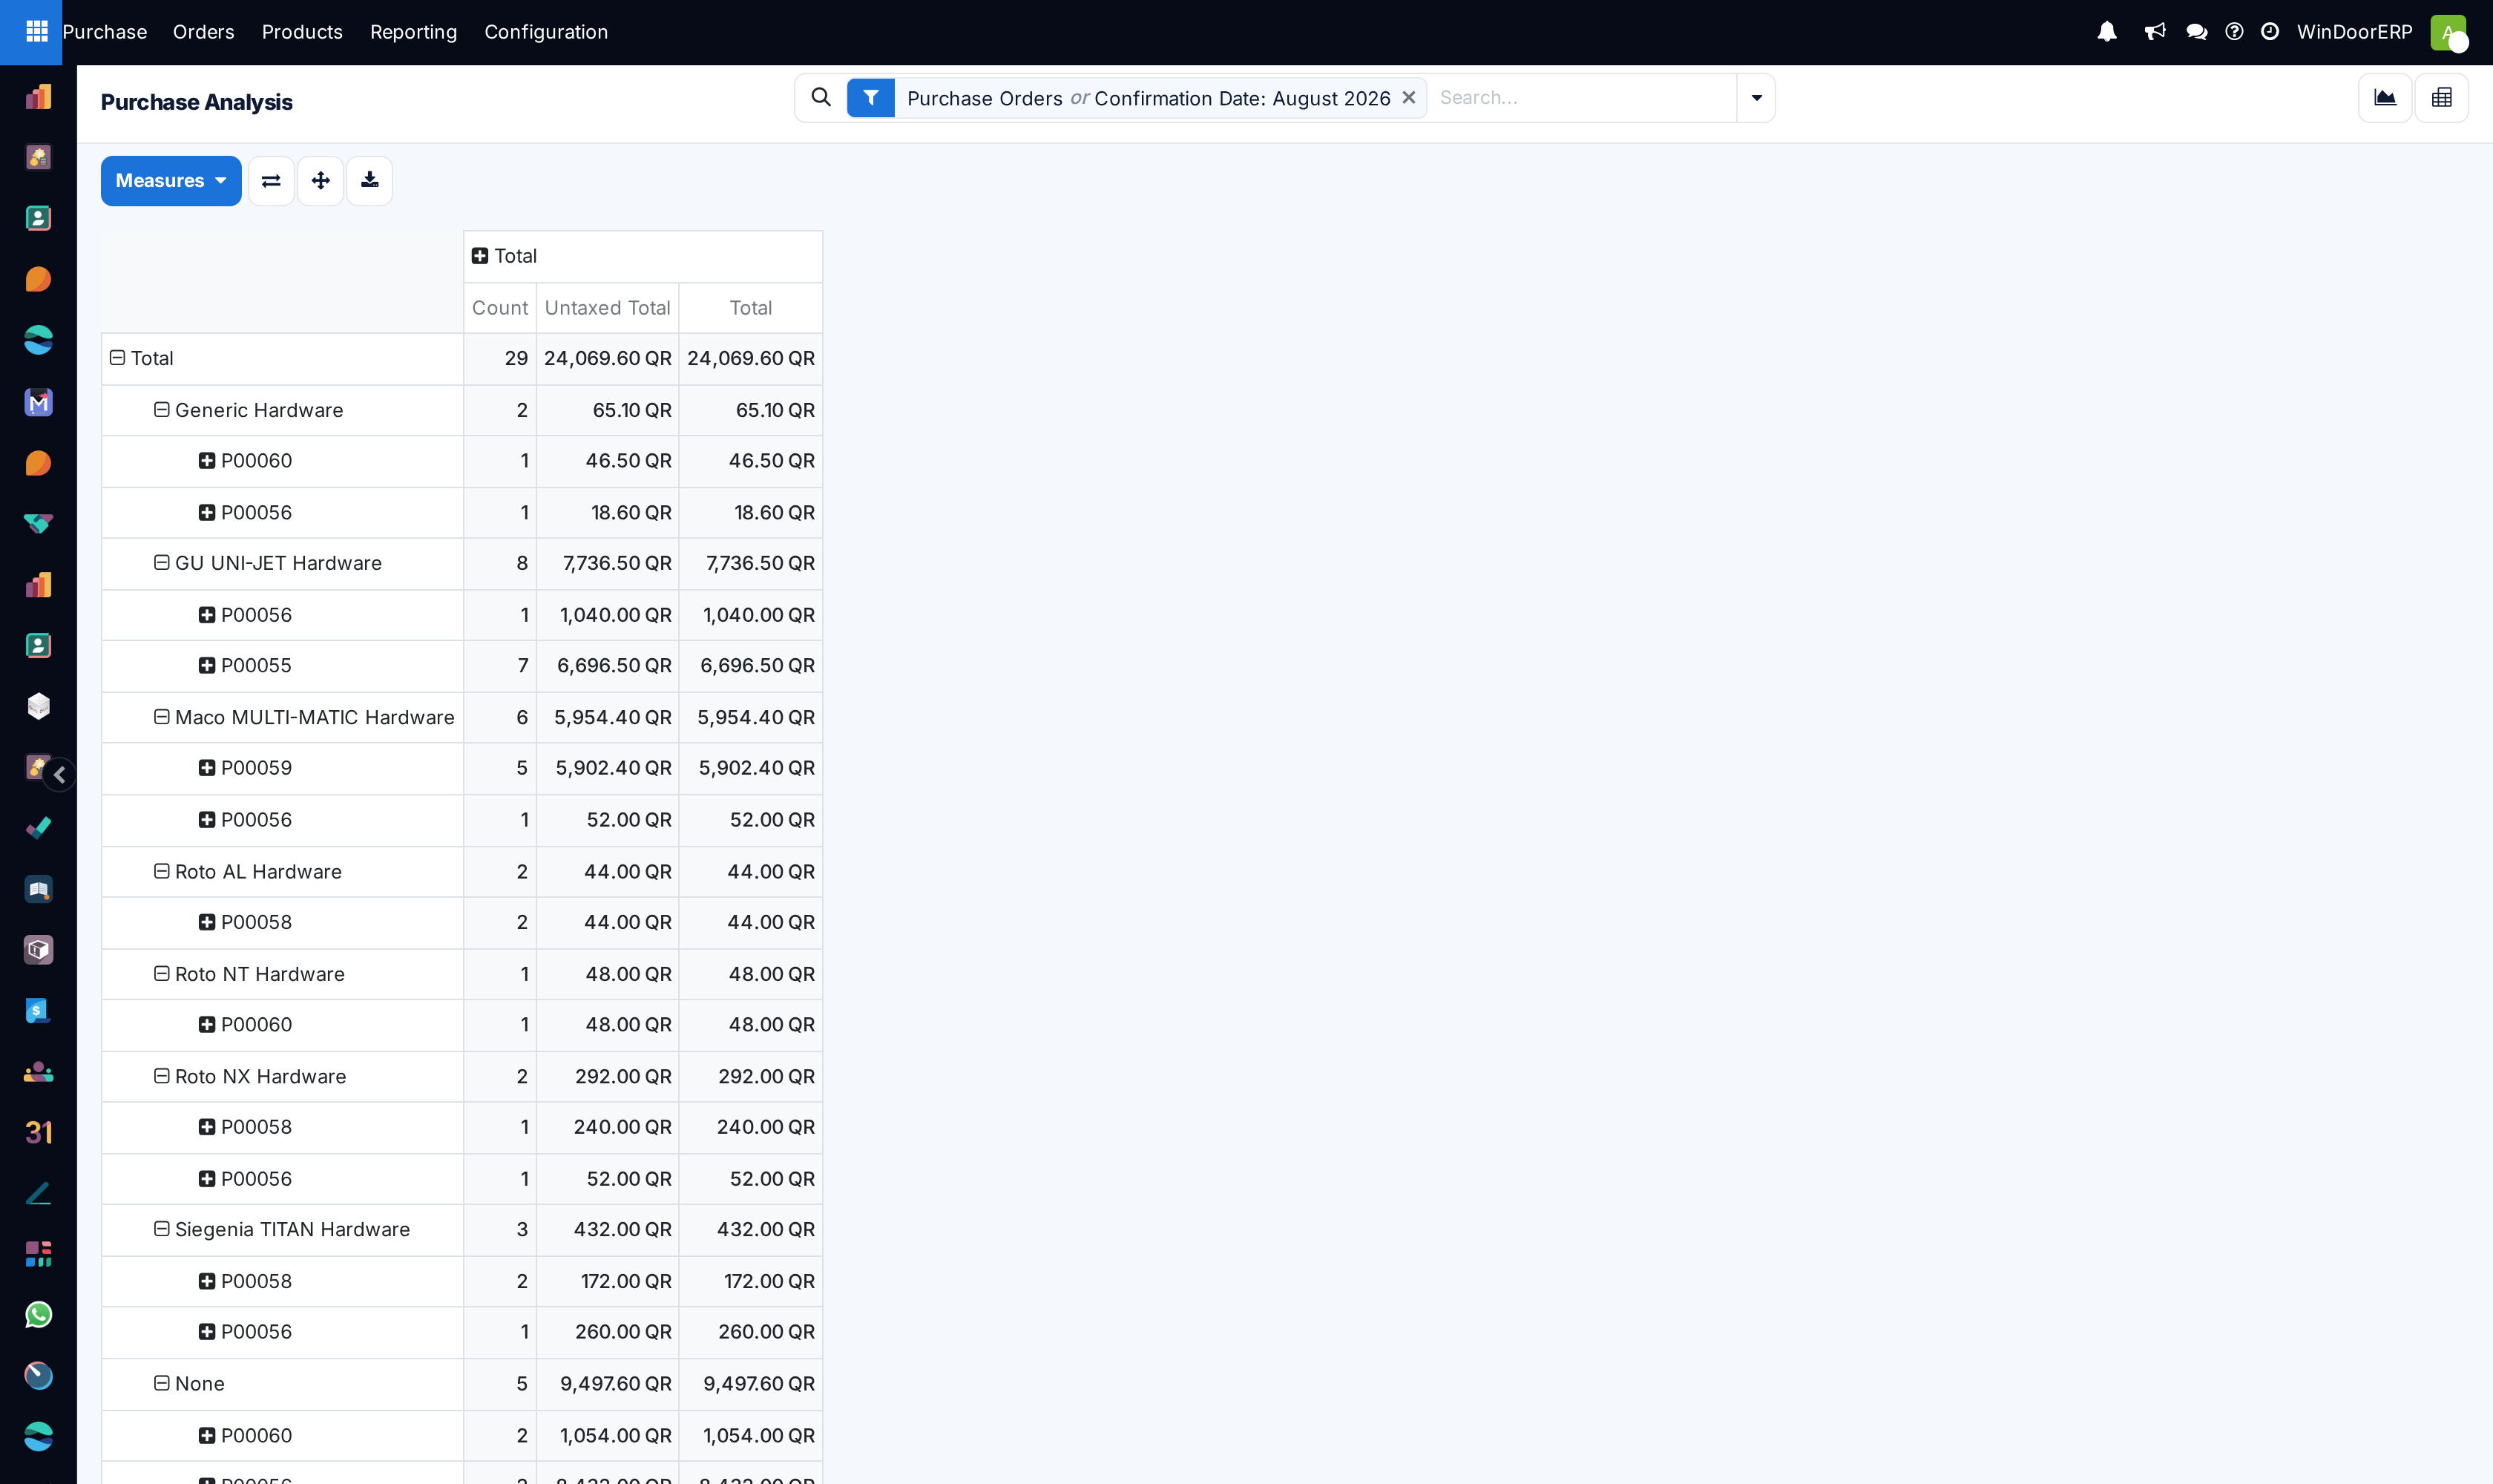
Delivers executive business intelligence into total procurement spend, raw material commodity trends, vendor cost variances, and purchase budget compliance across graphical and pivot views.
Before you start
- Purchase Manager or Finance Director access.
Steps
Important
Comparing average unit purchase prices over time highlights inflation risks and informs strategic raw material hedging.
-
01
Open Purchase › Reporting › Purchase.
-
02
Toggle between Graph and Pivot views.
-
03
Select Measures: evaluate Untaxed Total, Quantity Billed, Average Price, and Lead Time to Purchase.
-
04
Group by Vendor and Product Category to audit major spend categories (e.g. Aluminium Extrusions, Glass, Hardware, Consumables).
Common mistakes
- Evaluating spend totals without separating capital equipment tooling from consumable project materials.
- Not auditing invoice price variances against initial purchase order agreed rates.
Checkpoint
You can name your three largest materials by spend, and whether their unit price has moved this year.